XVIII. COMMUNICATIONS BIOPHYSICS Prof. W. A. Rosenblith Prof. M. H. Goldstein, Jr Dr. J. S. Barlow* Dr. M. A. B. Brazier Dr. E. de Boer Dr. B. G. Farley Dr. L. S. Frishkopf Dr. Ursula O. Keidel + Dr. W. D. Keidel Dr. N. Y. S. Kiang Dr. T. T. Sandel O. Guti6rrezt Aurice V. Albert R. M. Brown E. O. Dunlavey G. E. Forsen Mrs. Margaret C. D. Geisler H. C. Ingrao C. E. Molnar W. T. Peake C. A. Steinberg T. F. Weiss Z. Freeman RESEARCH OBJECTIVES
The Communications Biophysics group continues its quantitative studies of the electrical activity of the nervous system, with particular emphasis upon problems of sensory communication. In these investigations increasing use is being made of special-purpose and general-special-purpose computers in the processing of the data.
Both a digital computer (1) and an analog correlator system (2, 3) are being used in an effort to quantify certain aspects of the electroencephalogram. The relation between electric responses evoked by flashes and the alpha rhythm (4) has also been investigated.
Our studies of evoked responses from various sensory systems (5, 6, 7, 8) of both anesthetized and unanesthetized animals are now accompanied by experiments in which electric responses to clicks are recorded from the skull of awake or asleep subjects
(9, 10).
The potentialities of this electronic method of detecting responses (11) in
humans who may be involved in communication tasks appear to be great.Several psychoacoustic experiments have been conducted (12, 13) and an attempt has
been made to compare the current status of auditory psychophysics with current data
on the electrophysiology of the auditory system (14).
During the past year, we have started a joint project with the Massachusetts Eye
and Ear Infirmary; the research will be conducted in the Eaton Peabody Laboratory of
Auditory Physiology, which is now under construction in the Infirmary Courtyard.
We
continue our cooperation with the Neurophysiological Laboratory of the Neurology
Ser-vice of the Massachusetts General Hospital.
W. A. Rosenblith
[See following page for references.]
From the Neurophysiological Laboratory
General Hospital.
TStaff Member, Lincoln Laboratory, M.I.
of the Neurology Service of Massachusetts
t
Visiting Fellow, Department of Electrical Engineering, M.I.T.
Fellow in the School of Advanced Study, M.I.T.
(XVIII. COMMUNICATIONS BIOPHYSICS)
References
1.
B. G. Farley, L. S. Frishkopf, W. A. Clark, and J. T. Gilmore, Computer
techniques for the study of patterns in the electroencephalogram, paper presented
at the Symposium on Pattern Recognition, University of Michigan, Oct. 21-23, 1957.
2.
J. F. Kaiser, Correlation computer design study, Informal Summary Report
SRL 377, Servomechanisms Laboratory, M.I.T., March 27, 1957, pp. 1-140.
3.
J. S. Barlow, M. A. B. Brazier, and W. A. Rosenblith, The application of
auto-correlation analysis to electroencephalography, National Biophysics Conference
Abstracts, March 1957, pp. 7-8.
4.
J. S. Barlow and M. A. B. Brazier, A study of the interdependence of the alpha
rhythm and responses evoked by flash in man, First International Congress of
Neurological Sciences, Brussels, July 1957, p. 143.
5.
M. H. Goldstein, Jr. and N. Y. S. Kiang, Synchrony of neural activity in electric
responses evoked by transient acoustic stimuli (J. Acoust. Soc. Am., in press).
6.
T. T. Sandel and N. Y. S. Kiang, Off-responses to noise bursts at the auditory
cortex of the cat, J. Acoust. Soc. Am. 29, 1249 (1957).
7. W. D. Keidel, U. Keidel, and N. Y. S. Kiang, Cortical and peripheral responses
to vibratory stimulation of the cat's vibrissae, paper presented at the American
Physiological Society Meeting, Iowa City, Sept. 3-6, 1957.
8.
N. Y. S. Kiang and M. H. Goldstein, Jr., Evoked cortical responses and
anes-thesia, Quarterly Progress Report, Research Laboratory of Electronics, M.I. T.,
July 15, 1957, pp. 142-144.
9.
C. D. Geisler, L. S. Frishkopf, and R. M. Brown, The "early" response to clicks
in awake subjects, Quarterly Progress Report, Research Laboratory of Electronics,
M.I.T., July 15,
1957, pp. 144-148.
10.
C. D. Geisler and L. S. Frishkopf, Development of the K-complex with sleep,
Quarterly Progress Report, Research Laboratory of Electronics, M.I.T.,
July 15, 1957, pp. 148-150.
11.
J. S. Barlow, An electronic method for detecting evoked responses of the brain
and for reproducing their average waveforms, EEG Clin. Neurophysiol. 9,
340-343 (1957).
12.
E. de Boer, Observations on inharmonic signals, J. Acoust. Soc. Am. 29, 780
(1957).
13.
M. H. Goldstein, Jr. and T. T. Sandel, Detection of beats in repeated bursts of
tone, J. Acoust. Soc. Am. 29, 1257 (1957).
14. W. A. Rosenblith, Relations between auditory psychophysics and auditory
electro-physiology, Trans. New York Acad. Sci. 19, 650-657 (1957).
A. DETECTION AND MASKING OF BEATS IN REPEATED BURSTS OF TONE
Listeners report hearing beats in repeated bursts of tone of low intensity,
pro-vided that the modulation frequency (i.e., burst rate) stands in a nearly harmonic
relation to the carrier frequency (i.e., frequency of the tone) and provided that certain
conditions of rise time of the bursts and carrier frequency are met.
A typical signal
that will give rise to beats at a rate of 2 per second might be one in which bursts of a
2001-cps tone are repeated at a rate of 200 per second; the bursts of tone are presented
(XVIII. COMMUNICATIONS BIOPHYSICS)
at a level of 35 db above threshold with a rise time of 0.25 msec for each burst, and a sound-time fraction of 0.5.
In one group of experiments listeners were asked to report the presence or absence of beats as the frequency of the carrier was slowly changed. For a given test, repe-tition rate, sound-time fraction, and rise time were held constant. For nearly har-monic signals, the probability of detection of beats is greater for short rise times and carriers of relatively low frequency.
In another group of experiments the amount of wideband noise and 4-kc lowpass-filtered noise that is needed to mask these beats was measured. The signals that were used varied only in rise and decay times. We found that the spectral level of wideband noise needed to mask these signals was approximately the same, regardless of rise time. However, 4-kc lowpass noise was much more effective in masking beats pro-duced by signals with slow rise and decay than in masking beats propro-duced by signals with fast rise and decay.
The Fourier spectrum of these nearly harmonic bursts of tone contains pairs of frequency components separated by twice the difference in frequency between the fre-quency of the carrier that was used and the nearest frefre-quency that is harmonic with the burst rate. When beats are audible, they are judged to have a rate that is equal to this frequency separation. The "pairs" appear at the low-frequency end of the spectrum and disappear when the rise time of the signal and/or the carrier frequency are sufficiently increased. The beats also disappear under these conditions. Beats may also be detected for a signal with its carrier frequency near the midpoint between harmonic frequencies of the burst rate. For these semiharmonic signals, the Fourier spectrum also contains a number of pairs of components spaced by the beat rate.
M. H. Goldstein, Jr., T. T. Sandel
B. TIME COURSE OF ADAPTATION OF EVOKED RESPONSES FROM THE CAT'S SOMESTHETIC AND AUDITORY SYSTEMS
In previous experiments "dynamic" and "steady-state" curves were obtained for cortical responses to vibratory stimulation of the cat's whiskers (1). This report pre-sents similar curves for the periphery and cortex of both the somesthetic and auditory systems.
The peripheral responses (compound action potentials) were recorded with gross electrodes at the maxillary nerve for the somesthetic system and at a location near the round window for the auditory system. The cortical responses were recorded from the relevant cortical projection areas. The stimuli were either trains of pulses to the whiskers or trains of clicks delivered to the ear.
AMPLITUDE AMPLITUDE 100% 100%
-30
PR
100
50% -50% 10S
80
400
o000 1500/SEC 0 _________________ I0
0 5 10 15 20 25 30 10 20 30 40 50 DB RE THRESHOLD DB RE THRESHOLD (a) (b) Fig. XVIII-1.(a) Amplitude of the maxillary-nerve response (PR) to trains of pulses as a function of stimulus intensity for repetition rates of 1, 3, 10, 30, and 80/sec. Amplitudes are expressed as percentages of the largest amplitude of response to a whisker pull that was obtained from this animal. Curves are for steady-state amplitudes. The dynamic curve for each repetition rate is essentially the same as the steady-state curve for a rate of 1/sec. The steady-state amplitude-intensity func-tion does not change with respect to repetifunc-tion rate until rates higher than 30/sec are reached. (Dial anesthesia, 75 mg/kg; Cat K-10.) (b) Amplitudes of responses from the auditory nerve as a function of click intensity. Curves within the shaded area represent the ampli-tude of the N -response to the initial click in each train ("dynamic"
response). Curves in the unshaded portion represent the amplitude
of steady-state response. Amplitudes are expressed as percentages of the largest amplitude of the N 1-response to a click that was obtained from this animal. The lines in the individual curves in the shaded area are represented by the same type of line in the corre-sponding steady-state curves. Thus, the solid lines represent
respon-ses at a rate of 30/sec. All responses were measured from the base
line to the peak of the N1-response. (Dial anesthesia, Cat V-103.)
CORTICAL RESPONSE 16 0 S15 14 z - 4 C A T V 1 1 9 S13 / UNANESTHETIZED 7 -_ 12 200 200
/
/
• CAT
V
124
/,/ DIAL 100 -K
7 4 r I i I [ I I I I I I I 0 10 20 30 40 50 60 70 Io 20o 30 40 DB RE THRESHOLD DB RE THRESHOLD (a) (b)Fig. XVIII-2.
(a) Amplitudes of cortical responses to trains of pulses delivered at a rate of 10/sec. The points on the dynamic curve represent the aver-age amplitude of the first three responses in a train; the points on the steady-state curve represent the average amplitude of 3 responses after a steady state had been reached. (Dial anesthesia, Cat K-ll.)
(b) Amplitudes of cortical responses to trains of clicks as a function
of stimulus intensity. The two upper pairs of curves refer to Cat V-119. The lower pair of curves refers to Cat V-124. The two upper curves represent the dynamic steady-state responses of Cat V-119. The two middle curves are for the steady-state responses of Cat V-119. The responses for Cat V-119 are larger for the anesthetized (dotted curve) than for the unanesthetized (solid curve) state. That this is not neces-sarily true, in general, is shown by the lower pair of curves for anes-thetized Cat V-124. The curves for unanesthetized Cat V-124 corresponded so closely with the curves for unanesthetized Cat V-119 that it was unnecessary to include them.
(XVIII.
COMMUNICATIONS BIOPHYSICS)
Fig. XVIII-3.
Responses to clicks delivered at a rate of 10/sec, recorded
simul-taneously at the cortex and the periphery. A concentric electrode was
placed in
AI
with the outer electrode on the surface and the center
electrode 3 mm below the surface of the cortex (upper trace). Upward
deflection indicates negativity of the outer electrode with respect to
the inner electrode.
Peripheral responses are shown in the lower
trace; upward deflection indicates negativity of the "active" electrode.
For all other experiments in this report, recording was done with an
"active" electrode on the surface of the cortex and a reference
elec-trode on the animal's headholder.
the peripheral responses. Insofar as such a comparison can be made, the two
sys-tems differ markedly in
the range of stimulus intensity over which the responses change
in
amplitude. The range for the auditory system (in
decibels) is twice as wide as the
range for the
somesthetic system.
The auditory system also seems to function at
higher frequencies than the somesthetic. (Fig. XVIII-2a and 2b.)
If the cortical responses are compared, we find that the range of intensities, over
which response amplitude varies, is similar for the two systems. This leads us to
suspect that the time course of adaptation may be different at peripheral and cortical
levels.
Figure XVIII-3 demonstrates exactly this point. Here, there is no adaptation
for peripheral responses, while the cortical responses exhibit clearly an adaptation
phenomenon.
It is likely that some of the adaptation that is evident in cortical responses
involves processes that occur between the periphery and the cortex.
W. D. Keidel, Ursula
O.
Keidel, N. Y. S. Kiang, L. S. Frishkopf
References
1. W. D. Keidel, Ursula O. Keidel, and N. Y. S. Kiang, Cortical and peripheral responses to vibratory stimulation of the cat's whiskers, Quarterly Progress Report, Research Laboratory of Electronics, M.I.T., July 15, 1957, pp. 135-139.
C.
STUDIES OF THE AUDITORY NERVOUS SYSTEM BY USING COMBINED
ACOUSTIC AND ELECTRIC STIMULATION
Electrophysiological responses to acoustic-click stimuli, as recorded by gross
electrodes at the periphery and at the auditory cortex, are decreased in amplitude by
124
~al
-r
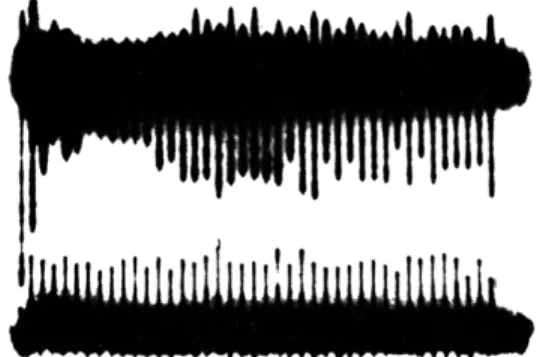
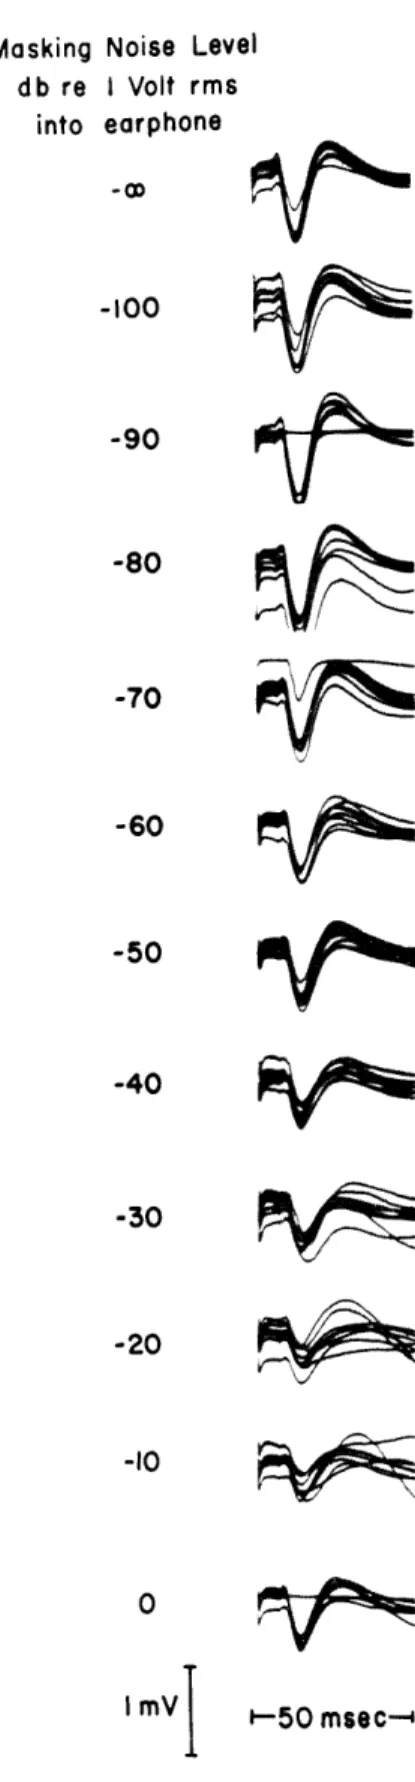
Fig. XVIII-4. Effect of acoustic background noise on cortical responses to electric stimula-tion of the auditory nerve. Upper set of traces: responses with no back-ground noise. Background noise was increased in steps of 10 db for each succeeding picture. Repetition rate for the shocks, 1/sec. These sets of traces were made in succession, with no recov-ery time between them. Superposition of several traces is shown in each set of traces. (Dial anesthesia, Cat-471.)
'-50
msec--Masking db re into Noise Level I Volt rms earphone -100
-90
-80
-70
-60
-50
-40
-30
-20
I
mV I
-10
r^
0
do
q&~P9
jc"=
r
J
F~a
(XVIII. COMMUNICATIONS BIOPHYSICS)
the addition of background noise.
This effect has been generally considered to be the
physiological correlate of masking phenomena and has usually been explained in terms
of refractory properties of the relevant receptors and neurons.
If the addition of
back-ground noise broadens the distribution of the thresholds of the responding first-order
neurons, these units will respond to the click with less synchrony.
This effect would
result in a smaller response, as recorded by gross electrodes.
In order to determine whether masking takes place predominantly at neural levels
or at the receptors, we stimulated the auditory nerve by delivering acoustic signals to
the ear and by applying electric shocks directly to the nerve with bipolar stimulating
electrodes.
Thus, we have two methods of obtaining neural responses, one of which
short-circuits the receptors.
We used responses at the contralateral auditory cortex
as indicators of synchronized neural activity.
The recording electrodes were concentric
electrodes with the center electrode 3 mm below the surface of the cortex and with the
outer electrode on the surface.
It is possible to expose the auditory nerve of a cat by
removing part of the cerebellum and part of the petrous bone.
This approach enabled
us to place fine stimulating electrodes (1 mm apart) on the short stretch of nerve that
runs in the internal auditory meatus.
It is, however, impossible to avoid stimulating
at least part of the ventral cochlear nucleus.
All experiments were conducted on
anes-thetized cats (Dial, 75 mg/kg) in a sound-proof anechoic chamber.
Figure XVIII-4 shows some of the preliminary results obtained with this preparation.
Cortical responses to shocks (2-volt peak, and 0. 1-msec duration) delivered to the
stimulating electrodes are shown in the upper set of traces.
In this animal the cortical
responses are comparable in magnitude and waveform to the responses obtained with a
0. 1-msec pulse of 0.02 volt delivered to a PDR-10 earphone connected to a tube that is
Before Noise
Clicks
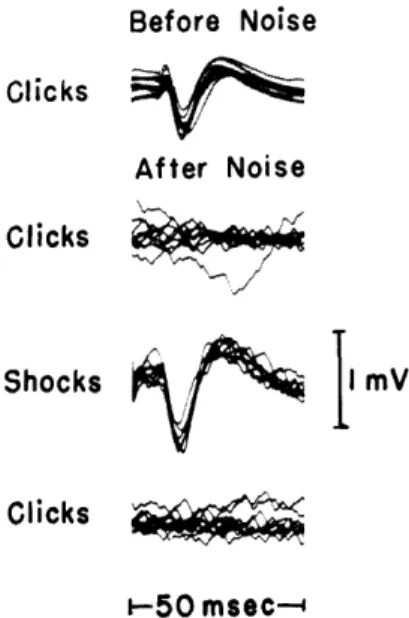
Fig. XVIII-5. After-effect of prolonged high intensity
noise on cortical responses to acoustic
clicks and electric shock.
Responses
After Noise
to 30-db (re threshold of animal's click
response at cortex) clicks before the
noise was turned on are shown in the
upper set of traces.
Responses to
shocks before the noise was delivered
are shown in the upper set of traces
Shocks
I mV
in Fig.XVIII-4. Immediately after
expo-sure to 0-db noise for 6 minutes, the
click, shock, and click responses, taken
in that order, are shown.
The
repeti-Clicks
tion rate for both stimuli was 1/sec.
(Cat-471.)
I-50
(XVIII. COMMUNICATIONS BIOPHYSICS)
Shocks
I mV
Shocks in
Noise
Background
V
'-50
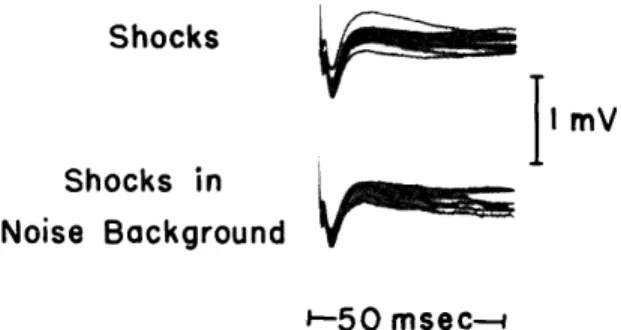
msec--Fig. XVIII-6. Cortical responses to electric shocks applied to the auditory radiations. In the upper traces the stimulus is a 0. 1-msec pulse of 2 volts at a repetition rate of I/sec. In the lower traces a 0-db noise is delivered into the earphone. (Dial anesthesia, Cat-473.)
inserted in the external auditory meatus. In the traces below the upper set of traces in Fig. XVIII-4, broadband acoustic noise is delivered at progressively higher intensities. The cortical responses to electric stimulation are clearly reduced by the addition of the noise. However, they do not disappear completely, even for the highest noise level, as cortical responses to clicks would. This is not surprising, since a shock may stimulate different neurons from those acti-vated by a click. However, sustained intense noise may result in inactivation of the receptors, so that its effect on the neurons may actually be less than the effect for lower noise levels.
The results of another experiment are shown in Fig. XVIII-5. The ear was stim-ulated for approximately 6 minutes with broadband acoustic noise at the highest level,
1 volt rms into a PDR-10 earphone. Immediately after the noise was turned off, clicks were delivered to the ear. No visually detectable cortical responses were observed, as shown in the upper set of traces. The response to electric stimulation of the nerve, as shown in the two middle traces, is comparable to the responses obtained before the presentation of noise (see the upper set of traces in Fig. XVIII-4). The clicks still failed to produce detectable responses in the lower traces, which were taken immediately after the middle traces. This result indicates that this type of after-effect of intense acoustic stimulation involves, mainly, a more peripheral location than the auditory nerve, probably the receptors.
In another experiment bipolar stimulating electrodes were placed in the auditory radiations at a depth of approximately 4-5 mm below the surface of the auditory cortex. Cortical responses to shocks (2-volt peak, and 0. 1-p~sec duration) applied to these elec-trodes are shown in Fig. XVIII-6. These responses change little, if at all, in the pres-ence of acoustic background noise. This demonstrates that the acoustic noise does not result in significant asynchrony of the response to a direct shock at the cortical level.
(XVIII. COMMUNICATIONS BIOPHYSICS)
In other words, the asynchrony contributed by the final stage leading to the cortex seems to be small.
Although these results are preliminary, the combination of electric and acous-tic stimulation seems to be very promising for the study of neurophysiological mechanisms in audition, particularly at the level of the receptors and first-order
neurons.
N. Y. S. Kiang, W. T. Peake
D.
RELATION OF INTRINSIC ALPHA ACTIVITY TO RHYTHMIC ACTIVITY
INDUCED BY PHOTIC STIMULATION IN MANIn the Quarterly Progress Report of January 15, 1957, page 127, results were pre-sented which indicated that trains of waves of alpha frequency may be set up in the electroencephalogram in response to slow rates of photic stimulation in human subjects. The possibility that these waves represent a higher harmonic of the flash rate was excluded by demonstrating that their frequency remained constant in spite of variations in flash rates and by using random flashing, the rate of which varied from 0.5 to
1. 2 per second. The frequency of the rhythmic activity was found to be essentially the same in both procedures.
As a further step in the investigation of these waves, it was essential to exclude the possibility that they are an artefact of sampling; the previously reported results had already indicated that this was unlikely. In the process of obtaining averages (1) of electric signals whose exact statistical properties are unknown, as is the case with EEG potentials, the possibility exists that spurious results will be obtained as an arte-fact of the method. As an example, the averaged response obtained from an EEG record, containing a brief, but relatively high-voltage, train of alpha waves followed by a relatively long period of low-voltage activity, might reflect primarily this high-voltage train of waves that was only coincidentally related in time to the flashes. It would also be possible, theoretically, for the averaging device (if its gain were suffi-ciently high) to indicate a spurious rhythmic response, even though the subject was not being flashed, because of sampling errors that depend on the length of the EEG recording that is being analyzed.
A study of the question of statistical artefact (or error) from sampling was made along three lines. First, recordings were made with the stroboscope covered so that no flash reached the subject's eyes, or with the bulb of the stroboscope disconnected. Second, for recordings made with random flashing, the amplitudes of the averages for small delay settings of the apparatus were compared with the amplitudes at delays that are large compared with the time between successive flashes. Finally, averages for different lengths of recording were compared.
(XVIII. COMMUNICATIONS BIOPHYSICS)
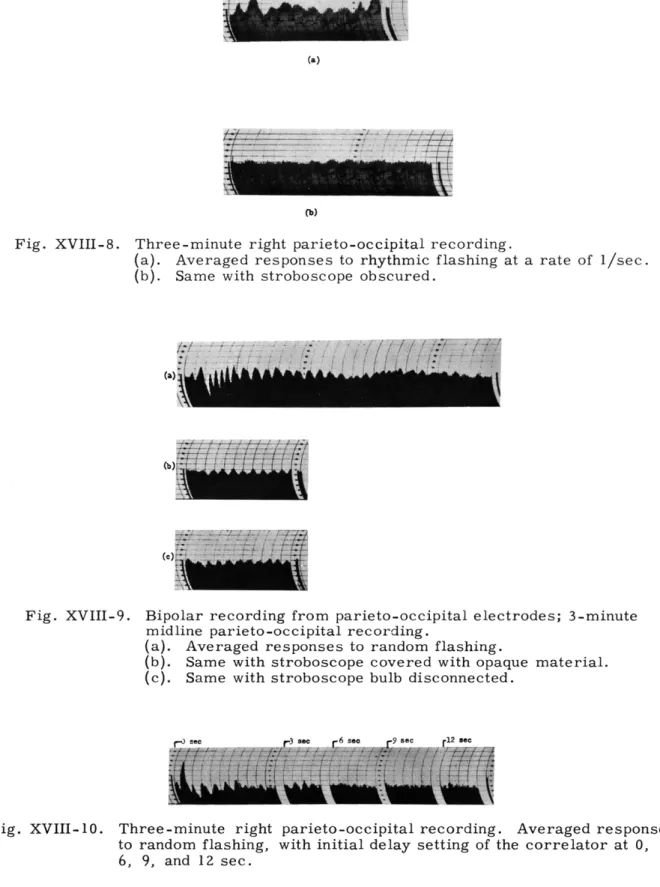
Fig. XVIII-7.
Three-minute right parieto-occipital recording.
(a).
Averaged responses to random flashing.
(b). Same with stroboscope obscured.
a. Tests with the Light Source Obscured
In Fig. XVIII-7 the results of 3-minute recordings for one subject are shown. In
Fig. XVIII-7a the subject was randomly flashed.
In Fig. XVIII-7b the stroboscope
bulb was disconnected, although the stimulus artefact itself was recorded directly
on the magnetic tape from the trigger unit.
Although the amplitude of the response
is considerably larger when the subject is being flashed than the artefactual
response shown in Fig. XVIII-7b, the latter is not a flat base line in this instance.
Figure XVIII-8 shows that the prominent response obtained from another subject is
not present if the stroboscope is covered with opaque material. For these results,
3-minute recordings were used.
b.
Tests with Settings of Delay That Are Large Compared with
Intervals between Flashes
Figure XVIII-9 shows results from 3-minute recordings from another subject.
In
Fig. XVIII-9a the subject was flashed randomly; in Fig. XVIII-9b the stroboscope was
covered with opaque material (so that only the faint click of the stroboscope reached
the subject); and in Fig. XVIII-9c the stroboscope was disconnected.
At delay
settings of the averager which are large compared with the interval between flashes
(Fig. XVIII-9a), there is no rhythmic component that is as prominent as the component
in the first part of the record. If the train of waves were merely a result of an
arte-fact of the method, no difference would be expected between parts of the record.
The
question of the existence of an artefact is not clearly answered by this sample, inasmuch
as a small rhythmic component is evident in the absence of flashing (Fig. XVIII-9b
and 9c), although in neither instance is it as large in amplitude as the component
obtained when the subject was flashed (Fig. XVIII-9a).
Fig. XVIII-8.
Fig. XVIII-9.
Fig. XVIII-10.
Three-minute right parieto-occipital recording.
(a).
Averaged responses to rhythmic flashing at a rate of 1/sec.
(b).
Same with stroboscope obscured.
Bipolar recording from parieto-occipital electrodes; 3-minute midline parieto-occipital recording.
(a). Averaged responses to random flashing.
(b). Same with stroboscope covered with opaque material. (c). Same with stroboscope bulb disconnected.
Three-minute right parieto-occipital recording. Averaged responses
to random flashing, with initial delay setting of the correlator at 0, 3,
6, 9, and 12 sec.
130
__
~hC-
-
--- - II
(XVIII. COMMUNICATIONS BIOPHYSICS)
0~
3 ..
Figures XVIII-10 and XVIII-11 show
the results of large delays for two addi-tional subjects. The successive parts of Fig. XVIII-10 display average evoked Fig. XVIII-11. One-minute right parieto- response with delays of 0, 3, 6, 9, and
occipital recording.Aver- 12 sec, respectively. With a 3-secWith a 3-sec aged responses to random
flashing, with initial delay delay a rhythmic component is still settings at 0 and 3 sec. evident, possibly because with this delay
the degree of randomness in time of successive flashes is not sufficiently great, as is apparently the case with delays of 6, 9, and 12 sec. Figure XVIII-11 shows that there is no rhythmic component in the average, with a delay of 3 sec, in contrast to the prominent rhythmic component immediately after the incidence of the flash (delay of 0 sec). For Fig. XVIII-10, a 3-minute recording was used, for Fig. XVIII-11, a 1-minute recording.
c. Tests with Different Recording Lengths
The effect of the length of recording that is used is shown in Fig. XVIII-12. On the left-hand side a 4-minute recording was used; on the right, only the first minute of this same recording was analyzed, for which the gain of the averaging device was increased by a factor of 4. In the lower part of both sides of Fig. XVIII-12 the strobo-scope was covered with opaque material, so that the subject's eyes were not illuminated by the flash. The effect of using a longer sample of record is clearly apparent. Irregularities that are present in the average for the 1-minute sample are much less apparent in the smoother, more rhythmical response for the 4-minute sample. Similarly,
Four-minute recordings One-minute recordings
Stroboscope uncovered
Stroboscope
covered
Fig. XVIII-12. Averaged responses for 4- and 1-minute left parieto-occipital recordings to random flashing, with and without opaque material covering the stroboscope.
(XVIII.
COMMUNICATIONS BIOPHYSICS)
the base line for the control recording with the stroboscope covered is more nearly flat
for the 4-minute recording than for the 1-minute recording.
Theoretically (2), the contribution to the average of potentials that are time-locked
to the stimulus would be expected to increase in proportion to the total number of
sam-ples averaged, i.e., in proportion to the length of record, whereas the contribution of
unrelated background activity, because of its random nature with respect to the
occur-rence of the stimulus, should increase only as the square root of the number of samples.
The ratio of the average of these two contributions, i.e., the signal-to-noise ratio,
should then increase as the square root of the number of samples, if the response is,
in fact, related to the stimulus and not an artefact of the method. From the points just
made concerning Fig. XVIII-12, it is evident that the signal-to-noise ratio has been
increased in the analysis of the longer recording. Furthermore, it should be noted that,
for both the 1-minute and the 4-minute recordings (but more so for the longer recording),
the train of rhythmic waves persists in time after the flash only out to the incidence of
the next of the randomly occurring flashes (i.e., to approximately 1. 3 sec),
where-upon the train is broken up by this next flash, and so on.
1. Relationship of After-Discharge to the Alpha Rhythm
For a comparison of the after-discharge with the intrinsic rhythmic (alpha) activity,
autocorrelation functions (3) were run for EEG recordings. Illustrative results for one
individual (the same subject as for Fig. XVIII-12) are shown in Fig. XVIII-13. The
predominant (alpha) frequency was determined from recordings made with and without
photic stimulation. As was noted and illustrated in Fig. XVIII-12, no after-discharge
was present in the recording that was made when the light from the stroboscope was
obscured by opaque material.
Strobe uncovered Strobe covered 11. 4/sec No response
Sensory after-discharge
11. 2/sec 11. /sec
Autocorrelation 4 J
Fig. XVIII-13.
Averaged responses and autocorrelations from 4-minute left
parieto-occipital recordings, with and without opaque material
covering stroboscope.
(XVIII. COMMUNICATIONS BIOPHYSICS)
It is emphasized that autocorrelograms reflect the total rhythmic activity (averaged) in the recording, whether it is time-locked to a stimulus or not. From close inspec-tion of the two autocorrelograms, it can be seen that there is no essential difference between them; that is, random photic stimulation had no appreciable effect on the total
rhythmic activity.
Specifically, (a) the frequency of the rhythmic activity in the two instances is essentially the same (11. 1/sec as compared with 11. 2/sec); (b) the average amplitude of the EEG (as indicated by the height of the initial part of the autocorrelations) is essentially the same (37 as compared with 40, in arbitrary units of amplitude); and (c) the general form is the same for both (i.e., the rate of decrement of amplitude from left to right in the autocorrelation function). If the rhythmic after-discharge were
the major contributor to the total rhythmic activity, we should expect the value of the autocorrelation function to be zero after a delay corresponding to the average interval between the (randomly timed) flashes (i.e., of approximately 1.3 sec). That this
situation does, in fact, obtain with the rhythmic after-discharge is evident from the decrease to zero amplitude in the averaged response shown in Fig. XVIII-13 (upper left).
As seen from Fig. XVIII-13, the frequencies of the after-discharge and of the over-all rhythmic activity agree quite closely, in fact, within the limit of the experi-mental error of the methods that were used.
2. Conclusions
These results suggest that for human subjects neuronal structures with similar electrical properties may be involved in both the sensory after-discharge and the intrinsic rhythmic (alpha) activity if, in fact, the same neuronal structures (or over-lapping populations) are not the bases for both phenomena. Further work along this line of investigation will, of course, be required to substantiate such a hypothesis. Results from more subjects, as well as more detailed localization studies of the source of the sensory after-discharge in relation to the source of intrinsic rhythmic activity, will be necessary.
J. S. Barlow
References
1. J. S. Barlow, An electronic method for detecting evoked responses of the brain and for reproducing their average waveforms, EEG Clin. Neurophysiol. 9, 340-343
(1957).
2. Y. W. Lee, Application of statistical methods to communication problems, Tech-nical Report 181, Research Laboratory of Electronics, M.I.T., Sept. 1, 1950. 3. J. S. Barlow and R. M. Brown, An analog correlator system for brain
poten-tials, Technical Report 300, Research Laboratory of Electronics, M.I.T., July 14, 1955.
(XVIII. COMMUNICATIONS BIOPHYSICS)
E. STUDY OF EEG CHARACTERISTICS BY MEANS OF A DIGITAL COMPUTER
An important problem of research in electroencephalography consists in objec-tively specifying measurable characteristics of the electroencephalogram that vary as a function of environmental and physiological conditions. High-speed digital computers offer flexible means of digesting the large quantities of data involved. In this study tape-recorded data were put through an analog-to-digital converter and fed directly into the Lincoln Laboratory TX-0 computer for analysis.
Previous work had suggested that it might be useful to investigate that part of the electrical activity of the brain which consists of bursts of waves at frequencies near the frequency of alpha rhythm. Accordingly, a computer program was written which defines a "rhythmic burst" as a segment of record satisfying criteria with respect to both amplitude and frequency. These criteria are based on thresholds that represent central tendencies of 50, 000 data points in such a way as to be independent of dc level, gain, and frequency.
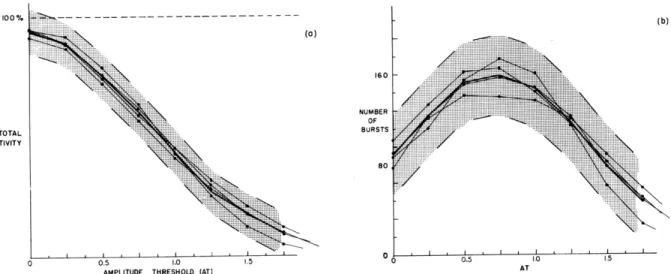
When the percentage of time that is occupied by bursts and the number of bursts per 3-minute intervals are plotted against the amplitude threshold, curves that appear to be relatively stable for an individual under constant conditions are obtained. Figure XVIII-14 shows four such 3-minute runs on subject A.L., together with the mean of the four runs and confidence limits. These limits were computed as three times standard deviation, estimated with the use of small-sample theory. Figure XVIII-15 compares these same confidence limits with two runs on subject H.K. It is clear that there is a good probability that the two curves of subject H.K. do not belong to the population to which the curves of subject A. L. belong.
Preliminary work of this kind indicates that individual subjects can be classified in a number of distinguishable categories, and that some change in physiological conditions (e.g., asleep and awake) produces significant changes in the displays for a given subject. These results are described in a joint Lincoln Laboratory-Research Laboratory of Electronics Technical Report (RLE-337). Further work is in progress to (a) examine more fully individual variability and the influence of environmental and physiological variables, and (b) find out what other significant characteristics can be computed.
B. G. Farley, L. S. Frishkopf, M. Z. Freeman, C. E. Molnar, T. F. Weiss
F. VACUUM SPRING ELECTRODES
The method that has been used for the fixation of EEG electrodes has serious dis-advantages: (a) the lack of uniform electrode contact with the skin; and (b) the length of time required to fix the electrodes on the scalp. For this reason, we decided to
NUMBER OF
BURSTS
0.5 1.0 AMPLITUDE THRESHOLD (AT)
Fig. XVIII-14.
Confidence limits for (a) total activity and (b) number of bursts for subject A. L. Mean of four runs is shown by heavy solid line.160
NUMBER
OF
BURSTS
0.5 1.0 1.5
Fig. XVIII-15.
Curves for subject H.K. superimposed
subject A. L.
on confidence limits of
100% TOTAL ACTIVITY ::::::i::::::::i::::::::: ':ii(XVIII. COMMUNICATIONS BIOPHYSICS)
develop a new system that meets the following requirements:
1. Firm contact between electrode and skin.
2. Contact that is independent of the amount of hair on the scalp.
3. Contact that is independent of head movement.
4. Electrodes that are comfortable and safe even for long periods of time. 5. Lowest possible resistance between electrode and scalp.
With these requirements in mind a new type of electrode, as shown in Fig. XVIII-16, was developed. A metal disc ( is held in place by a device that consists of a hollow piece of rubber
®
in which a rubber tube (0.073 inch I.D.) T is inserted to connect the interior®
with a vacuum pump. The metal disc is fixed to the lower end of aspring
®,
which is connected at its upper end to the interior wall®.
The external electric connection ® is made by a wire that is soldered to the top of the spring.With the spring that we used, the force with which the metal disc presses against the scalp was approximately 70 grams, and the vacuum pressure that was necessary for fixing the electrode to the scalp was approximately 30 mm Hg. The vacuum pressure is regulated by a valve located between the electrode and the pump.
Io Sanborn electrode jelly, when used to improve the electric contact with the scalp, Fig. XVIII-16. Half-section of vacuum
spring electrode. proved useful for reducing vacuum leakage at the electrode.
The measurement of contact resistances between different electrodes attached to the scalp varied, in one subject, from 2.6K to
3K, and from 3K to 5K in another.
In taking electroencephalograms of two subjects, four of the electrodes were used for a period of 15 minutes without any discomfort or irritation to the scalps of the subjects. Placement of the electrodes, once the specific spot on the scalp has been cleaned, can be accomplished almost instantaneously. The electrodes are removed by opening the pressure valve. These electrodes have been used successfully in recent experi-ments; we are, however, working to improve them.
H. C. Ingrao [Note added in proof. A similar method of attaching electrodes to the scalp was recently developed in England by R. Cooper and V. J. Walter (Suction cup electrodes, EEG Clin. Neurophysiol. 1957, 9, 733-734, 1957). This method and the one reported here were developed entirely independently and differ in several details.]