HAL Id: hal-02905979
https://hal.archives-ouvertes.fr/hal-02905979
Submitted on 24 Jul 2020
HAL is a multi-disciplinary open access archive for the deposit and dissemination of sci-entific research documents, whether they are pub-lished or not. The documents may come from teaching and research institutions in France or abroad, or from public or private research centers.
L’archive ouverte pluridisciplinaire HAL, est destinée au dépôt et à la diffusion de documents scientifiques de niveau recherche, publiés ou non, émanant des établissements d’enseignement et de recherche français ou étrangers, des laboratoires publics ou privés.
polyelectrolyte-surfactant complex coacervates
Chloé Seyrig, Gertrude Kignelman, Wim Thielemans, Patrick Le Griel,
Nathan Cowieson, Javier Perez, Niki Baccile
To cite this version:
Chloé Seyrig, Gertrude Kignelman, Wim Thielemans, Patrick Le Griel, Nathan Cowieson, et al.. Stimuli-induced non-equilibrium phase transitions in polyelectrolyte-surfactant complex coacervates. Langmuir, American Chemical Society, In press, �10.1021/acs.langmuir.0c01177�. �hal-02905979�
1
Stimuli-induced non-equilibrium phase transitions in
polyelectrolyte-surfactant complex coacervates
Chloé Seyrig,a Gertrude Kignelman,b Wim Thielemans,b Patrick Le Griel,a Nathan
Cowieson,c Javier Perez,d Niki Baccilea,*
a Sorbonne Université, Centre National de la Recherche Scientifique, Laboratoire de Chimie de
la Matière Condensée de Paris , LCMCP, F-75005 Paris, France
b Sustainable Materials Lab, Department of Chemical Engineering, KU Leuven, campus Kulak
Kortrijk, Etienne Sabbelaan 53, 8500 Kortrijk, Belgium
c Diamond Light Source Ltd, Harwell Science and Innovation Campus, Didcot, OX11 0QX,
U.K.
d SWING, Synchrotron Soleil, BP 48, 91192 Gif-sur-Yvette, France
* Corresponding author: [email protected]
Abstract
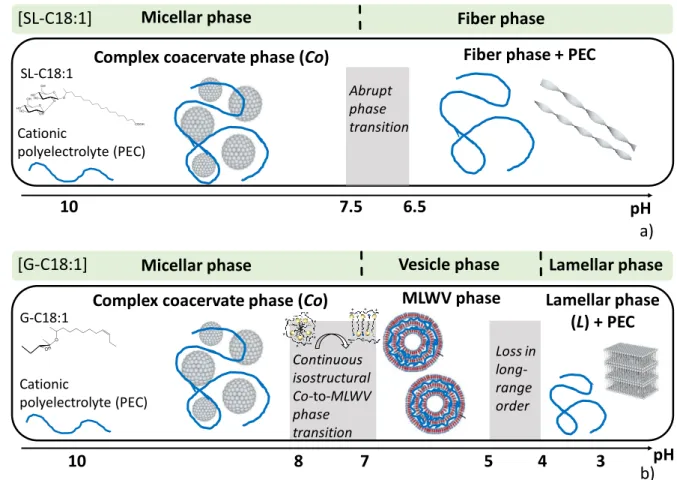
Polyelectrolyte-surfactant complexes (PESCs) are important soft colloids with applications in the field of personal care, cosmetics, pharmaceutics and much more. If their phase diagrams have long been studied under pseudo-equilibrium conditions, and often inside the micellar or vesicular regions, understanding the effect of non-equilibrium conditions, applied at phase boundaries, on the structure of PESCs generates an increasing interest. In this work we cross the micelle-vesicle and micelle-fiber phase boundaries in an isocompositional surfactant-polyelectrolyte aqueous system through a continuous and rapid variation of pH. We employ two microbial glycolipid biosurfactants in the presence of polyamines, both systems being characterized by their responsiveness to pH. We show that complex coacervates (Co) are always formed in the micellar region of both glycolpids’ phase diagram and that their phase behaviour drives the PESCs stability and structure. However, for glycolipid forming single-wall vesicles, we observe an isostructural and isodimensional transition between complex coacervates and a multilamellar walls vesicle (MLWV) phase. For the fiber-forming glycolipid, on the contrary, the complex coacervate disassembles into free polyelecrolyte coexisting with the equilibrium fiber phase. Last but not least, this work also demonstrates the use of microbial glycolipid biosurfactants in the development of sustainable PESCs.
2
Keywords. Polyelectrolyte-Surfactant Complex (PESC), complex coacervates, biosurfactants,
polyelectrolytes, multilamellar walls vesicles
Introduction
Polyelectrolyte-surfactant complexes (PESCs) are a wide class of colloidal systems where surfactant’s self-assembly is combined to the complexation properties of polyelectrolytes.1–7 In the past three decades a large number of works has shown the interest of a wide community of scientists towards these systems for the broad set of applications in food science,8 tissue engineering,9 drug and gene delivery,2,10 underwater adhesives conception,11 structuring agents,12 water treatment,13 but also personal care, cosmetics,14 food, pharmaceutical science15–17 and much other.5–7
The structure of PESCs depend on many parameters, including the intrinsic packing parameter of the surfactant,18 rigidity of the polyelectrolyte, charge density and distribution on both surfactant and polyelectrolyte, ionic strength and pH, just to cite the main ones.3,4,6,7,19,20 Supramicellar aggregates are the most common structures when the surfactant is in the micellar region of its phase diagram. They can be found as polyelectrolyte-coated dense aggregates of spheroidal micelles, which can undergo either a solid-liquid,3,7 or liquid-liquid,3,21 phase separation. In the latter case, they are referred to as complex coacervates.21,22 Supramicellar
colloids can also be found in the form of pearl-necklace or cylindrical morphologies.3,4 The micellar morphology and structure are generally not affected by complexation,3,7,21,23 however,
phase transitions can occur inside the supramicellar complexes due to the local rise in concentration.3,4,7,24 Multilamellar PESCs, of both flat or vesicular morphologies, have also been explored from a fundamental point of view3,5,7,19,25 for their interest in gene delivery
applications, as described for DNA-complexed phospholipids, known as lipoplexes.2,19 Considering the importance of PESCs, the study of their phase diagrams started long ago for a wide range of surfactants complexed by polymers or block copolymers. The complexity of this task is high due to multidimensionality, where effects of ionic strength, cosolvent, cosurfactants and charge could be taken into account.5,6,19,20,24–26 Even if the debate about whether PESCs are at equilibrium or not is still open,3 the study of their phase diagram has long been addressed using a classical thermodynamic approach, involving a systematic parametric study and equilibration times. However, more recent trends consider the importance of crossing phase boundaries under non-equilibrium conditions.3,4 This is motivated by both practical considerations on applications and fundamental questioning.3 If non-equilibrium transitions are a recent concern in PESCs3, they are in fact a major concern in the broader field
3
of macromolecular complexation,27–29 and complex coacervation in particular, as shown by
recent works, concerned by selective control of interactions between polyelectrolytes and lipids.30,31 Molecular dynamics and diffusion-limited processes open again, under a new
perspective, old questions such as possible shift of the surfactant’s phase boundary, promotion of a new surfactant’s phase but also PESC disassembling, promotion of a new PESC phase or coexistence between surfactant and polyelectrolyte phases.
The micelle-to-vesicle transition is particularly interesting because, while being classical in lyotropic surfactant and lipid phases,25,32 it could be exploited in delivery applications under non-equilibrium conditions. Interestingly, non-equilibrium micelle-to-vesicle transitions are well-known,33 however, to the best of our knowledge, they were rarely investigated in PESCs, even under pseudo-equilibrium conditions. The equilibrium phase diagram of ethoxy fatty acids in aqueous solutions displayed a pH-dependent micelle-to-vesicle transition,34 but the same transition was not observed in the presence of polyelectrolytes,35 thus confirming the yet unpredictable effect of polyelectrolytes on surfactants’ phase diagram. This is particularly true in the case of lipid bilayer membranes, of which the physical properties, including the local composition, defects, segregation and bending energy depend on the polyion.25,36–39 Even if the complexity of the interactions between polyelectrolytes and (soft) interfaces has been addressed for decades,39–41 predicting the equilibrium curvature in PESCs3
is still a challenge,42,43 and this is a matter of utmost importance for more advanced applications of PESCs.30,31
Fibrillation of low-molecular weight compounds is also another important field of research, from both applicative (hydrogelation)44 and fundamental (non-equilibrium phase transitions)45 perspectives. Development of PESCs from low-molecular weight gelators is still
a virgin field of research and questioning the interactions between polyelectrolytes and self-assembled fibers has only started with recent works.46
In a series of recent communications, many authors have addressed the solution self-assembly of microbial glycolipid biosurfactants.47–49 These molecules have a multiple interest in the field of PESCs: they are biobased and biodegradable amphiphiles50 with a rich phase diagram and stimuli responsiveness. For these reasons they are highly prompt for the development of biocompatible PESCs but also for the study of non-equilibrium phase transitions in complex systems, both aspects generating an increasing interest in the community.3,7 In particular, we have shown that acidic C18:1 sophorolipids, which form a stable micellar phase in a broad pH range,49,51,52 also form pH-responsive complex coacervates in the presence of both synthetic and natural polyamines.53 Interestingly, sophorolipid
4
analogues have a richer, pH-stimulated, phase diagram including to-vesicle, micelle-to-fiber and micelle-to-lamellar transitions.49,52,54
In this work, we explore the stability of a polyelectrolyte-surfactant complex coacervate at two distinct iso-compositional phase boundaries, micelle-vesicle and micelle-fiber, where phase transition is triggered by pH. To do so, we use two microbial glycolipid biosurfactants in the presence of three cationic polyelectrolytes (PEC). Turbidimetric analysis, cryogenic transmission electron microscopy (cryo-TEM) and pH-resolved in situ small angle X-ray scattering (SAXS) using synchrotron radiation experiments show that complex coacervates are only stable in the micellar region of both glycolipids’ phase diagram. However, if the lipid undergoes a micelle-to-vesicle transition, we observe a complex coacervate (Co) to multilamellar walls vesicles (MLWV) (Co-to-MLWV) phase transition. MLWV are composed of PEC entrapped between single lipid layers, of which the mutual interactions are quantified by nuclear magnetic resonance (NMR) and isothermal titration calorimetry (ITC). If the lipid undergoes a micelle-to-fiber transition, on the contrary, the coacervate disassembles and the glycolipid’s fiber phase coexists with the polyelectrolyte, with no apparent interactions, against the literature’s expectations.46 Finally, this work demonstrates the use of biobased surfactants
for the development of sustainable PESCs.
Experimental section
Chemicals
Glycolipids G-C18:1 (Mw= 460 g.mol-1), made of a single β-D-glucose hydrophilic
headgroup and a C18:1 fatty acid tail (monounsaturation in position 9,10), and SL-C18:0 (Mw=
624 g.mol-1), composed of a sophorose headgroup and a stearic acid derivative. From alkaline
to acidic pH, the former undergoes a micelle-to-vesicle phase transition49 while the latter undergoes a micelle-to-fiber phase transition.55 The syntheses of sophorolipid SL-C18:0 and glucolipid G-C18:1 are respectively described in Ref 55 and 54, where the typical 1H NMR spectra and HPLC chromatograms are also given. The compounds used in this work have a molecular purity of more than 95%.
The cationic polyelectrolytes (PEC) used in this work are chitosan, obtained from the deacetylation of chitin from crusteans’ shells, poly-L-lysine, widely used in biomedical field, and polyethylenimine. Chitosan oligosaccharide lactate (CHL) (Mw ≈ 5 kDa, pKa ~6.5)56 with a
deacetylation degree >90%, poly-L-lysine (PLL) hydrobromide (Mw≈1-5 kDa, pKa ~10-10.5)57
5
Sigma-Aldrich. All other chemicals are of reagent grade and are used without further purification.
Preparation of stock solutions
SL-C18:0 (C= 5 mg.mL-1), G-C18:1 (C= 5 mg.mL-1, C= 20 mg.mL-1), CHL (C= 2 mg.mL-1), PLL (C= 5 mg.mL-1, C= 20 mg.mL-1), and PEI (C= 5 mg.mL-1) stock solutions (V= 10 mL) are prepared by dispersing the appropriate amount of each compound in the corresponding amount of Milli-Q-grade water. The solutions are stirred at room temperature (T= 23 ± 2 °C) and the final pH is increased to 11 by adding a few μL of NaOH (C= 0.5 M or
C= 1 M).
Preparation of samples
Samples are prepared at room temperature (T= 23 ± 2°C) by mixing appropriate volume ratios of the lipid (SL-C18:0 or G-C18:1) stock solutions at pH 11 and cationic polyelectrolyte stock solutions (PEC), as defined in Table 1. The final total volume is generally set to V= 1 mL or V= 2 mL, the solution pH is about 11 and the final concentrations are given in Table 1. The pH of the mixed lipid-PEC solution is eventually is decreased by the addition of 1-10 µL of a HCl solution at C= 0.5 M or C= 1 M. pH has been changed by hand and by mean of a push-syringe device. The rate at which pH is changed is generally not controlled although it is in the order of several µL.min-1. Differently than in other systems,34,59 we did not observe unexpected
effects on the PESC structure to justify a tight control over the pH change rate.
Table 1 – Relative volumes of lipid and cationic polyelectrolyte (PEC) solutions to mix to obtain given concentrations
Volume Concentration
Lipid stock solution / mL
PEC stock
solution / mL Water / mL CLipid / mg
.mL-1 C PEC / mg.mL-1 0.5 0.5 0 2.5 or 10 2.5 or 10 0.25 0.25 2.5 1.25 0.125 0.375 2.5 0.625
6
The influence of pH and concentration of PEC on the formation of coacervate droplets is investigated by measuring the absorbance at a wavelength of λ= 450 nm. Data are recorded at room temperature (T= 23 ± 2 °C) using a UV/Vis spectrophotometer (UVIKON XL, BioTek). Preparation of the samples for these experiments is the same as described above, however, the final concentration of the lipid is systematically set at C= 2.5 mg.mL-1, while the final concentrations of the PEC range between 0.25 < C / mg.mL-1 < 1 for CHL and 0.63 < C / mg.mL
-1 < 2.5 for PLL and PEI. The titrated volume is systematically V= 1 mL. The pH of each
lipid-PEC mixed solution is decreased progressively by the manual addition of small amounts (V <10 μL) of HCl= 0.1 M. The turbidity curves are recorded after each pH variation. Each solution is stirred before analysis, which is however performed at rest under static conditions, thus favoring sedimentation during the measurement. The turbidity curve of control lipid and PEC solutions is also measured as a function of pH.
Turbidimetric titration using Light Scattering (LS) and ζ-potential
To avoid sedimentation, we have repeated the turbidimetric titration experiment on selected samples using the automatic titration unit MPT-2 of a Malvern Zetasizer Nano ZS90 (Malvern Instruments Ltd, Worcestershire, UK) instrument, equipped with a 4 mW He-Ne laser at a wavelength of λ= 633 nm, measuring angle, θ = 90°, temperature, T= 25°C, and the signal is never attenuated throughout the entire experiment. The sample solution (V= 7 mL) is contained in an external beaker and pumped with a peristaltic pump through the ζ-potential cuvette cell located in the instrument for analysis. pH is adjusted in the beaker by adding aliquots of V= 6 μL of a HCl solution at C= 0.5 M and controlled by the MPT-2 Zetasizer software. The beaker undergoes gentle stirring to avoid the formation of air bubbles in the flow-through tubing system and, consequently, in the ζ-potential cuvette. Avoiding air bubbles in the cuvette is crucial and accurately inspected throughout the experiment. Light scattering and ζ-potential are simultaneously recorded between each pH variation while the sample solution is continuously pumped through the cuvette. The latter action guarantees that sedimentation occurs neither in the cuvette nor in the external beaker.
pH-resolved in situ Small angle X-ray scattering (SAXS)
In situ SAXS experiments during pH variation are performed at room temperature on
two different beamlines. The B21 beamline at Diamond Light Source Synchrotron (Harwell, England) is employed using an energy of E= 13.1 keV and a fixed sample-to-detector (Eiger X 4M) distance of 2.69 m. The Swing beamline at Soleil Synchrotron (Saint-Aubin, France) is
7
employed using an energy of E= 12 keV and a fixed sample-to-detector (Eiger X 4M) distance of 1.995 m. For all experiments: the q-range is calibrated to be contained between ~5.10-3 < q/Å-1 < ~4.5.10-1; raw data collected on the 2D detector are integrated azimuthally using the
in-house software provided at the beamline and so to obtain the typical scattered intensity I(q) profile, with q being the wavevector (𝑞 = 4𝜋 sin 𝜃 𝜆⁄ , where 2θ is the scattering angle and λ is the wavelength). Defective pixels and beam stop shadow are systematically masked before azimuthal integration. Absolute intensity units are determined by measuring the scattering signal of water (Iq=0= 0.0163 cm-1). SAXS profiles are treated with SasView software, version
3.1.2, available at the developer’s website (sasview.org).
The same sample experimental setup is employed on both beamlines: the sample solution (V= 1 mL) with the lipid and PEC at their final concentration and pH ~11 is contained in an external beaker under stirring at room temperature (T= 23 ± 2°C). The solution is continuously flushed through a 1 mm glass capillary using an external peristaltic pump. The pH of the solution in the beaker is changed using an interfaced push syringe, injecting microliter amounts of a 0.5 M HCl solution. pH is measured using a micro electrode (Mettler-Toledo) and the value of pH is monitored live and manually recorded from the control room via a network camera pointing at the pH-meter located next to the beaker in the experimental hutch. Considering the fast pH change kinetics, the error on the pH value is ± 0.2.
Cryogenic transmission electron microscopy (cryo-TEM)
Cryo-TEM experiments are carried out on an FEI Tecnai 120 twin microscope operated at 120 kV and equipped with a Gatan Orius CCD numeric camera. The sample holder is a Gatan Cryoholder (Gatan 626DH, Gatan). Digital Micrograph software is used for image acquisition. Cryofixation is done using a homemade cryofixation device. The solutions are deposited on a glow-discharged holet carbon coated TEM copper grid (Quantifoil R2/2, Germany). Excess solution is removed and the grid is immediately plunged into liquid ethane at -180°C before transferring them into liquid nitrogen. All grids are kept at liquid nitrogen temperature throughout all experimentation. Cryo-TEM images have been treated and analyzed using Fiji software, available free of charge at the developer’s website.60
1H solution Nuclear Magnetic Resonance (NMR)
1H solution NMR experiments are performed on a Bruker Avance III 300 spectrometer
8
acquisition time of 2.73 s and a receiver gain of 322. We have employed a 5 mm NMR tube containing 500 μL of solution. The latter is obtained upon solubilization of a dried pellet in MeOD, also containing 3-(Trimethylsilyl) propionic-2,2,3,3-d4 acid sodium salt (TMSP-d4) at
1 mg.mL-1 (5.8 mM). The pellet is obtained by centrifugation of a solution at final pH of 5 containing the lipid and the polyelectrolyte and prepared according to the method described in the “Preparation of samples” paragraph in this section. After centrifugation, the supernatant is removed and the pellet is dried in an oven at 40°C for 2 days. These conditions have been kept constant throughout all experiments.
Isothermal Titration Calorimetry (ITC)
ITC experiments were performed using a TAM III isothermal calorimeter from TA Instruments. All the solutions (buffer pH 5.8, PLL 2 mM, G-C18:1 2 mM, and G-C18:1 4 mM) were degassed by 15 min sonication under vacuum. ITC experiments employ phosphate buffer solutions (NaH2PO4/Na2HPO4,10 mM) at pH 5.8. The titration experiments between PLL and
G-C18:1 were performed with PLL 2 mM in the calorimetric cell and G-C18:1 (2 or 4 mM) solution in the syringe. Preliminary experiments (not shown) showed that high stirring rates (120 rpm) result in an unstable stable calorimetric trace most likely due to the foaming of the G-C18:1 despite the degassing step. This was also confirmed by visual inspection of the retracted measurement cell. For this reason, the experiments are conducted at a lower stirring speed of 30 rpm and with the G-C18:1 solution in the syringe. Prior to the start of the titrations, the system was equilibrated at 25℃ until baseline variation was less than 50 nW/h. After calibration (dynamic and gain), 20 injections of 10µL each of G-C18:1 (2 or 4 mM) were successively added at 20 min intervals into the cell containing 0.8 mL of PLL 2 mM. A blank titration experiment to estimate the heat of dilution was also performed under the same conditions by injecting the buffer solution into PLL 2 mM. The calorimetric results were corrected for the heat of dilution by subtracting the blank experiment from the actual experiments. The data was fitted with a multi site model using NanoAnalyse data analysis software (TA Instruments) in order to determine the thermodynamic as well as the reaction parameters of the interaction between PLL and G-C18:1. From the enthalpy (∆𝐻) and the binding constant (𝐾𝑎) of the reaction, the entropy (∆𝑆) and the Gibbs free energy (∆𝐺) of reaction were calculated using the following equation:
9
Results
Deacetylated acidic sophorolipid SL-C18:0 (saturated) and glucolipid G-C18:1 (monounsaturated) are two microbial glycolipid biosurfactants used in this work and both containing a free carboxylic acid chemical function (Figure 1). Alkaline solutions of SL-C18:0 and G-C18:1 at room temperature and concentrations below 10 wt% are characterized by a major micellar phase. At pH< 7.4, SL-C18:0 self-assembles into crystalline twisted ribbons, while at pH< 6.2 G-C18:1 self-assembles into vesicles.49,54,55
Figure 1 – pH-dependent phase and (negative) charge diagram for SL-C18:0 and G-C18:1 microbial glycolipids biosurfactants at C< 10 wt% and room temperature. The (positive) charge of PLL polyelectrolyte is also indicated as a function of pH
Figure 1 summarizes the pH-dependent phase and charge diagram of SL-C18:0 and G-C18:1 glycolipids, which are negatively charged above pH ~4.5, due to their carboxylate function. PLL polyelectrolyte is on the contrary positively charged below pH 10, water-soluble and it adopts a random coil conformation. The other PEC employed in this work, CHL and PEI, have a similar behavior, except for their pKa values, which are respectively 6.5 and 8. The
charge complementarity between the glycolipids and PEC in a given pH range leads to an expected electrostatic interaction, and which was shown to form glycolipid-PEC complex coacervates, when acidic deacetylated monounsaturated sophorolipids (SL-C18:1) were employed.53 To explore whether SL-C18:0 and G-C18:1 glycolipids form complex coacervates, and whether their pH-induced phase transition has a potential impact on the coacervate structure, we perform a series of pH-stimulated experiments on mixtures of each glycolipid and PEC. The main body of this work summarizes the results obtained with PLL, while the data
11
9 7 5 3 pH
-+ -+ -+ -+ -+ -+ -+ -+ -+
PLL
SL-C18:0
G-C18:1
10
collected on CHL and PEI are only briefly discussed and presented as supporting information, as they support the main conclusions obtained with PLL.
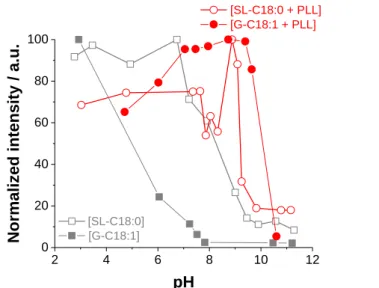
Figure 2 – Room temperature turbidimetric analysis performed by UV-Vis spectroscopy of SL-C18:0 and G-C18:1 glycolipid solutions with and without PLL as a function of pH. The typical sample preparation is described in the materials and method section. The final lipid and PEC concentrations are CG-C18:1= C
SL-C18:0= 2.5 mg.mL-1, CPLL= 1.25 mg.mL-1. pH is decreased from 11 to 3.
Figure 2 presents the pH-resolved turbidimetric analysis on control lipid ([SL-C18:0] and [G-C18:1]) solutions (grey symbols) and mixtures of lipids with PLL (red symbols). As a general result, control solutions display poor scattering (micellar phase) above pH ~8 and ~9 for, respectively, G-C18:1 and SL-C18:0; on the contrary, scattering is maximized below pH ~6 and ~7 for, respectively, G-C18:1 and SL-C18:0. These results are in agreement with their respective micelle-to-vesicle49 and micelle-to-fiber55 phase transitions. One must notice that scattering of SL-C18:0 fibers below pH 7 is weaker than what it should be55 and this is due to sedimentation issues during the experiment. A specific comment on this aspect is associated to Figure S 1 in the Supporting Information and where pH-resolved experiments are performed in
situ in the light scattering apparatus. Finally, scattering of PLL alone is negligible on the entire
pH range and for this reason it is not displayed in Figure 2. Mixtures of SL-C18:0, or G-C18:1, and PLL highlight a region of strong scattering (red symbols) already at 9 < pH < 10, that is at least two to three orders of pH higher than the controls, and indicating that both glycolipids preferentially interact with PLL under these pH conditions, according to the likely hypothesis of charge matching schematized in Figure 1. The data in Figure 2, reported for final concentrations of lipid and PLL of, respectively, 2.5 mg.mL-1 and 1.25 mg.mL-1, are quite robust and reproducible for a broader range of lipid-to-PLL mass ratios, as shown in Figure S 2.
2 4 6 8 10 12 0 20 40 60 80 100 [SL-C18:0] [G-C18:1] [SL-C18:0 + PLL] [G-C18:1 + PLL] Normaliz ed inte nsity / a .u. pH f
11
Similar results were also reported for SL-C18:1 sophorolipids and PEC soutions53 and for a
broad range of micelle-polyelectrolyte complex coacervates.21 pH-resolved in situ ζ-potential
measurements are employed to show mutual interactions by charge-matching (Figure S 3). The lipid control solutions display the presence of negatively-charged colloids between pH 10 and 4, while lipid and PLL mixed solutions show an overall charge neutralization process occurring since pH 10, indirectly demonstrating the interaction between the lipid and polyelectrolyte, supported by both NMR and ITC presented later in the manuscript.
Figure 3 – a) SAXS profile recorded for a co-assembled mixture of [SL-C18:0 + PLL] (black curve) at pH 8.68. Grey curve: arithmetical summation of the SAXS profiles each recorded individually on the control solutions of [SL-C18:0] and [PLL] at pH 8.68. An artificial offset has been added for sake of clarity. Concentrations: CSL-C18:0= CPLL= 2.5 mg.mL-1. b) Cryo-TEM image of the co-assembled [SL-C18:0 + PLL]
solution at pH 7.40. Concentrations: CSL-C18:0= 2.5 mg.mL-1, CPLL= 1.25 mg.mL-1. Panels 1 and 2 identify
regions where Fourier Transform (F.T.) is performed. F.T. images are indicated by the arrows on the
right-pH 7.40
1
2
pH 9.16
[SL-C18:0 + PLL]
[G-C18:1 + PLL]
F.T. F.T. sc sc sc1
2
80 4030 Å d-spacing3
3
80 4030 Å d-spacing 40 Å 35 Å 80 Å 0.01 0.1 10-3 10-2 10-1 100 101 102 103 [SL-C18:0] + [PLL] I / c m -1 q / Å-1 [SL-C18:0 + PLL] pH 8.68 0.01 0.1 10-2 10-1 100 101 102 103 [G-C18:1] + [PLL] [G-C18:1 + PLL] I / cm -1 q / Å-1 pH 8.0b)
d)
c)
a)
12
hand side of each cryo-TEM image. c) SAXS profile recorded for a co-assembled mixture of [G-C18:1 + PLL] (black curve) at pH 8.0. Grey curve: arithmetical summation of the SAXS profiles each recorded individually on the control solutions of [G-C18:1] and [PLL] at pH 8.0. An artificial offset has been added for sake of clarity. Concentrations: CG-C18:1= CPLL= 10 mg.mL-1. d) Cryo-TEM image of the co-assembled
[G-C18:1 + PLL] solution at pH 9.16. Concentrations: CG-C18:1= 2.5 mg.mL-1 and CPLL= 1.25 mg.mL-1.The
F.T. of panel 3 is shown on the right-hand side. Images have been analyzed using Fiji software.60
A combination of SAXS and cryo-TEM experiments (Figure 3 and Figure 4) is used to study the structure of SL-C18:0 and G-C18:1 with PLL in the regions of strong light scattering and below pH 7 (Figure 2). The SAXS profiles show the signals recorded at basic (Figure 3a,c) and acidic (Figure 4a,c) pH, where black curves labelled [SL-C18:0 + PLL] and [G-C18:1 + PLL] correspond to co-assembled lipid:PLL PESCs solutions. Grey curves labelled [SL-C18:0] + [PLL] and [G-C18:1] + [PLL] correspond to the arithmetic sum of the SAXS profiles recorded on the individual lipid and PLL controls solutions separately. Figure S 4 illustrates the SAXS profiles of the individual SL-C18:0 (blue symbols) and PLL (red symbols) control solutions recorded at pH 5.50 and 8.68 as well as their arithmetic sum (grey symbols). The difference in concentration between the G-C18:1 system at pH 8.0 (C= 10 mg.mL-1) and the rest (C= 2.5
mg.mL-1) is simply a matter of signal-to-noise ratio. The corresponding SAXS profile collected
at CG-C18:1= CPLL= 2.5 mg.mL-1 and pH 8.0 is given in Figure S 5 and it indeed shows a similar
profile but with a poorer signal-to-noise, probably due to a combination of poor contrast and low concentration.
Study of the complex coacervate (Co) phase
In the micellar region of the phase diagram (pH> 8), both glycolipids in their mixture with PLL have SAXS profiles characterized by a strong low-q scattering and a broad peak (black curves in Figure 3a,c). The peak is centered at q= 0.078 Å-1 (d= 80.5 Å) while a second peak can be observed at q= 0.15 Å-1 (d= 41.8 Å) for SL-C18:0 and at q= 0.174 Å-1 (d= 36.1 Å) for G-C18:1. Comparison between the co-assembled lipid and PLL solution (black curves) with the corresponding controls (grey curves in Figure 3a,c above pH 8) at basic pH shows that, if low-q scattering is generally comparable, the correlation peak is unique only in the co-assembled solutions and never observed for the pure glycolipids. The presence of a correlation peak is actually general and not only observed with PLL. For instance, SL-C18:0 (at basic pH) systematically shows two broad correlation peaks centered at q= 0.078 ± 0.002 Å-1 and at q= 0.15 ± 0.10 Å-1 when it is co-assembled with PLL, PEI or CHL (Figure S 6a). These peaks, common in scattering experiments of micelle-polyelectrolyte complex coacervates,21 are
13
generally associated to the structure of the co-assembled lipid with PEC. To better understand the origin of the peak at basic pH in the SAXS experiments, we study the structure of [SL-C18:0 + PLL] and [G-C18:1 + PLL] using cryo-TEM.
The typical cryo-TEM images of [SL-C18:0 + PLL] and [G-C18:1 + PLL] at basic pH are shown in Figure 3, while additional images are given in Figure S 7. All samples, irrespective of the pH value, are characterized of large spherical colloidal (sc) structures, of diameter larger than 1000 Å, embedded in a medium, which often displays a fingerprint-like texture (panels 2 and 3 in Figure 3, Figure S 7a,d,e). Regions of much smoother, untextured, background are however observed, as well (Figure S 7b,c). sc display as dense, untextured, more contrasted, objects. One can occasionally observe, mainly in [SL-C18:0 + PLL] systems, a third type of component, constituted of agglomerated, highly contrasted, particles of typical primary size contained between 20 nm and 50 nm (panel 1 in Figure 3, Figure S 7b). Both aggregated particles and sc of similar texture, size, morphology and contrast were largely documented using cryo-TEM by us53 and by others23,61,62 in polyelectrolyte-surfactant complex coacervates. The entire set of cryo-TEM images that we have recorded on glycolipids SL-C18:0 and G-C18:1 co-assembled with PLL or PEI at basic pH show the same type of structures as presented in Figure 3 and Figure S 7. From a macroscopic point of view, all samples form a stable suspension of liquid spherical droplets similarly to our previous results,53 rather than a
solid precipitate. The combination of these pieces of evidence3 indicate that complex coacervation systematically occurs in the micellar region of the glycolipids phase diagram. Concerning CHL, we cannot draw a clear-cut conclusion due to the fact that this compound precipitates above pH 763 and its interactions with glycolipids in the alkaline region are at the moment unclear. The SAXS data corresponding to [SL-C18:0 + CHL] shown in Figure S 6 confirm this assumption: the typical correlation peaks, clearly observed in the PLL and PEI systems, can be hardly identified. However, complementary data recorded on the [G-C18:1 + CHL] system, and presented elsewhere,64 still suggest the formation of complex coacervates.
Agglomerated, highly contrasted, particles (e.g., panel 1 in Figure 3) are generally attributed to dehydrated complex coacervates driven by microscopic electroneutrality23,53 on the coacervation plateau, while sc structures surrounded by a textured backround (e. g., panel 2 and 3 in Figure 3) are attributed to sections of 3D hydrated complex coacervates structures at the point of macroscopic coacervation.62 Dense structures are always superimposed to a clear background, as described by Dubin et al.,23 while the fingerprint-like background is systematically associated to sc structures, independently of the glycolipid employed. This is nicely shown for [SL-C18:0 + PLL] in Figure 3b, where a clear-cut frontier delimitates dense
14
coacervates on top from sc on the bottom, the former being embedded in a smooth background while the latter embedded in a fingerprint-like background. In line with Dubin et al.,62 we
speculate that the composition of the fingerprint-like background is rich in glycolipid, while sc are rather rich in PEC. Probably due to the kinetic control of coacervation process, we are unable to establish the physicochemical conditions that could favor either dense aggregates or
sc regions, as we observe both of them irrespectively of the pH value (Figure S 7a-c), or even
coexisting at the same pH (Figure 3b). Nonetheless, we propose a structural interpretation through a crossed SAXS-cryo-TEM analysis of both [SL-C18:0 + PLL] and [G-C18:1 + PLL] systems.
The Fourier Transform (F.T.) of the fingerprint-like region in the [SL-C18:0 + PLL] system (panel 2 in Figure 3b) provides a broad ring corresponding to d-spacing between 80 Å and 40 Å, while the dense coacervate region, panel 1 in Figure 3b, provides an additional ring of d-spacing between 30 Å and 40 Å. Comparison between the d-spacing values estimated from cryo-TEM with d-spacing obtained by SAXS (d= 80.5 Å and d= 41.8 Å, Figure 3a) confirms the hypothesis according to which the correlation peak in SAXS is reasonably associated to the structure of complex coacervates. Interestingly, the q-values are in a 1:2 ratio, generally found in lamellar stacking but excluded in this system by cryo-TEM arguments. Correlation peaks with q-values in 1:2 ratio were observed before in β-lactoglobulin(βLgA)-pectin complex coacervates65 and were attributed to the presence of βLgA clusters coexisting with ordered protein-to-protein correlations observed inside the clusters. In the present case, the d-spacing at
d= 41.8 Å can be reasonably attributed to the dense aggregates (panel 1 in Figure 3b), most
likely composed of tightly packed SL-C18:0 micelles embedded in the polyelectrolyte matrix adopting a globular conformation (Figure 3b).23 This hypothesis is also in agreement with the
typical cross-sectional diameter of SL-C18:0 micelles (~35 Å)49 and with the previously-proposed colloid cluster model in complex coacervates.21 However, the colloid cluster model unfortunately explains neither larger d-spacing values nor the fingerprint-like textured background. The only way to explain a d-spacing value corresponding to approximately twice the size of a SL-C18:0 molecule is by considering a “pearl-necklace”-like structure, proposed long time ago for polyelectrolyte-micelles complexes,4,7,35,66 and adapted to the present (Figure
3b) to account for the larger experimental d-spacing.
The Fourier Transform (F.T.) of the fingerprint-like region, panel 3 in Figure 3d, in the [G-C18:1 + PLL] system, also shows a broad ring with d-spacing values contained between 40 Å and 60 Å, a range which is overestimated by at least a factor 1.5 with respect to the d-spacing value measured by SAXS (d= 36.1 Å). Despite such a discrepancy, the lack of other organized
15
structures in cryo-TEM and the lack of other correlation peaks in SAXS suggest that the correlation peak should be attributed to the textured background identified in panel 3 in Figure 3d. However, a spontaneous question arises: why is the d-spacing value associated to the textured region in the [G-C18:1 + PLL] system correlated to the size of a single G-C18:1 molecule49,54 and not to twice its size, as found for [SL-C18:0 + PLL]? The only reasonable answer that we can propose is the possibly different packing of G-C18:1 around the polyelectrolyte: instead of the expected micellar packing, G-C18:1 could form interdigitated wormlike micelles stabilized by the polyelectrolyte (scheme in Figure 3d), as also discussed for other polyelectrolyte-micelle complexes.3,4,20,67 This hypothesis is not outrageous because wormlike micelles are experimentally found as a transitory phase during the micelle-to-vesicle transition in the PEC-free G-C18:1 aqueous system.49 Analysis of the slope in, or even modelling of, SAXS profiles could certainly help to corroborate the hypotheses of “pearl-necklace” (Figure 3b) and wormlike (Figure 3d) models, as proposed by other authors.35,68
However, any tentative analysis of our SAXS data in the log-log scale provide a dependence of the intensity on q around -3, which is typically found for fractal structures but which, unfortunately, does not bring any additional structural information on the present system. Cryo-TEM experiments show a multiphasic medium with coexistence of more than one structural intermediate, thus making a clear-cut interpretation of the SAXS profile very hard, if not impossible.
In the rest of the manuscript, the term Co phase will broadly refer to the complex medium in the basic pH region composed of aggregated structures (panel 1 in Figure 3), PEC-rich sc (Figure 3) and glycolipid-PEC-rich textured (panel 2,3 in Figure 3) regions.
0.01 0.1 10-4 10-3 10-2 10-1 100 101 [SL-C18:0] + [PLL] I / c m -1 q / Å-1 [SL-C18:0+PLL] pH 5.3 0.01 0.1 10-4 10-3 10-2 10-1 100 101 [G-C18:1] + [PLL] [G-C18:1 + PLL] I / cm -1 q / Å-1 pH 5.5 a) b) c) pH 5.56 [SL-C18:0 + PLL] pH 4.70 0.1 0.2 0.3 0.4 q / Å-1 d) q1 q 2 e) d= 36 Å [G-C18:1 + PLL] d1= 37.4 Å F.T.
16
Figure 4 – a) SAXS profile recorded for a co-assembled mixture of [SL-C18:0 + PLL] at pH 5.30. Grey curve: arithmetical summation of the SAXS profiles each recorded individually on the control solutions of [SL-C18:0] and [PLL] at pH 5.30. An artificial offset has been added for sake of clarity. b) Cryo-TEM image of the co-assembled [SL-C18:0 + PLL] solution at pH 5.56. Concentrations in a-b) are CSL-C18:0= CPLL= 2.5
mg.mL-1. c) SAXS profile recorded for a co-assembled mixture of [G-C18:1 + PLL] (black curves) at pH
5.50. Grey curve: arithmetical summation of the SAXS profiles each recorded individually on the control solutions of [G-C18:1] and [PLL] at pH 5.50. An artificial offset has been added for sake of clarity. d) Highlighted high-q region of C18:1 + PLL] at pH= 5.50. e) Cryo-TEM image of the co-assembled [G-C18:1 + PLL] solution at pH 4.70. Concentrations in c-e) are CG-C18:1= CPLL= 2.5 mg.mL-1. Images has been
analyzed using Fiji software.60
In situ study of the lipid-PLL system below neutral pH
pH-resolved in situ SAXS is employed to study the lipid-PLL phase behavior below neutral pH. Experiments performed at acidic pH are shown in Figure 4a,b (SAXS: black curve, pH 5.30; cryo-TEM: pH 5.56) for the [SL-C18:0 + PLL] mixture and in Figure 4c-e (SAXS: black curve, pH 5.50; cryo-TEM: pH 4.70) for the [G-C18:1 + PLL] mixture. In the SL-C18:0 system, SAXS shows a strong low-q scattering and a diffraction peak at q= 0.24 Å-1. The same exact profile is observed for the [SL-C18:0] + [PLL] control signal (grey curve, pH 5.30, Figure 4a) and reported for a typical aqueous solution of SL-C18:0 twisted ribbons, the peak being attributed to the repeating inter-lipid layer distance within each ribbon.55 Twisted ribbons of similar size (cross section ~150 Å) and morphology compared to the previous findings of pure SL-C18:0 system at acidic pH are actually observed in the corresponding cryo-TEM images (Figure 4b). Knowing that SL-C18:0 assembles into a fibrillar phase at acidic pH, one can reasonably suppose that SL-C18:0 does not interact with PLL under these conditions and the micelle-to-fiber self-assembly process (Figure 1) occurs independently whether SL-C18:0 is in a free micellar49,55 or in PESCs complex coacervates. At the moment, we do not have evidence, both by SAXS and cryo-TEM, later on confirmed by NMR arguments, that SL-C18:0 fibers interact in any way with PEC, differently than what was reported for the fibrillation of bile salts complexed with block copolymers.46 We could explain this evidence by the fact that self-assembled fibers are only composed of the COOH form of SL-C18:0 and they are thus neutral objects, which do not interact with PEC. This statement seems to be in contrast with ζ-potential experiments performed on the SL-C18:0 system below pH 7 (Figure S 3) and showing an overall negative charge. However, one should be aware that ζ-potential experiments are not structure-selective and we have no direct proof that the global negative charge is specifically associated to fibrillar structures rather than to a set of coexisting colloids composed of fibers
17
and residual micelles. If fibers are actually negatively charged, one should also not exclude the possibility that the charge density is too low to drive complexation with PEC.
The SAXS profile of the [G-C18:1 + PLL] at pH 5.50 (black curve, Figure 4c,d) is on the contrary very different than the corresponding [G-C18:1] + [PLL] control signal (grey curve, pH 5.50, Figure 4c): the mixture displays two sharp peaks at q1= 0.17 Å-1 and q2= 0.34
Å-1 (Figure 4d), referring to the (100) and (200) reflection of a lamellar order, while the control signal has the typical profile of single-wall vesicles, expected for G-C18:1 in water at concentration below 10 wt% and pH< 7.49,54 The q1:q2= 0.5 and the sharpness of the peaks (Δq=
1.4.10-3 Å-1) strongly suggest the presence of extended lamellar domains, never observed for this compound alone prepared under the same conditions. The corresponding cryo-TEM image in Figure 4e interestingly shows the systematic massive presence of vesicular objects having a thick lamellar wall (white arrows in Figure 4e), as similarly found in lipoplex systems,2,19 and other multilamellar walls vesicle PESCs,4 where the lipid walls (here G-C18:1) are held together by the sandwiched polyelectrolyte (here PLL). Cryo-TEM excludes the presence of a flat lamellar phase, or condensed platelets. A more detailed electron microscopy study of the [G-C18:1 + PLL] material under acidic pH conditions are reported elsewhere.64
To better understand the phase transition from alkaline to acidic pH, Figure 5 shows the full range of the pH-resolved in situ SAXS experiment, presented as 2D contour plots.
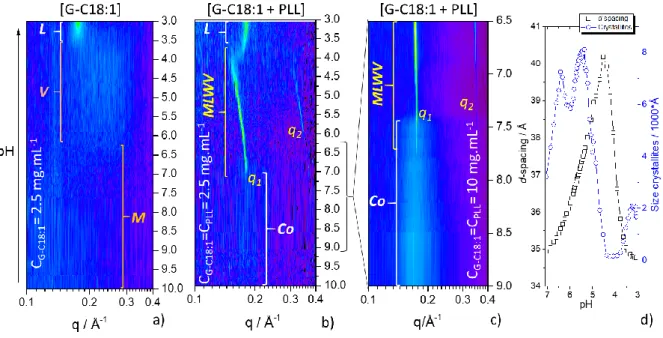
Figure 5 – pH-resolved (pH is changed from alkaline to acidic) in situ SAXS 2D contour plots of a) G-C18:1 control solution (C= 2.5 mg.mL-1), b) [G-C18:1 + PLL] sample at C
G-C18:1= CPLL= 2.5 mg.mL-1 and c)
[G-C18:1 + PLL] sample at CG-C18:1= CPLL= 10 mg.mL-1. M: Micellar phase; V: Vesicles phase; L: Lamellar
18
and size of crystallites at pH< 7 for experiment in b). d-spacing is obtained from 6.28/q1 while size of
crystallites is obtained using the Scherrer formula (0.9*6.28)/FWMH, where FWHM is the full width at half maximum of peak q1 given in Å-1 units. q1 and FWHM have been obtained by mean of a Lorentzian peak
fitting procedure.
The contour plot (0.1 < q / Å-1 < 0.4) concerning the pH dependency of G-C18:1 control sample solution is shown in Figure 5a. The pH region between pH 10 and ~6.5 is characterized by no distinct signal in the contour plot representation, as expected, because G-C18:1 forms a micellar, M, phase in this pH range.49,54 Below pH ~6.5 and until pH ~3.5, the contour plot shows a broad signal, characterizing the vesicle, V, phase and corresponding to the oscillation of the vesicle membrane form factor (grey profile, pH 5.5, Figure 4c) and largely documented in Ref. 49,54. Below pH ~3.5, two sharp diffraction peaks at q= 0.176 Å-1 and q= 0.352 Å-1 (Figure S 8) refer to the (100) and (200) reflections of a lamellar order and characterize a lamellar phase, L, precipitate in solution.49 In summary, the control G-C18:1 solution displays a micelle-to-vesicle-to-lamellar phase transition in agreement with our previous results.49
The contour plot for the [G-C18:1 + PLL] PESC at C= 2.5 mg.mL-1 is shown in Figure 5b. From pH 10 to about pH 7.5, the plot shows the dim signal of the broad (Δq= 0.06 Å-1) correlation peak at q= 0.171 Å-1 attributed to the Co phase, of which the composition is defined
earlier in the manuscript. Figure S 5 better highlights the peak, which is hardly observable in the contour plot due to a simple matter of plotting levels. The signal of the same phase is more intense and better identified at higher lipid and PLL concentration, as highlighted by the Co phase region between pH 9 and 7.5 in Figure 5c and Figure S 5. Below pH ~7.5, two sharp diffraction peaks of full width at half maximum Δq= 0.0015 Å-1, respectively corresponding to
the first and second order reflections, q1 and q2, of the multilamellar walls vesicle, MLWV,
phase in Figure 4d,e, are observed until pH 4. Figure 5b shows that the position of q1 (and q2)
varies continuously from q1= 0.178 Å-1 at pH 7.5 to q1= 0.157 Å-1 at pH 4, corresponding to a
variation in d-spacing of 5 Å, between 35 Å to 40 Å (black squares in Figure 5d). Below pH 4, the contour plot is characterized by an abrupt jump in the q-value from 0.157 Å-1 back to 0.176 Å-1, immediately stabilizing itself at 0.181 Å-1, and corresponding to a similar decrease in d-spacing of 5 Å, from 40 Å back to 35 Å.
The q1 peak below pH 4 has the same features (position, invariance of the position
towards pH, appearance in the same pH range) as the peak characterizing the L phase of the control G-C18:1 solution (Figure 5a). We then reasonably attribute it to the precipitation of the lipid L phase, probably without PLL, which is most likely expelled in the surrounding solution.
19
This assumption will be discussed in more detail in the next paragraphs. All in all, the G-C18:1 lipid undergoes a pH-driven Co-to-MLWV-to-L phase transition when mixed with PLL. In fact, this result is more general and not restricted to PLL only: we find similar results for all other PEC tested in this study and discussed elsewhere.64
In comparison to G-C18:1, SL-C18:0-based PESCs behave in a completely different manner, because they are characterized by a straight micelle-to-fiber phase transition around pH 7. No structural or morphological continuity in the micelle-to-fiber phase transition is ever observed for this system, where micelles are more thought to play a reservoir role rather than a nucleation site.49,59 Interestingly, when SL-C18:0 is mixed with PLL, we also observe a systematic direct coacervate-to-fiber phase transition (Figure S 9), where the coacervate signal signal (q= 0.078 Å-1; q= 0.15 Å-1) at basic pH fades away until the appearance of the typical fiber structural peak at q= 0.229 Å-1 below pH 7.49 This behavior follows the direct micelle-to-fiber phase transition observed for the SL-C18:0 control and we could reproduce it with all PEC employed in this work when they are mixed with this lipid.
Complex coacervate-to-Multilamellar wall vesicles (Co-to-MLWV) phase transition
The pH-resolved in situ SAXS experiments show a remarkably different behaviour of the G-C18:1 lipid in the presence of PLL with respect to the control. The latter undergoes a micelle-to-vesicle phase transition, driven by the carboxylate-to-carboxylic acid reaction upon lowering the pH and inducing a conformational change of the lipid. Low curvature membrane (Figure 6b) morphologies are then favoured over high curvature micelles (Figure 6a), due to the progressive disappearance of repulsive electrostatic interactions, which indirectly impact the packing parameter of the lipid.18,69 Our data show that the same phenomenon occurs in the
presence of PLL, when the lipid micelles are engaged in the formation of complex coacervates (Figure 6c). Upon lowering the pH, micelle-to-vesicle phase transition always occurs despite the presence of PLL; however, instead of forming single-wall vesicles, classically found in the control,54 we observe a Co-to-MLWV phase transition (Figure 6d).
The continuity in the phase transition and the isostructural and isodimensional correlations between the coacervate and MLWV phases is explicit in the 2D SAXS experiment at CG-C18:1= 10 mg.mL-1 (Figure 5c): the broad correlation peak of the Co phase at q= 0.171 Å-1
fades away between pH 7.7 and 7.5 and it overlaps to the sharp diffraction peak of the MLWV phase at q1= 0.179 Å-1. Their position only shifts in│q-q1│= 0.007 Å-1 (1.6 Å) strongly
suggesting an internal, progressive, restructuring of the coacervates into MLWV (Figure 6c,d). The average d-spacing associated to the q range contained between 0.171 Å-1 and 0.179 Å-1 is
20
d= 35.9 Å, in agreement with both the typical diameter of a G-C18:1 micelle and the thickness
of its corresponding membrane,49 but also to the length of a single lipid molecule, estimated to
be about 25 Å using the Tanford relationship.54,70 G-C18:1 is a bolaform amphiphile and we
have previously shown that its micellar structure is not a classical core-shell spheroid, where the diameter roughly corresponds to twice the size of the molecule,71 but rather to a core-shell ellipsoid, where the diameter matches the size of each single lipid, a typical behavior in bolaamphiphiles (Figure 6a,c).49,71,72 In the meanwhile, we have also shown that, differently than bilayer-forming lipids, G-C18:1 forms vesicles with an interdigitated lipid layer (IL), of which the thickness corresponds to the size of a single molecule (Figure 6b,d).49,54,71,72 In light of these observations, the most reasonable hypothesis explaining the Co-to-MLWV transition is a local decrease in curvature due to the micelle-to-IL transition (Figure 6c,d) of G-C18:1. The driving force is the screening of electrostatic repulsions between adjacent carboxylate groups due to progressive acidification (Figure 6a,b). The residual negative charges in the membrane guarantee a charge density high enough to promote electrostatic attraction with the positively-charged PLL contained between two G-C18:1 IL, as theoretically predicted and experimentally observed in polyelectrolyte systems at charged interfaces.41,73,74
The equilibrium curvature in lipid-polyelectrolyte complexes depends on a subtle force balance between the bending modulus and electrostatic energy, which can be comparable.38,39,75
Polymers can have a significant impact on the bending energy of lipid bilayers in the case of strong adsorption and large polymer volume fractions.36 For charged systems in particular, the
interplay between the bending stiffness of the lipid bilayer and the charge density of both the lipid bilayer and polyelectrolyte govern the overall free energy of the complex.4,25,38,39,75 As a consequence, it is not obvious to predict the equilibrium curvature in a complex polyelectrolyte-bilayer system at equilibrium,42,43 and this task becomes even harder, if not impossible, in non-equilibrium systems with variable surface charge density.
Micelles have a high charge density and a higher spontaneous curvature compared to vesicles. When the decrease in pH reduces the charge density inducing the micelle-to-vesicle phase transition, the PESC undergoes the Co-to-MLWV phase transition, meaning a decrease in spontaneous curvature. Interestingly, the pH region where this phenomenon occurs is the same in the control and in the complex, thus meaning that the contribution of the membrane bending energy prevails over the electrostatic energy contribution.38 It is also interesting to note that [G-C18:1 + PLL] PESCs form vesicular (MLWV), and not flat, multilamellar objects. This is also not an obvious result and it can also be explained by the subtle interplay between the electrostatic and bending energies.37,39 The former is not large enough to counterbalance the
21
membrane spontaneous tendency to bend; on the contrary, the magnitude of the latter, being proportional to the membrane bending rigidity,76 is not high enough to drive the complex
towards an infinitely small curvature, characterizing a flat structure.
In the description proposed by Brooks et al.36, the effective bending energy can significantly vary in the case of strong adsorption and large volume fraction of the polymer, meaning that, in principle, the polymer could flatten the membrane. Other authors point at the importance of the charge ratio, Z, between the polyelectrolyte and the lipid but also at the persistence length, that is the rigidity, of the polymer:7 for small Z and flexible polymers, supramicellar aggregates like complex coacervates are favoured, while for high Z and rigid polymers, micellar rods or flat bilayers might be favoured. In the present work we observe the same phase Co-to-MLWV transition, whichever the polymer employed, may it be PLL or chitosan, the latter being considered as rigid.7 The ionic strength is not controlled but the pH change process generates salt concentrations generally below 50 mM, which are generally enough to keep the rigidity properties of the polyelectrolyte.7 A specific comment on the ionic strength will be given at the end of the manuscript. The actual value of Z for our systems is harder to determine. A mere calculation based on the lipid and PEC concentrations and respective molecular weight indicates Z< 1, which is compatible, according to ref. 7, with the existence of complex coacervates. However, in these systems Z increases during pH variation because of the carboxylate-to-carboxylic reaction and in fact we are not able to quantify Z at a given pH simply because we cannot measure the actual surface charge density and distribution in PESCs. On the basis of these considerations, we conclude that the impact of polymer adsorption (including strength, quantity, rigidity and screening) is not strong enough to prevent the micelle-to-vesicle transition and to counterbalance the bending energy of the surfactant in the vesicle phase. For this reason, the stable phase is vesicular and not flat lamellar, as found at lower pH values.
In the MLWV phase, between pH 7.5 and 4, the d-spacing of the lamellar wall progressively increases from d= 34.9 Å (q1= 0.180 Å-1) to d= 40.2 Å (q1= 0.156 Å-1), before
precipitation of the L phase below pH 4 with d= 34.8 Å (q= 0.181 Å-1) measured at pH 3 (Figure 5d). At the moment of formation, MLWV have the same d-spacing value as in the L phase and this value is less than 1 Å shorter compared to the lamellar period in the G-C18:1 L phase control (d= 35.7 Å). The fact that the shortest d-spacing in the MLWV is comparable to the control is counterintuitive, because the interlamellar volume in the MLWV must accommodate PLL chains, which occupy a given volume. However, from the theory of polyelectrolyte adsorption on surfaces of opposite charges and from many experimental works, it is well-known
22
that polyelectrolytes can form a flat 2D layer.74,77 In this case, the thickness of the
polyelectrolyte layer corresponds to its molecular cross-section. The cross-sectional diameter of PLL is reasonably expected to be contained between 1 Å and 8 Å, the former being the lower limit found in many polymeric systems78 and the latter estimated in bilayer/PLL multilayers at pH below 7.79 The thickness of the G-C18:1 interdigitated layer can be calculated to be about 25 Å by applying the Tanford formula (L= 1.54+1.265*n, L being the length of the aliphatic chain and n the number of methylene groups)70 to an effective C16 aliphatic chain (considering the 120° of the double bond in G-C18:1) and taking 8 Å as the size of a single glucose molecule.80 Experimentally, we have estimated the thickness of the G-C18:1 membrane to be contained between 28 Å (pH 7) and 30 Å (pH 6) by modelling SAXS data (Figure S 4 in Ref.
49), with an error due to fitting process of at least ±10 %. To account for the experimental
d-spacing values, one has to consider a hydration interlamellar layer between 5.7 and 7.7 Å in the PLL-free control system, which can be classically found in lipid lamellar phases.81,82 At the moment of formation of the MLWV at pH 7 (d= 34.9 Å), one can otherwise estimate the contribution of PLL to the interlamellar layer to be contained between 4.9 Å and 6.9 Å, the latter being in better agreement with what it was experimentally reported in ref. 79 and taking into account a thickness of the IL of 28 Å.
Several points should be highlighted from the above:
- Considering the thickness of the lipid membrane, the resulting interlamellar space is compatible with the diameter of PLL. In other words, a single PLL layer accommodates in between G-C18:1 interdigitated layers during the formation of MLWV in agreement with the dilute and semidilute regimes described in ref. 74.
- Considering the fact that the interlamellar distance is practically equivalent to the expected diameter of PLL, one does not expect a significant content of hydration water and counterions in the proximity of PLL. This is consistent with the entropic gain of releasing water molecule and counterions during the formation of PESCs,4,25 verified and quantified below by ITC experiments. However, hydration water and counterions can fill the space between adjacent polyelectrolyte molecules, as also implied by the semidilute regimes described in ref. 74. - At the moment of MLWV formation and after precipitation of the L phase below pH 4, the thickness of the interlamellar space is the same and it is comparable with the interlamellar thickness in the PLL-free control. This fact shows that PLL can partly replace hydration water, confirming the assumptions above.
- Considering that d-spacing is the same at the moment of MLWV formation at pH 7 and after precipitation of the L phase below pH 4, one could formulate the hypothesis that PLL is trapped
23
in the L phase. Our data cannot directly prove this assumption, but we will provide more insights on this point in the following paragraphs, suggesting that this is not the case.
- Increase of the d-spacing in the MLWV between pH 7 and pH 4 is certainly related to the protonation of G-C18:1, an analogous, although opposite, mechanism described for systems composed of lipid membrane with constant charge density and pH-reactive polyelectrolytes.20 A more detailed explanation of the pH-dependent evolution profiles of both d-spacing and size of lamellar crystallites (Figure 5d) is given below.
- Reversibility of the Co-to-MLWV to MLWV-to-Co phase transitions is addressed on Figure S 10, of which a)-panel focuses on the alkaline-to-acidic Co-to-MLWV transition (C= 10 mg.mL
-1), discussed above, and b)-panel highlights the reversed acidic-to-alkaline pH variation
performed on the same sample. Figure S 10b shows the lamellar peak of the Co-to-MLWV phase but it does not show any evidence of the correlation peak typical of the Co phase, indicating that the Co-to-MLWV phase transition is not reversible. This could be due to a number of reasons among which the screening effect of salt generated during the pH variation process, known to have a strong impact on the phase diagram.25
24
Figure 6 – Schematic view of the pH-driven transition between (a) micelles and (b) interdigitated membrane composed solely of G-C18:1. In the presence of PLL, the transition between the (a) complex coacervate and (b) the multi-lamellar wall in the MLWV occurs via a morphology change (micelle-to-vesicle) but a structural continuity (micelle-diameter ≈ membrane thickness). e) Insight on the evolution of the pH-dependent interlamellar spacing inside the multi-lamellar walls of MLWV: upon decrease in the membrane charge density, PLL expands and it applies a repulsive pressure to the lipid membranes. When the membrane is close to neutrality, long-range order is lost, MLWV disassemble, PLL is expelled and G-C18:1 precipitates into a hydrated lamellar phase.
The pH-dependent d-spacing evolution is explained by looking at the intermolecular forces equilibrating in the interlamellar space. In a polymer-free lipid bilayer system, attractive Van der Waals interaction counterbalances two short-range (< 30 Å), steric and hydration, and
-+ + + + + - + -+ + + -- -- -
-a)
b)
pH High Lowc)
d)
31 .8 Å + + +-- -- --
+ ++ + + -++ + ++ 7 5 3 pHLipid charge density
4 Loss in long-range order + +
e)
< 1 0 Å < 15 Å < 10 Å Hydration water25
two long-range (> 30 Å up to hundred of nanometers) repulsive interactions, electrostatic and thermal undulation.83–85 For interlamellar spacing below 30 Å, which is the case here,
electrostatic and undulation are generally neglected. In the case of a polyelectrolyte contained between membranes with variable charge density, which is the case in this work, one should consider additional terms in the energy balance like a repulsive free polymer term, including chain elasticity and excluded-volume terms, an entropic contribution of the small ions, an electrostatic contribution, containing the polyelectrolyte-surface attractive and inter-chain repulsive interaction.40,41,73,74,86,87 Under the conditions of MLWV formation, around pH 7, the negatively-charged G-C18:1 membrane undergoes strong electrostatic attraction with PLL, largely-documented in both theoretical and experimental works on polyelectrolytes at charged interfaces.41,73,74,87–89 When pH decreases, the carboxylate to carboxylic acid reaction reduces the number of negative charges and, consequently, it lowers the charge density of the lipid membrane. Since the attractive electrostatic component in the lipid-polyelectrolyte complex depends on the lipid charge density, lowering pH will reduce its contribution to the free energy. The consequence will be an increased volume occupied by the polyelectrolyte,74 which will cause an increase in the repulsive osmotic pressure40,41 with consequent swelling of the membranes, experimentally shown in Figure 5b,d and schematized in Figure 6e.
Below pH 4, the MLWV peak disappears until pH ~3, when the signal of the L phase at
d= 34.8 Å appears again. Interestingly, this value is practically the same one observed at the
moment of the MLWV formation at pH 7 and actually 0.9 Å smaller than the d-spacing found in the G-C18:1 control at the same pH value. Such an observation could induce to formulate the hypothesis that in the MLWV-to-L phase transition below pH 4, PLL is confined in between the lamellae. In fact, we believe that this is not the case for several reasons. It is well-known that at low hydration and in the absence of specific attraction interactions, large polymers segregate outside the lipid interlamellar space.90 However, the polymer cannot be reasonably expelled from a dense, closed, multilamellar object. The evolution of the crystallite size with pH in Figure 5d helps understanding the mechanism of expulsion. Between pH 5 and 4, d-spacing is still increasing, testifying of the expansion of the lamellae due to the repulsive pressure applied by PLL. In the meanwhile, the peak becomes broader, with consequent drop in the crystallite size. At pH 4, the peak becomes so large that the crystallite size has dropped from several thousand of Ångstrom to only few Ångstrom, while d-spacing drops back to 34.7 Å. Below pH 5, the repulsive pressure exerted by PLL becomes so strong that the long-range order in the MLWV is lost. Complete disruption of the multilamellar walls occurs below pH 4, when PLL could eventually be expelled in the surrounding aqueous solution. Upon expulsion
26
of PLL, G-C18:1 precipitates in its thermodynamically favorable L phase, the same as found in the control lipid solution. This mechanism is summarized in Figure 6e at pH below 5.
Study of the interactions between glycolipids and PLL
To confirm and quantify the interactions between G-C18:1 and PLL in the MLWV phase, as hypothesized in Figure 6, and to prove that SL-C18:0 fibrils do not contain PLL, we run a combination of solution NMR and ITC experiments. 1H NMR is employed to prove the presence (or absence) of PLL at pH 5, either in the fiber or MLWV phase. From 1H NMR experiments, it is also possible to estimate the efficiency of the assembly process and the [COOH]-to-[NH2] molar ratio. MLWV and fibers formed at pH 5 are centrifuged out of their
parent solution, dried, dissolved in MeOD-d4 and analyzed by 1H NMR employing an internal reference (0 ppm, TMSP-d4, C= 5.8 mM). The lipids are characterized by a well-defined triplet around 2.18 - 2.20 ppm (RCH̲ 2C=O) while PLL is characterized by a broad signal at 2.92 ppm
[(RCH̲ 2NH2)x (x ~ 20)].
In the [SL-C18:0 + PLL] system, only the peaks of SL-C18:0 are observed while the characteristic peak of PLL at δ = 2.92 ppm is not detected in any of the samples initially prepared at various SL-C18:0-to-PLL ratios (Figure S 11c,d). If SAXS and cryo-TEM data (Figure 4a,b) show the formation of twisted ribbons, NMR shows that their composition is only constituted by SL-C18:0, demonstrating, within the NMR sensitivity, that they do not contain PLL, thus confirming the absence of specific interactions between SL-C18:0 and PLL.
The characteristic peaks of both G-C18:1 (δ = 2.20 ppm) and PLL (δ = 2.92 ppm) are on the contrary observed in the MLWV phase (Figure S 11a,b), showing the simultaneous presence of both G-C18:1 and PLL, thus supporting the hypothesis of strong interactions between these compounds.
Table 2 shows the quantitative analysis of the NMR data (full integration data are given in Table S 1). The initial [G−C18:1]𝐼𝑛
[PLL]𝐼𝑛 molar ratio corresponds to the initial solution (exact
concentrations are given in Table S 1), while [G−C18:1]𝐹
[PLL]𝐹 corresponds to the final ratio found in
the MLWV phase. The former, also known as r in the literature,21 is generally different than the latter, known as r*.21 This behaviour is expected and often reported for complex coacervate systems, which follow their own stoichiometry even if the initial ratio is not optimized.21
[G−C18:1]𝐹


![Figure 3 – a) SAXS profile recorded for a co-assembled mixture of [SL-C18:0 + PLL] (black curve) at pH 8.68](https://thumb-eu.123doks.com/thumbv2/123doknet/14392602.508441/12.892.107.787.318.975/figure-saxs-profile-recorded-assembled-mixture-black-curve.webp)

![Figure S 4 shows the control signals of single components: the red curve for [PLL] alone and the blue one for [SL-C18:0] alone](https://thumb-eu.123doks.com/thumbv2/123doknet/14392602.508441/52.892.236.615.148.719/figure-shows-control-signals-single-components-curve-pll.webp)
![Table S 1 – Quantitative analysis of the integrals corresponding to the 1H NMR spectra of the [G-C18:1 +PLL] samples in MeOD-d4, shown in Figure S 11](https://thumb-eu.123doks.com/thumbv2/123doknet/14392602.508441/61.892.168.709.76.1163/table-quantitative-analysis-integrals-corresponding-spectra-samples-figure.webp)

