Prof. P. R. Grayt Prof. P. G. Katona Prof. W. T. Peake4 Prof. W. A. Rosenblith Prof. W. M. Siebert Prof. T. F. Weiss$ Dr. J. S. Barlow** Dr. G. O. Barnett J. E. Berliner G. von Bismarck L. D. Braida S. K. Burns A. N. Chandra H. S. Colburn P. Demko
Academic and Research Staff Dr. A. Borbelytf Dr. A. W. B. Cunningham$$ N. I. Durlach Dr. O. Franzen*** Dr. R. D. Hall Dr. G. Hellekantttt Dr. N. Y. S. Kiang$ Dr. R. G. Markt$t Graduate Students J. E. Evans J. A. Freeman J. J. Guinan, Jr. R. M. Hershkowitz H. S. Hsiao E. G. Merrill Dr. M. Nomoto**** Dr. K. Offenlochtftt Dr. R. Rojas-Corona Dr. G. F. Songster R. M. Brownr A. H. Cristt W. F. Kelley D. P. Langbeint E. C. Moxon M. J. Nahvi R. E. Olsen S. E. Portny D. J-M. Poussart I. H. Thomae M. L. Wiederhold Undergraduate Students S. J. Bayer J. F. Fairbanks R. M. Farrell
S. Malgari
K. J. Sullivan
This work was supported principally by the National Institutes of Health (Grant
2 P01 GM-14940-01), and in part by the Joint Services Electronics Programs (U. S.
Army, U. S. Navy, and U. S. Air Force) under Contract DA 28-043-AMC-02536(E), the
National Aeronautics and Space Administration (Grant NsG-496), and the National
Insti-tutes of Health (Grant 2 ROl NB-05462-03).
Leave of absence, at General Atronics Corporation, Philadelphia, Pennsylvania.
Also at Eaton-Peabody Laboratory, Massachusetts Eye and Ear Infirmary,
Boston, Mass.
Research Affiliate in Communication Sciences from the Neurophysiological
Labo-ratory of the Neurology Service of the Massachusetts General Hospital, Boston, Mass.
ttPostdoctoral Fellow from the Brain Research Institute, University of Zurich,
Zurich, Switzerland.
t t
Associate in Pathology, Peter Bent Brigham Hospital.
Postdoctoral Fellow from the Speech Transmission Laboratory, The Royal
Institute of Technology, Stockholm, Sweden.
Postdoctoral Fellow from the Department of Physiology, Kungl. Veterinarskolan,
Stockholm, Sweden.
tlAssistant Resident, Harvard Medical Service, Boston City Hospital, Boston, Mass.
****Public Health Service International Postdoctoral Research Fellow, from the
Department of Physiology, Tokyo Medical and Dental University, Tokyo, Japan.
IAssociate in Medicine, Department of Medicine, Harvard Medical School, and
Direc-tor, Laboratory of Computer Science, Massachusetts General Hospital.
""Public
Health Service International Postdoctoral Fellow from the Max Planck
Institut for Brain Research, Frankfurt, Germany.
A. ON EXTRACELLULAR POTENTIALS IN A VOLUME CONDUCTOR
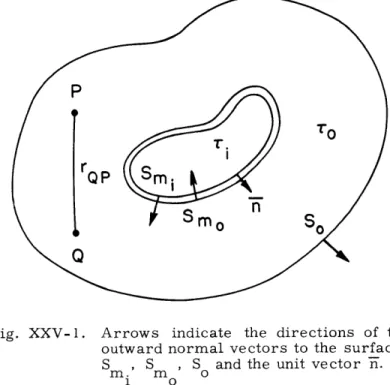
This report is concerned with the extracellular potential generated by a cell situated in a volume conductor. A derivation of the results will be followed by (i) a brief discus-sion of the results obtained by others, and (ii) a discusdiscus-sion of related problems con-cerned with cellular potentials.
Consider a cell whose membrane separates two ionic solutions: the inner solution defines a volume, T., that is bounded by the inner surface of the membrane, Sm. , and
1 the outer solution defines a volume, T , that is bounded by the outer surface of the mem-brane, Sm , and by an insulating boundary, So . The inner and outer ionic solutions are
o1
assumed to be characterized by their conductivities, . and 0 , respectively.
Further-more, we assume that quasi-statics applies and, therefore, that the electric field may be derived from the gradient of the electric potential.
Fig. XXV-1. Arrows indicate the directions of the outward normal vectors to the surfaces S , S , S and the unit vector
n.
m. m o
1 o
Suppose that two potential functions q and 4 are defined on T. and T , where 9 satisfies Laplace's equation on
T.
10i and T ,V2 = 0
on T., T .1 0V,4 (4) dT =
m.
I
where the volume integral on the left is taken over the volume T., and the surface
1integral on the right is taken over the surface S
which bounds
T..m.
1
1
tion of a differential element of surface area on S
is taken as the
m.
1
the surface, as shown in Fig. XXV-1.
The positive
direc-outward normal to
ButV ( CV)
= V
V- + gV
2
(2)
Therefore
(V
V + V2
)
dT = i m. 1V - dS.
Now consider the volume integral on the function 7V (*7 ).
this yields
T.~(7e
+
d25(74
* V
+PV
4)dT=
T. By an identical argument,V7
• dS.
S' -S m. 1Now subtracting Eq. 4 from Eq. 3 yields
sT. 1
(
zV
Z
i )
dT =Y
m.
1Equation 5 is known as Green's theorem (see for instance, Stratton
l), and for V
7
2= 0
it yields
V2 dT =
YS
m.
1(4V - CVi). dS.
By an analogous argument, the volume integral on T is related to the surface integral
bounding the volume
V
dT =S
S
o,S
(7V
-
V7)
- dS.
T.i-S
T. 1-5
T(6)
( V7 - V7) . dS.1
Let
=-
,
where rQp is the distance from a source point,
Q,
located at rQ to a
rQp
point of observation, P, located at rp. Now it can be shown (See Panofsky and Phillips
)that
2
r 1
= -4Truo(rQ),QP
where the Laplacian operator is evaluated at the field point, P, and Uo(rQp) impulse having the property
is the unit
f(F ) uo(rQp) dT = f(rp) if T included the point for which
Substitution for 4 in Eqs. 6 and 7 yields
45r(rFp)
=S
m. 1 0 -m. ];s 41T (Fp) =m
1
rQp
(
1
1rQV
So
7p-c
r~)
I
*.i
V74 -
7 r
* dS
-
V r
)dS
rP
rQP
cV
- dS
'Qp)
or P in T.1 or P not in T.1 for P in T o 0=m
'So 01
-rp
r1rP
dS for P not in T. oConsider an observation point in To, then add Eq. 10 to Eq. 9 multiplied by an
arbitrary constant, a, to obtain
4~r(rp) =
S
, o m. 1V -
Vr
) *dS
rQp =
and
(11)
(12)
(10)
for any point in T . Integrals to be evaluated on the inner and outer surfaces of the membrane can be expressed in terms of the potential on the inner surface of the mem-brane, Vi, the potential on the outer surface of the membrane, V , and the membrane
current density, Jm. Assuming that the normal component of current is continubus through the membrane, and assuming the convention that the current density is positive when it flows from the inside to the outside of the membrane, one obtains
0
S.(
1rQP 0Vi1
1rQP')
P
S
(
1-
r
dS, (13)where
7c
= - in the volume conductors, J is the current density, and a- is thecon-ductivity (a, in
T.and arin
T0). 1
It is useful to combine the two terms that correspond to integrals over the two sur-faces of the membrane. Since cellular membranes are very thin (thicknesses of the order of 100 A) as compared with both the radius of curvature of the membrane and the observation distance, it seems reasonable to assume urrthat distances from the inner and outer surfaces of the membrane to any observation point are approximately equal and that the surface elements, dS, over the inner and outer surfaces differ only in the directions of the outward normals. The differential elements of surface area on S
m.
1
and Sm can be expressed in terms of the vector _i da, where Fnis a unit vector normal
O
to the membrane and pointing from inside to outside, and da is a scalar, differential element of area.
Also, J n J and
(V
- -n is written as V to yieldm P nr p
4 S(rp) (a+ - aV) V 1 da
Sm
QPmo
i
f
o
nrQP
+ I V -
V
i dS. (14)Since a is an arbitrary constant, a variety of expressions can be obtained from
0".Eq. 14, depending upon the choice of a.
If a is chosen to equal-,
then Eq. 14
o
becomes
4
Tp(r) =
(
_i
i V
7
da
rp m 0 -- nrP
+
V-PV
-
-
*dS.
(15)
From Eq. 15 the extracellular potential can be calculated from the distribution of
the inner and outer surface potentials on the membrane.
Equation 15 has previously
been derived by Geselowitz,
Plonsey,
and Stevens.
6For a
=
1, define V
=
V.
-
V
and one can obtain an expression for the
extra-cellular potential in terms of the membrane current, Jm' and the membrane voltage, Vm:
41T(rp) = S
r
m
-
Vm n
da
+
V - V
* dS.(16)
Equation 16 was obtained by Geselowitz.
3Other interesting expressions can be derived from Eq. 14, and by making suitable
approximations (for instance, by assuming V
o<<
Vi), other useful expressions can be
obtained.
The papers of Geselowitz,
3Plonsey,
4 ,5 and Stevens
6should be consulted
for discussions of those expressions.
Geselowitz
3has also considered the case of an
inhomogeneous volume conductor surrounding a cell.
The inhomogeneity is represented
by allowing for the presence of volumes of conductivity other than
(oin
T
.
Equation 14
can be generalized to include this kind of inhomogeneity in the volume conductor by
addi-tion to Eq. 14 of terms of the form
S
QP
-
'-)
- dS,
where the integral is evaluated on the surface, S
k ,of the k
t hbody,
Tk-The field-theoretic approach to the representation of bioelectric potentials has made
some contact with problems in electrophysiology.
For tutorial purposes, we would like
to review briefly and comment upon these problems.
Craib
7may have been the first investigator to report on the differences in the wave
shape of extracellular potentials recorded from a strip of muscle placed in a limited
and in an extended volume conductor. Craib
7noted that with monopolar recording, the
extracellular compound action potential recorded from a muscle in a limited volume
conductor in response to a brief electric stimulus was monophasic. The response of
the same muscle immersed in an extensive volume conductor was triphasic. A
com-prehensive treatment of the theoretical problem was given by Lorente de No,
8based
upon a paper by Helmholtz
9on potentials in a volume conductor (for a modern treatment
of the more general problem of potentials in a volume conductor see Strattonl).
Lorente de No
8also performed experiments on frog sciatic nerves and was able to
account for the extracellular potentials recorded in a large volume of saline solution
on the basis of the theory and recordings made with the nerve in a limited volume
con-ductor. Hakansson10 has reported on a similar experiment performed on single muscle
fibers. In this case, intracellular and extracellular potentials were recorded
simul-taneously. The results of all of these investigations indicates that one can account in at
least a qualitative manner for the triphasic potential recorded from nerve and muscle
bundles and fibers in extended volume conductors. Qualitative theoretical arguments
(in addition to the formal treatments cited previously) to account for this observation
have been given by Mauro, 11 Offner,12 and Woodbury.
1 3A field-theoretic approach might conceivably also have relevance for the
justifica-tion of the distributed electric circuit representajustifica-tion of axons and muscle fibers (often
referred to as the core conductor model). A start in this direction has been made by
Clark and Plonsey.
14For instance, the circuit-theoretic approach leads to the result
that the extracellular potential is proportional to the membrane potential in the
extra-polar region.15 This result appears to be in substantial agreement with experimental
data obtained with the fiber immersed in a limited volume conductor (a condition that
is realized experimentally by placing the fiber in air, oil or a de-ionized sucrose
solution, and recording from the surface of the fiber to which a thin film of ionic
solu-tion presumably still adheres). Such a result should, in principle, be derivable directly
from the field-theoretic approach.
T. F. Weiss
References
1.
J. A. Stratton, Electromagnetic Theory (McGraw-Hill Book Company, New York,
1941).
2.
W. K. H. Panofsky and M. Phillips, Classical Electricity and Magnetism
(Addison-Wesley Publishing Company, Reading, Mass., 1955).
3.
D. B. Geselowitz, "On Bioelectric Potentials in an Inhomogeneous Volume
Con-ductor," Biophys. J. 7, 1-11 (1967).
4. R. Plonsey, "An Extension of the Solid Angle Potential Formulation for an Active Cell," Biophys. J. 5, 663-667 (1965).
5. R. Plonsey, "Volume Conductor Fields of Action Currents," Biophys. J. 4, 317-328 (1964).
6. C. F. Stevens, Neurophysiology: A Primer (John Wiley and Sons, Inc., New York, 1966).
7. W. H. Craib, "A Study of the Electrical Field Surrounding Skeletal Muscle," J. Physiol. 66, 49-73 (1928).
8. R. Lorente de N6, "Analysis of the Distribution of the Action Currents of Nerve in Volume Conductors," Studies Rockefeller Inst. Med. Res. 132, 384-477 (1947). 9. H. von Helmholtz, "Ueber einige Gesetze der Vertheilung elektrischer Str6me
in k6rperlichen Leitern mit Anwendung auf die thierisch-elektrischen Versuche," Poggendorff's Ann. 89, 211-233; 353-377 (1853). Reprinted in H. Helmholtz Wiss. Abhandl. 1, 475-519 (1883) (Johann Ambrosius Barth, Leipzig).
10. C. H. Hkansson, "Action Potentials Recorded Intra- and Extra- cellularly from Isolated Frog Muscle Fibre in Ringer's Solution and in Air," Acta Phys. Scand. 39,
291-312 (1957).
11. A. Mauro, "Properties of Thin Generators Pertaining to Electrophysiological Potentials in Volume Conductors," J. Neurophysiol. 23, 132-143 (1960).
12. F. F. Offner, "The Tri-phasic Action Potentials," Electroenceph. Clin. Neuro-physiol. 6, 507-508 (1954).
13. J. W. Woodbury, "Potentials in a Volume Conductor," pp. 85-91 in Physiology and Biophysics, T. C. Ruch and H. D. Patton (eds.) (W. B. Saunders Company,
Philadelphia, 19th edition, 1965).
14. J. Clark and R. Plonsey, "A Mathematical Evaluation of the Core Conductor Model," Biophys. J. 6, 95-11Z (1966).
15. A. L. Hodgkin and W. A. H. Rushton, "The Electrical Constants of a Crustacean Nerve Fibre," Proc. Roy. Soc. (London) B133, 444-479 (1946).
B. PULSE-DURATION MODULATOR
[This report summarizes an S. B. thesis submitted to the Department of Electrical Engineering, M. I. T., June 1967.]
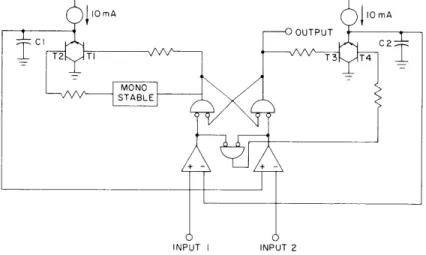
A simple circuit has been developed for tape recording of bioelectric signals. It is a pulse-duration modulation system that multiplexes two inputs. The frequency range is from DC to 500 Hz. The basic operation of the system is illustrated in Fig. XXV-2. With a positive input on #1 and #2, CI charges at a uniform rate until its voltage is
equal to input #2, at which point C2 begins to charge, again at a uniform rate until its
voltage reaches the level of input #1. Then the cycle repeats itself. Output is in the form of a pulse train, the "high" pulse length is proportional to input #2, the "low" pulse length is proportional to input # 1.
Differential inputs have been added to permit bipolar inputs of ±1 volt, with output pulse lengths from 50 to 450 msec.
INPUT I INPUT 2
INPUT #1
INPUT #2
HIGH OUTPUT Lw
Fig. XXV-Z.
Illustrating system operation.
Tests have shown a linearity of better than 1 per cent and a less than 5 per cent change in output pulse length for temperature variations from -35 C to +90'C.
K. J. Sullivan C. PSYCHOPHYSICS
Recent work in psychophysics has consisted in (a) performing further experiments on binaural signal detection, (b) initiating experiments on interaural just-noticeable dif-ferences and time-intensity trading, (c) examining the possibility of predicting inter-aural jnd's from auditory nerve data, (d) determining the effect of duration on the discrimination of periodicity pitch, (e) exploring the extent to which detection, discrim-ination, and absolute identification performance can be predicted from magnitude esti-mation data, (f) studying uncertainty estimates in absolute identification, (g) examining sequential dependence in auditory intensity discrimination, (h) gaining familiarization with problems in the study of short-term memory of sounds, (i) constructing a stimulus-timing device, (j) constructing a detection and triggering device for bat signals,
(k) writing programs on the PDP-4 computer for processing various types of
psycho-physical data, and (1) building interface equipment for the PDP-4 computer that will increase its useability for on-line experiments. A few of these items are discussed here. The rest will be discussed in future reports.N. I. Durlach
1. BINAURAL SIGNAL DETECTION
Further experiments have been performed on the binaural unmasking of tones masked by random noise as a function of noise bandwidth and interaural phase. In all
cases, the tone and noise were identical from ear to ear, except for phase. The results are reported in terms of binaural masking-level differences (BMLD's), where the homophasic configuration (tone and noise identical from ear to ear) is taken as the
ref-erence condition. The BMLD's are denoted B( sl n),where 0s is the interaural phase of the tone, and 0n that of the noise. The symbols fo, W, and P denote the frequency of the tone, and bandwidth of the noise, and the total power of the noise, respectively.
The motivation for performing these experiments was (i) to explore further the increase in BMLD's with a decrease in bandwidth previously reported at f0 = 500 Hz by
1 Z 3
Langford and Jeffress, Bourbon and Jeffress, and Riezenman ; (ii) to determine the way in which the "flattening" phenomenon that occurs in B(01 n) for fo < 500 Hz
(dis-4 0
covered by Jeffress, Blodgett, and Deatherage, and studied further by Durlach and Rabiner, Laurence, and Durlach6 ) is influenced by choosing values of 0s other than zero; (iii) to evaluate the prediction (implied by the "decorrelation-factor" hypothesis considered by Rabiner, Laurence, and Durlach6 ) that the flattening in B(0 n )
decreases as the bandwidth of the noise is decreased; and (iv) to evaluate the predic-tion by Green7 concerning the bandwidth dependence of B(1800 0) at the lower frequen-cies. Most of the measurements in the present set of experiments were made for frequencies, f , in the range Z50 < fo < 400 Hz, power levels P in the range 85 dB < P < 90 dB SPL, and for bandwidths W of 4, 250, and 1000 Hz. A few measurements were also made for fo covering the range 250 < fo < 4000 Hz and bandwidths, W, of 3
and 1000 Hz.
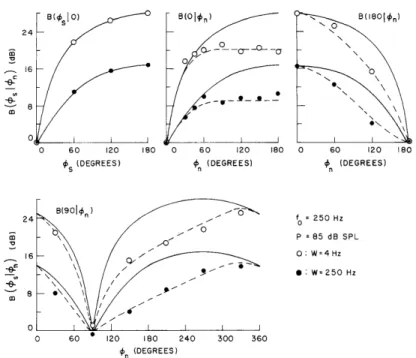
The results of these experiments show that the increase in BMLD's with a decrease in bandwidth occurs at all frequencies in the range 250 < fo < 4000 Hz, and that pre-vious predictions for the bandwidth dependence are inadequate. Data from a single subject in the principal low-frequency experiment are shown by the points in Fig. XXV-3. The solid and dashed curves are based on the equalization and cancellation (EC) model.5 - 10 The solid curves are derived from the preliminary version of the model and are computed from the formula
k
-
cos
(s - n)
()
B(s On
)=
k
24 m 0o--- -o 16 \0 S\ 0 0 60 120 180 0 60 120 180 0 60 120 180
S (DEGREES) n (DEGREES) n (DEGREES)
B(901€n ) ' 24 fo = 250 Hz / P z 85 dB SPL 16 \ / 0: W=4Hz -e5 /-i~ S/ -: Wz250 Hz -.- N/ a 8 \ 0 0 60 120 180 240 300 360 On (DEGREES)
Fig. XXV-3. B( sL n)(W) for a single subject at fo = 250 Hz and P = 85 dB SPL. [The dashed and solid
curves coincide for B(s I 0)(W).]
where k = 1. 0450 for W = 250 Hz, and k = 1. 0033 for W = 4 Hz. In previous work, it has been shown that Eq. 1 is capable of providing a precise description of B( s 0), but that it is inadequate for describing B(Ol n) at frequencies fo < 500 Hz and values of n greater than H/2nfo, where H
=
0. 7 msec. These results are again confirmed by the present experiments. The phenomena that are evident in Fig. XXV-3 and about which there are very little previous data are (i) the growth of BMLD's with a decrease in W; (ii) the manner in which the flattening in B(0 In ) is transformed when s takes on values different from zero; and (iii) the way in which the deviations between the data and the preliminary model are related to noise bandwidth. Roughly speaking, the increase in the BMLD's at f = 250 Hz as W is decreased from 250 Hz to 4 Hz can beo
summarized by noting that B( sln)(W= 4)/B( sl n)(W= Z50)= 10 dB for all cases tested in which s - n * 0, and that B(p s n) = 0 dB when
4s
-n = 0, independent of W. In considering these results, it should be recalled that BMLD's vary very slowly with power level, so that the increase in the power level at the output of the critical band produced by decreasing W from 250 Hz to 4 Hz (with P held constant) has a very small effect on the BMLD's, and the increase of the BMLD's can be ascribed almost entirely to the bandwidth effect itself.According to the revision of the EC model proposed by Rabiner, Laurence, and Durlach,6 the ratio B(1800
the curves for B( s 0) and B(0 n), should decrease as W is decreased. This predic-tion is clearly contradicted by the data. Similarly, the prediction of Green7 that
B(180 0 0) is proportional to (3 + ZWT)- /2, where W is measured at the output of the critical band, and T is the integration time of the system (or the signal duration if this duration is shorter than the integration time), has been found inadequate. Whereas the bandwidth effect has been found to be approximately 10 dB, Green's formula pre-dicts an effect of less than 5 dB.
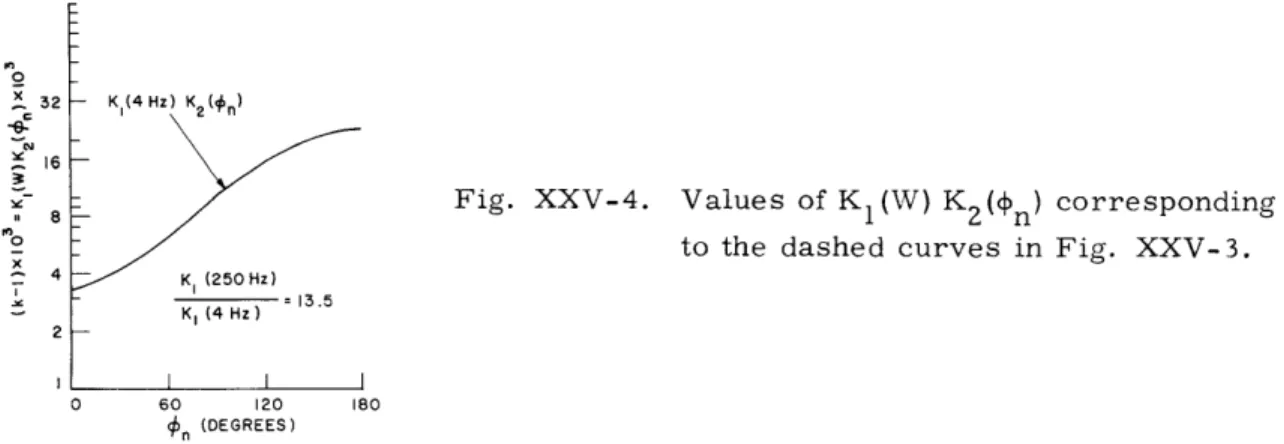
The dashed curves in Fig. XXV-3 have been derived by assuming that k is indepen-dent of cs and that it depends on n and W in such a way that the deviation of k from unity (i. e., the difference between the "real" k and the k that would occur if the sys-tem performed perfectly) can be factored into a product of a bandwidth factor and a noise-phase factor. The formula derived from this assumption is identical to Eq. 1, except that k must be replaced by k = 1 + K
1(W) K2 (n)
1 + K (W) K2
(
n ) - cos (, - n)B(s In) (W) =
(2)
K1(W) K2 (nn)
The dashed curves are obtained by choosing the function K1(W) KZ (n) to fit the data in
Fig. XXV-3, and the values of K1(W) K2( n) corresponding to these curves are shown
in Fig. XXV-4. On the whole, the assumption that k is of the form k = 1 + K1(W)K( n )
0
32 K1(4Hz) K2(#n)
-8-16
Fig. XXV-4. Values of K1(W) K2(, n) corresponding
Sto the dashed curves in Fig. XXV-3.
4 K (250 Hz) 13.5 KI (4 Hz) 2 0 60 120 180 On (DEGREES)
has been found capable of providing an excellent representation of the data. Although the function k = 1 + Kl (W) K2 (n) obviously permits considerable flexibility, it is much more restrictive than the function k= k(W, 4n, as) that corresponds to a pure fitting
pro-cedure without any structural constraints. Furthermore, it is the author's conjecture that similarly good results would be obtained for configurations in which the interaural amplitude ratio a of the tone is varied. In other words, we believe that the success of the model for the case B(a s,
4s
0) demonstrated by Colburn and Durlach9 can beW and n, as in the present analysis. The prediction for this more general case is given by
6-4j
a3-2j
1 2
n
s
s
cos
s
n
B(a
s,
s
n)(W) = Maximum
2,
(3)
2K1(W) K2( n)where
j
= 1 when as < 1, and j = 2 when as > 1. In order to determine the accuracy of this generalization, and in order to determine whether or not the results on K l (W) K2(n)can be given any meaning other than that associated with the fitting of the data on BMLD's, requires further work. A paper on the present results is being prepared for publication. Details on some of this work can be found in the author's S. M. thesis.
P. J. Metz
References
1. T. L. Langford and L. A. Jeffress, "Effect of Noise Crosscorrelation for a Narrow-band Masking Noise on the Detection of a Tonal Signal," J. Acoust. Soc. Am. 36, 1042(A) (1964).
2. W. T. Bourbon and L. A. Jeffress, "Effect of Bandwidth of Masking Noise on Detection of Homophasic and Antiphasic Tonal Signals," J. Acoust. Soc. Am. 37,
1180(A) (1965).
3. M. J. Riezenman, "Binaural Unmasking as a Function of the Bandwidth of the Masking Noise," S.B. Thesis, Department of Electrical Engineering, M.I.T., June 1965.
4. L. A. Jeffress, H. C. Blodgett, and B. H. Deatherage, "Masking and Interaural Phase. II. 167 cps," J. Acoust. Soc. Am. 34, 1124-1126 (1962).
5. N. I. Durlach, "Equalization and Cancellation Theory of Binaural Masking-Level Differences," J. Acoust. Soc. Am. 35, 1206-1218 (1963).
6. L. R. Rabiner, C. L. Laurence, and N. I. Durlach, "Further Results on Bin-aural Unmasking and the EC Model," J. Acoust. Soc. Am. 40, 62-70 (1966). 7. D. M. Green, "Signal-Detection Analysis of Equalization and Cancellation Model,"
J. Acoust. Soc. Am. 40, 833-838 (1966).
8. N. I. Durlach, "Note on Binaural Masking-Level Differences as a Function of the Interaural Correlation of the Masking Noise," J. Acoust. Soc. Am. 36, 1613-1617
(1964).
9. H. S. Colburn and N. I. Durlach, "Time-Intensity Relations in Binaural Unmasking," J. Acoust. Soc. Am. 38, 93-103 (1965).
10. N. I. Durlach, "On the Application of the EC Model to Interaural JND's," J. Acoust. Soc. Am. 40, 1392-1397 (1966).
2. DETECTION AND TRIGGERING DEVICE FOR RESEARCH ON BAT-ECHOLOCATION SYSTEMS
In the studies of bat sonar being carried out by F. A. Webster,1 it is often nec-essary to turn on equipment (such as a camera or jammer) at a precise instant in time
determined by the activity of the bat.
In most previous work, this instant has been
determined by visual or acoustical observation of the bat by the experimenter, and the
turning-on of the equipment has been accomplished manually by pressing a button.
Inasmuch as many of the bat's operations are performed very quickly, this procedure
has often proved inadequate.
In order to improve this situation, it was necessary to build a trigger that would
fire the auxiliary equipment automatically when the bat' s behavior reached some
pre-determined criterion. The behavioral parameter suggested by Webster as the most
useful was the repetition frequency of the bat's emitted signal.
Specifically, it was
suggested that a device be built that would trigger the auxiliary equipment when the
repetition rate exceeded a certain preset value.
Such a device has now been constructed and consists of an analog circuit for
detecting bat pulses in the presence of noise and echoes, and a digital circuit for
deter-mining the pulse repetition frequency.
We have attempted to eliminate echoes by
providing an adjustable detection threshold and a "blanking gate" that gates off the
received signal for a certain adjustable period (4-10 msec) after the threshold has been
exceeded.
The optimal settings of the threshold and the blanking gate depend on the
strength of the bat signal and on the acoustical environment. The device is also
adjust-able with respect to both the repetition rate required to fire the trigger pulse
(10 pulses/sec to 250 pulses/sec) and the number of consecutive pulses that must
satisfy the repetition rate criterion (2-7).
Once the trigger pulse has been fired, it
must be reset manually by pressing a button before it will fire again.
Further details may be found in the author' s S. B. thesis.
J. T. Fairbanks
References
1.
See, for example, F. A. Webster and N. I. Durlach, "Echolocation Systems of the
Bat; Progress Report on Experimental Studies Conducted at F. A. Webster's
Labo-ratory (1 Nov. 1961 - 1 Sept. 1962)," Report 41G-3, Lincoln LaboLabo-ratory, M. I. T.,
1963; F. A. Webster, "Active Energy Radiating Systems: The Bat and Ultrasonic
Principles II; Acoustical Control of Airborne Interceptions by Bats," Proc. Inter.
Cong. on Tech. and Blindness, Vol. 1,49-135; 1963; F. A. Webster, "Bat-Type
Sig-nals and Some Implications," Chapter 25 in Bennet, Degan, and Spiegal (eds.),
Human Factors in Technology, McGraw-Hill, New York, 1963; F. A. Webster and
O.
G. Brazier, "Experimental Studies on Target Detection, Evaluation, and
Inter-ception by Echolocating Bats," AMRL-TR-65-172, Air Force Systems Command,
Wright-Patterson Air Force Base, Ohio, 1965.
3.
STIMULUS TIMER
A stimulus timer (CBL-45) has been constructed to provide timing pulses for a wide
variety of psychoacoustic experiments.
It has 9 dual independent pulse outputs for
stimulus control. One of the dual outputs is a positive 3-volt pulse with respect to ground at an impedance of 100 ohms, while the other output is a 60-volt negative pulse with respect to ground at an impedance of 1000 ohms. Each of 8 outputs can be varied in time, independently, with respect to the 9t h
output by means of 4 decade switches. The repetition period can be varied from 1 msec to 1000 seconds. Each of the 8 out-puts can be varied in time with respect to the 9t h
output in 0. 1-msec steps up to 1 sec, 1. 0-msec steps up to 10 sec, 10-msec steps up to 100 sec, and 100-msec steps up to 1000 seconds. This unit will replace a substantial number of Tektronix units (161 and 162) now being used for stimulus timing. Its primary advantage over the Tektronix equipment is that it is easier to operate, and thus reduces experimental "set-up" time.
W. F. Kelley D. CAPACITIVE- TRANSDUCER INSTRUMENT FOR MEASURING DISPLACEMENT
OF THE MIDDLE EAR IN ANIMALS
Several capacitive transducer systems have been developed for measuring vibra-1-5
tions in the middle ear. The measurement involves detection of the change in capac-itance between the vibrating part and the probe of the instrument. In one approach,3
the probe capacitance constitutes a series coupling impedance between a sinusoidal radiofrequency constant-voltage generator and the input of the measuring channel; the changing impedance causes amplitude modulation of the carrier signal. Other workers have used frequency modulation.2' 4, 5
The aim here is to compare the two capacitive-transducer methods and to describe an instrument based on the amplitude-modulation method.
When frequency modulation is used, the probe capacitance is part of the frequency-determining resonant circuit, so that the operating frequency is
f
(1)
2Tr NL(C + C)
where L is the inductance of the tank circuit, C is the probe capacitance, and C is the total remaining capacitance of the tank circuit, including the stray capacitance of the wiring. The sensitivity to changing probe capacitance is hence
dC
df 1 P
f
z2
+C"
(2)
p
A probe suitable for use on laboratory animals might have a tip, 1 mm in diameter, located 1/4 mm from the vibrating part. The value of C , with air as a dielectric, will
-2
P
'
then be 3 X 10 pF and its change, for vibrations of the ear of 100 A (that is, well below the threshold of pain), will be 1 X 10- 6
signal is in the VHF range so that the tank-circuit capacity will be relatively small (for example, 5 pF). With these assumptions, the measuring apparatus has to
discrim-df 1
inate f
-
7 which requires a rather elaborate device.10
For the amplitude-modulation method, the carrier-signal voltage amplitude at the input of the measuring channel is6
Vi. V wR
Cp,
(3)and the amplitude of modulation dVi , because of the change of the probe capacitance
dCp, is
dV. = Vo R dC , (4)
where V is the output amplitude of the carrier-signal generator, w is the angular fre-quency, and Ri is the input impedance of the measuring channel, assumed to be
resis-tive. The sensitivity depends on obtaining a low signal-to-noise ratio at the input of the measuring channel. This can be controlled by proper selection of the factors: Vo , W
and Ri, and by a special arrangement of the input stage. The inherent advantage of the
AM mode is that the sensitivity is proportional to the ratio of the change of the probe capacitance to its static value, dVi/Vi = dC p/Cp.
The design presented here differs from the previously developed instrument, mainly in two respects: (a) the sensitivity is increased so as to work with a smaller probe (diameter 1 mm) suitable for use in the middle ear of cats, and (b) a special ground arrangement was used to allow for grounding the animal. Experimental condi-tions with human temporal bones 3 allow the preparation to be kept floating with respect to radiofrequency potentials. In animal experiments, the animal is grounded or its
capacity to ground is so large that it presents, practically, a short circuit for the radio-frequency signals.
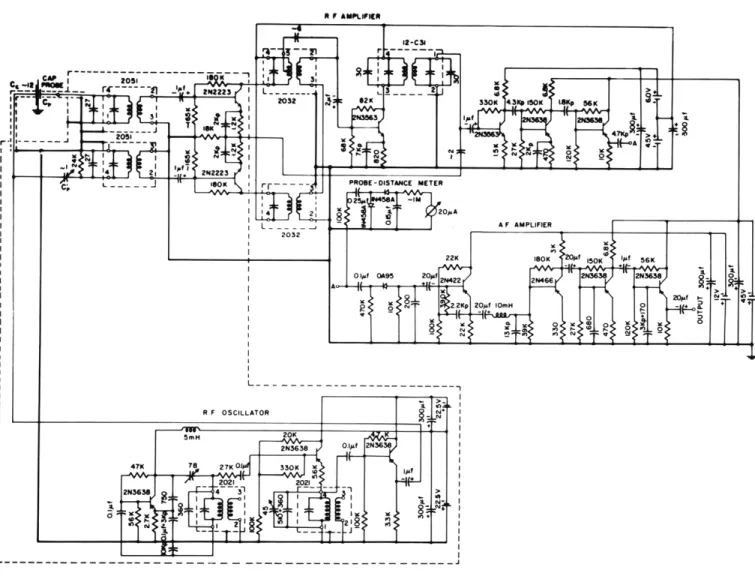
The sensitivity of the instrument might be increased (see Eq. 4) by raising the values of V , w, and/or Ri. Higher Vo and Ri produce greater carrier amplitudes in the input, and thus require a higher dynamic range of the radiofrequency amplifier. To avoid this difficulty, the carrier from the RF generator is delivered to both sides of a differential input of the RF amplifier (Fig. XXV-5). One input terminal receives the
signal through the probe capacitance Cp, the other through an adjustable trimmer C' set near the quiescent value of the probe capacitance. This arrangement cancels (to the desired extent) the in-phase carrier signals at the input of the RF amplifier, while the amplitude modulation that is introduced by the vibrations, appears in one side only. The differential input incorporates two IF filters, which were chosen to be of high input impedance, and to operate at 455 kc. As mentioned above, both the high impedance and high frequency serve to increase sensitivity. The narrow-band frequency characteristic
III--C I I 0201 -. - -, I f 2N l 3 . I 14 1 0 . ... 0 2N4O.f 2N3
- --- -- - - - R F OSCILLATOR - I ,F Il" A-PLIIER
Fig. XXV-5. Circuit diagram of the capacitive-probe vibration meter. The
grounded plate between the coupling capacitance C
cand the
of the filters is useful in avoiding distortion of the processed signal.
To neutralize the effect of grounding the animal, two independent common leads were
provided within the instrument network, and the carrier signal from the RF generator
is led to the animal through a coupling capacitance (Cc' 12 pF), which is much larger
that the probe capacitance C (Fig. XXV-5).
The input IF filters isolate the two
common leads from each other.
One common lead serves the RF generator and the
primary windings of the input-IF filters, the other serves the secondary input-IF
windings and the RF and AF amplifiers; the last common lead can be grounded.
Inevitably, perfect isolation between the common leads is not possible, but means are
available to cancel the influence of parasitic capacitances.
This is done by tuning the
coupling trimmer C' to bring the carrier signal in the RF amplifier to a given level,
pwhen the capacitive probe is not coupled to the vibrating surface.
Bringing the probe
closer to the vibrating surface causes, at first, decreasing carrier amplitude until, at
a small distance (preferably a few millimeters), a minimum is reached; from that
point on, the carrier amplitude rises in inverse proportion to the distance from the
probe to the vibrating surface.
Some characteristics of the performance of the instrument will be noted here.
The RF oscillator is a two stage Colpitts circuit. The third stage is an emitter
follower; it provides low output impedance for the constant-voltage generator.
The
operating frequency is 407, 830 cps; it remains stable within ±12 cps during 2 hours of
work. The voltage amplitude is 16 V; it remains constant, and the signal pattern
remains undistorted, for a lead at the terminals of the output coaxial cable of up to
~80 pF.
The RF amplifier presents a flat frequency characteristic (within 3 db, measured
through a series 10 MQ resistor) from 396. 5 kc up to 408. 5 kc.
The voltage gain at
406 kc is 42, the input impedance is 205 KQ.
The frequency passband of the amplifier
was fitted to allow passage of only one of the sidebands of the modulated carrier.
The output of the RF amplifier (A in Fig. XXV-5) is fed to two circuits: a network
monitoring the distance of the probe from the vibrating surface, and an audiofrequency
amplifier.
The probe-distance meter indicates the magnitude of the carrier signal in
the quiescent position of the measured part. The audio amplifier is driven by the
low-frequency component of the rectified amplitude-modulated carrier.
The frequency
characteristic of the audio amplifier is flat (within 3 db) in the range from 10 cps up to
15 kc.
The voltage gain is 70.
The last (emitter-follower) stage provides low output
impedance for convenience in displaying or recording the output signal.
Based on the data presented above, the inherent inaccuracy of the measuring
pro-cedure can be evaluated.
The probe capacitance is between two plates, one the probe
and the other the vibrating member of the ear. Thus (in accordance with Eq. 3) the
voltage (V
i) can be expressed in the form
1
V. = k .-x (5)
where k is a constant, and x is the distance between the probe and the vibrating sur-face. This hyperbolic dependence causes nonlinear distortion of the modulation enve-lope. As a figure of merit, consider the ratio of modulation amplitude in one (positive) direction AV! with respect to the other (negative) direction AVi'. For the changes of
11
distance ±Ax, this figure is AV [
1 x +AX (6)
AV!' - x - Ax 1
The deviation from the condition of linearity AV!/AVt'= 1, for
xl << x, is
D = 1
1
ZAx
(7)
1
For x = 0. 2 mm and Ax 1 micron, the deviation from linearity is 1 per cent.
With reference to possible effects of the carrier potentials appearing between the "plates" of the probe capacitance, the following matters should be noted. The carrier voltages are much too low to cause dielectric breakdown problems. Also the carrier frequency is far beyond the response range of the mechanical system of the ear, so there should not be any appreciable interference with the response to audio frequencies resulting from the electrostatic forces between the "plates."
A preliminary experiment was carried out on a cat. The ear of the cat was stim-ulated by a 1000-Hz signal; vibrations of the malleus were measured at moderate sound level.
H. Fischler
References
1. G. von B6k6sy, "iber die Messung der Schwingungsamplitude der Geh6rkn6chelchen mittels einer kapazitiven Sonde," Akust. Z. 6, 1-16 (1941).
2. I. Kirikae, The Structure and Function of the Middle Ear (University of Tokyo Press, Tokyo, Japan, 1960).
3. H. Fischler, E. H. Frei, M. Rubinstein and D. Spira, "Measurement of Sound Transmission in the Middle Ear, " Fifth International Conference on Medical Elec-tronics, University of Li6ge, Li6ge, Belgium, 1963, pp. 436-447.
4. A. R. MOller, "Transfer Function of the Middle Ear," J. Acoust. Soc. Am. 35, 1526-1534 (1963).
5.
L. O. Hoeft, G. Ackerman and A. Anthony, "Measurement of the Displacements
and Nonlinearities of the Guinea-Pig Tympanum," J. Acoust. Soc. Am. 36,
1836-1844 (1964).E. ELECTRICAL IMPEDANCE MEASUREMENTS ON CHICK CEREBRAL CORTEX IN CULTURE
1. Introduction
Electrical impedance measurements on animal tissue have been carried out for a variety of reasons1 and vary from gross limb-to-limb measurements to relatively microscopic measurements on nerve-cell membranes. The use of impedance measure-ments, both in a clinical environment and in research to obtain information about tissue function and structure, has been plagued chiefly by two problems. One is electrode phenomena, and the other is the conglomerate result of the measurement. An example of the latter is the measurement of blood impedance with the electrodes placed on the arm. The measurement combines the impedance of several layers of tissue with that of the blood, possibly obscuring the desired information.
On the other hand, impedance measurement has an advantage of simplicity (provided the problems of electrode surface phenomena are avoided), often requiring no puncture,
sampling or other alteration of the tissue. This advantage is important in research because the measurement need not terminate an experiment, as a histological examina-tion or a chemical analysis might. The disadvantage of the conglomerate effect can sometimes be avoided by employing a wide frequency range in the measurement. It is then often possible to separate out the required information. The electrode surface problems can also be avoided or minimized by various methods.2 A four-electrode
technique for accomplishing this is discussed in the appendix.
The purpose of the present work is to relate impedance data, taken over the fre-quency range 5 Hz-200 kHz, to a structural model of tissue explants from embryonic chicken cortex. This provides a tool yielding information about the tissue structure during the course of an experiment, and, additionally, we hope that the results of the impedance measurements will have more general implications regarding the structure of nervous tissue. The structure that we refer to here includes nothing below the level of the gross structure of a cell. It is characterized by cell membrane capacities and
resistances, the resistances of the extracellular and intracellular fluids, the volume densities of the various populations of cells and the cell shapes. There are many com-binations of these parameters that might fit the impedance data, so that it is convenient to restrict the range of values to initiate the analysis. Fortunately, these quantities have been extensively discussed, and, under the assumption that the chicken embryo nervous tissue does not quantitatively differ too widely from that of the other more generally studied animals, a preliminary analysis of the data shows them to be consis-tent with the range of the reported values. A more complete analysis is awaiting his-tological studies of the tissue.
2. Tissue Explant and Chamber
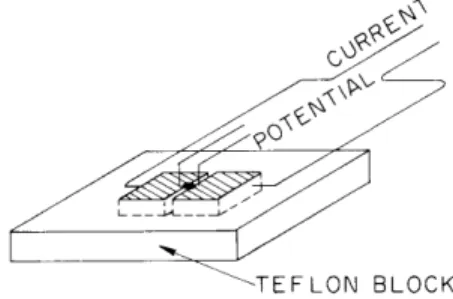
The tissue studied is excised from the telencephalic area of the cerebral cortex of 14-day chicken embryos. An explant is 1-4 mm3 in volume, and is sliced from the cortex surface with its base broader than its height. At this age, differentia-tion is complete and we are dealing with cells that are probably much as they are in the adult chicken. The general method of culturing these samples and the spontaneous elec--TEFLON BLOCK
trical potentials that are recorded have Fig. XXV-6. Split-block chamber. Tissue been reported on previously.3 The
lies in the center and bridges
the two sintered-glass blocks, chamber used for the impedance mea-surements differs from the chambers usually employed, in that it has two (rather than one) sintered-glass blocks elec-trically insulated from each other with the tissue bridging the two (see Fig. XXV-6).
Recordings of the spontaneous potentials from the tissue are made by con-necting to the current electrodes. A typical DC recording is shown in Fig. XXV-7.
F
---I[ 5E 5
I
I
II L
Fig. XXV-7. Typical spontaneous potential recorded from the current electrodes of the chamber in Fig. XXV-6. The lower tracing presents a portion of a sequence like the one in the upper trace in an expanded time scale.
The recordings compare in form with those made on previous occasions with
microelec-trodes and also with gross electrode recordings (AC) if the slow shift in the base line is
deleted.
The amplitudes recorded in this way are 5-10 times that of those reported
from gross electrodes.
The reason for this is that the split-block arrangement shown
in Fig. XXV-6 avoids the considerable amount of current shunting through the
sintered-glass block and fluid reservoir occurring in the single-block chambers.
3.
Model and Analysis
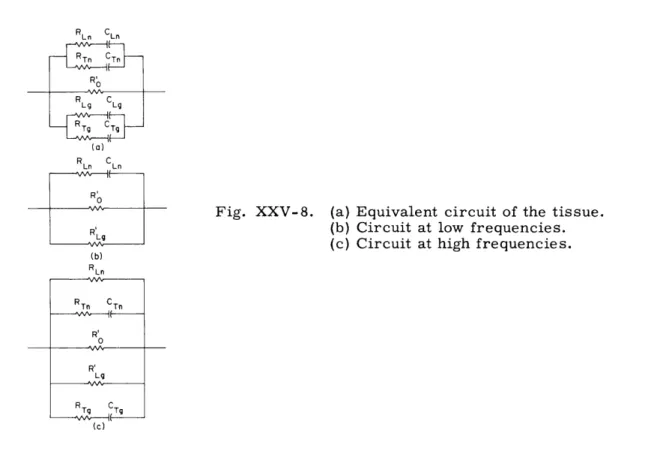
The model assumed for the tissue explant follows the work of Ranck,
and details
are given in his paper. An equivalent circuit for the tissue based on this model is
shown in Fig. XXV-8a.
R' represents the path through the extracellular fluid and each
0RLn CLn RTn CTn R C RLg Lg RTg CTh (a) RLn CLn Ro
Fig. XXV-8.
(a) Equivalent circuit of the tissue.
R,
(b) Circuit at low frequencies.
(c) Circuit at high frequencies.
(b) RLn RTn CTn RI R' Lg R C (c)
series R-C branch,
a path involving cellular membranes.
The model takes into
account fibers of neuronal and glial cells that are either transverse or longitudinal
to the current-flow direction. The subscripts L and T refer to longitudinal and
transverse, respectively, and the second subscripts n and g, to neuronal and glial.
An R-C branch represents the combination of the membrane and intracellular fluid,
so that R and C are both frequency-dependent.
Only R' is frequency-independent, in
ogeneral. Because of the low membrane resistance of the glial fibers, however, the
longitudinal glia can be reduced to a frequency-independent resistance, RLg, over
the range of frequencies investigated.
The circuit of Fig. XXV-8a can be considered in a low-frequency version,
Fig. XXV-8b, and a high-frequency version, Fig. XXV-8c, which greatly simplifies the
analysis.
As indicated in this figure, the variation at low frequencies is governed by
the longitudinal neurons in parallel with the frequency-independent
R'
and
RLg,
and the
high-frequency variation by the transverse fibers of both cell populations in parallel
with R Ln R' and R'Ln
o
Lg
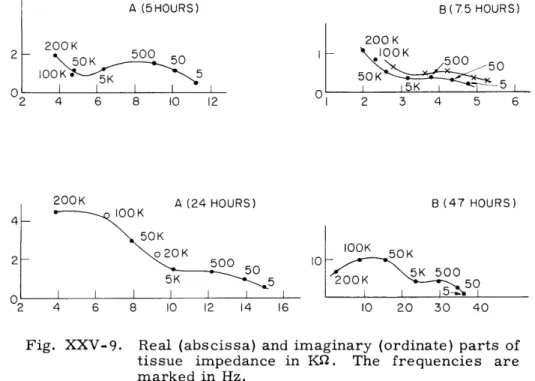
Figure XXV-9 shows the real and imaginary parts of the tissue impedance for two
I A (5HOURS) B(75 HOURS) 200 K 200 K S 50K 50 I lOOK lOK 5 50K I I I 1 75K 50 O 2 4 6 8 10 12 200K A (24 HOURS) 4 -lOOK 50K 020K 2 - 2K 500 50 2 4 6 8 10 12 14 16 I 2 3 4 5 6 B (47 HOURS) lOOK 50K 10 0 50 105 50 10 20 30 40
Fig. XXV-9.
Real (abscissa) and imaginary (ordinate) parts of
tissue impedance in
K2.
The frequencies are
marked in Hz.
samples at two different times after excision, as noted.
The analysis for the
longitu-dinal fibers is made by solving the cable equation, subject to a constant-gradient
sinu-soidal potential in the external fluid (see Ranck
4for details). The result of this analysis
is a loop in the impedance plane similar to the low-frequency loops shown in Fig. XXV-9.
The data loop can be matched with the calculated loop at the zero- and infinite-frequency
points and at the point of maximum reactance.
The high-frequency loop, attributed to the presence of transverse fibers, can be
analyzed by considering an expression of the Maxwell variety for a suspension of
trans-verse cylinders in a conducting medium. Again, the calculated and experimental loops
are matched, although, in this case, the experimental loop is not complete at the
highest frequency (200 kHz) that was used.
of the parameters involved.
Under the assumption that the tissue sample bridging the
two sintered-glass blocks roughly forms a segment of an annulus, the specific
imped-ance for several samples varies in the range 200-700 ohm-cm for a fresh sample (up
to 7 hours after excision) at 500 Hz.
With some of Ranck's calculations for the rabbit
cortex employed in this preliminary analysis, the membrane time constant comes to
8 msec, which yields a membrane capacitance of 2. 7 pLf/cm
2for a membrane
resis-tance of 3 X
103
ohm-cm
2 .The volume density of neurons is calculated to be 0. 6. The
high-frequency loop yields further information, although nothing further will be reported
here, except to say that the gross aspects of the loop are consistent with the analysis.
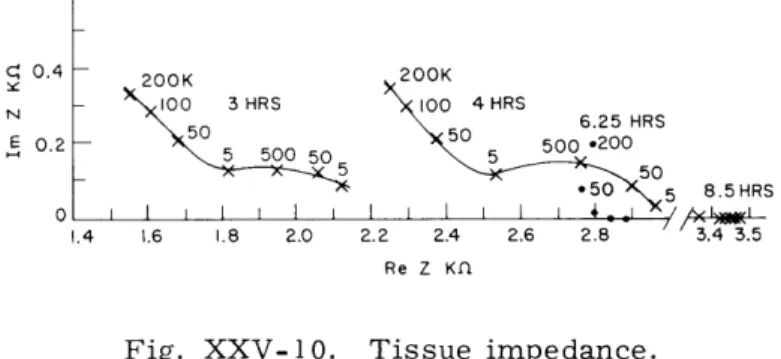
Figure XXV-10 shows the impedance of an explant inexpertly excised and handled so
C' 0.4 200K N 100 3HRS 0 4HRS 520 6.25 HRS E 0.2 50 50 500 .200 5 _55 50 ,50 5 8.5HRS 0 I I I I I I I 1 I I 1 - 4 , / < y._ I 1.4 1.6 1.8 2.0 2.2 2.4 2.6 2.8 3.4 3.5 Re Z Kfl
Fig. XXV-10.
Tissue impedance.
that the culture did not
"take."
The impedance was measured at the times indicated
after excision and, although it initially exhibits the usual double dispersion, it proceeds
towards the real axis after a few hours, finally becoming completely resistive. This
is believed to demonstrate cellular breakdown over this period of time; that is, as the
cellular structures either break down or become permeable to the ions involved, the
tissue exhibits the resistive character of an electrolyte.
Spontaneous signals like those
of Fig. XXV-7 were not observed from this tissue. On several occasions the
disappear-ance of the spontaneous activity was observed to be accompanied by the disappeardisappear-ance
of the loop structure in the impedance.
The model and analysis referred to above serve as a preliminary step in this
inves-tigation.
The next steps already in progress are morphological studies of the tissue
samples and more critical evaluation, and consequent improvement, of certain aspects
of the model.
Appendix.
Four-Terminal Bridge Impedance Measurement
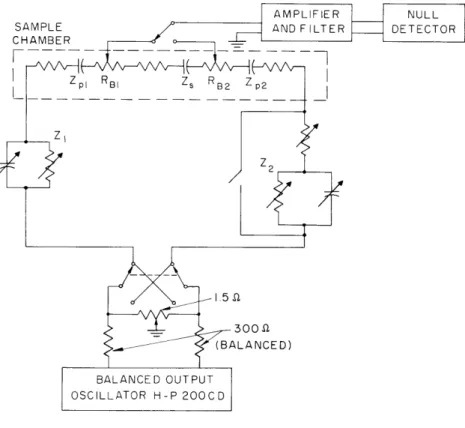
5The circuit for the bridge employed in the course of these measurements is shown
in Fig. XXV-11.
Care was exercised in keeping the termination balanced with respect
to ground, and a final amplitude balance is afforded by a movable tap on the 1. 5-ohm
resistor (a 3-cm piece of nichrome wire).
The portion of the circuit within the dashed
AMPLIFIER NULL
SAMPLE AND FILTER DETECTOR
CHAMBER
Zp BI Zs RB2 Z
300 ~
BALANCED OUTPUT OSCILLATOR H-P 200CD
Fig. XXV-11. Four-terminal bridge.
lines is the combined equivalent circuit of the tissue sample (Zs), the fluid-filled sintered-glass blocks (Rbl and Rb2 ), and the metal-electrode-fluid junctions of the cur-rent electrodes (Zpl and Zp2). The potential electrodes rest on the sintered-glass blocks adjacent to the tissue. (Refer also to Fig. XXV-6.)
Two balances are required to obtain the tissue impedance. In the initial balance, Z2 = 0 (the shorting switch is closed) and Z1 is adjusted for a null at the left-hand
poten-tial electrode. Thus,
Z 1 1 +Z pl +R b1 = Z s +R b2 + Zp2"
There is a small error caused by the portion of Rbl lying between the potential elec-trode and the tissue, but this is neglected. By allowing Z1 to remain unchanged, the
second balance is made by adjusting Z2 for a null at the other potential electrode. Then
Z +Z + Rbl + Zs = Rb2 +Z + Z2 ,
and combining the two balance conditions yields
Hence, the effects of the current-electrode impedances are avoided by employing two balances. Additionally, errors attributable to the potential-electrode impedances are
avoided because each is nulled when in use.
The effects of other errors in the measurements, especially at the high-frequency end, have been assessed. One major cause of error is unbalance of the generator out-put. If this unbalance is small, however, the resulting error can be largely corrected by performing a second measurement with the generator output reversed and averaging the two. Stray capacitance is another source of error, and this has been minimized by the use of the very low value of driving resistance (1. 5 ohm).
G. F. Songster, R. R. Rojas-Corona, A. W. B. Cunningham
References
1. L. A. Geddes, "The Transduction of Physiological Events," Chapter Z in Advances in Bioengineering and Instrumentation, Fred Alt (ed.) (Plenum Press, New York, 1966).
2. H. P. Schwan, "Determination of Biological Impedances," Chapter 6 in Physical Techniques in Biological Research 6, W. L. Nastuk (ed.) (Academic Press, New York, 1963).
3. A. W. B. Cunningham, "Qualitative Behavior of Spontaneous Potentials from Explants of 15-day Chick Embryo Telencephalon in vitro," J. Gen. Physiol. 45, 1074 (1962).
4. J. B. Ranck, "Specific Impedance of Rabbit Cerebral Cortex," and "Analysis of Specific Impedance of Rabbit Cerebral Cortex," J. Extpl. Neurol. 7, 144-174 (1963). 5. P. H. Hill, Personal communication in which the four-terminal bridge
configura-tion was suggested.
F. CENTRAL ORIGIN OF ASYMMETRY IN THE CAROTID SINUS REFLEX
It is known that the carotid sinus reflex mechanism brings forth asymmetrical responses for rising and falling blood pressures. One manifestation of these asym-metrical responses is that a rise in blood pressure is more effective in slowing the heart than a similar drop in blood pressure in accelerating it. 1 Although the nonlinear
characteristics of the pressure receptors and the heart contribute to this asymmetry, it has been suggested that these characteristics alone are not sufficient to account for all the asymmetry in the heart response. This report presents direct evidence that the input-output characteristics of the vasomotor center also contribute to the asymmetry in the heart-rate response.
The activity of cardiac vagal efferent fibers was recorded during short transient disturbances in the arterial blood pressure of chloralose-anaesthetized dogs. These disturbances were introduced either by the injection of Levophed, or by inflating and then deflating a balloon that had been placed into the abdominal aorta of the experimental
200
MMHG
100
-- 3 SEC --- .. 3 SEC
Fig. XXV-12.
Single-fiber cardiac vagal efferent recording. Upper:
blood pressure.
Lower: nerve firing.
Left: records
obtained during a rise in pressure level, caused by
the inflation of a balloon in the abdominal aorta. Right:
records obtained during a fall in pressure level, caused
by the deflation of the balloon. Elapsed time between
inflation and deflation, 5 sec.
animal. The cardiac efferent fibers were dissected from the trunk of the cervical vagus,
and they were identified on the basis of their firing pattern, as described by Jewett.Z
Figure XXV-12 shows the firing of a typical cardiac vagal efferent fiber during
sud-den changes of blood pressure.
While the response to the rise in pressure level
fol-lowing the inflation of the balloon is evident in approximately 100 msec, there is a delay
of approximately 300 msec before the response to the rapidly falling pressure after the
deflation of the balloon commences.
Firing continues for almost a full beat after the
precipitous drop in the pressure. In contrast, the afferent activity of the pressure
receptors show an essentially instantaneous response both to rising and falling blood
pressures as a result of the rate-sensitivity of these receptors.
3The findings,
there-fore, indicate that the time delay before a change in baroreceptor firing affects vagal
efferent firing is larger for decreasing than for increasing pressures.
Occasionally, vagal fibers have such a high threshold under the studied
experi-mental conditions,
that they fire only when the pressure is elevated, as shown in
Fig. XXV-13. These fibers can exhibit a very pronounced asymmetry in their response
to rising and falling pressures.
Figure XXV-14 shows the changes in vagal activity of
a multi-fiber vagal preparation during a transient pressure disturbance. The firing
frequency increased while the pressure level was climbing, but then it gradually
decreased to its original value. No change in firing frequency occurred when the
pres-sure suddenly decreased as a result of deflating the balloon, although the decrease in
pressure did initiate a heart-rate response.
This response was probably mediated
predominantly by the sympathetic nerves.
Since the vagus nerves are more effective
100
Fig. XXV-13.
Threshold for vagal activity.
Upper: blood pressure during a
s h o r t inflation of the balloon.
Lower: nerve firing. Vagal
ac-tivity (considering the fiber
giv-ing the largest spike amplitude)
is present only as a result of the
elevated pressure.
-
6
SEC
135 MMHG 60 600 MSEC 300an
1
20 SECFig. XXV-14.
Vagal activity and heart period during a rise and fall of
blood pressure. From top to bottom: systolic pressure,
diastolic pressure, heart period, and vagal activity. The
record was obtained with the aid of a digital computer; all
four quantities were computed and displayed on a
beat-by-beat basis.
Heart period was computed as the time
inter-val between neighboring QRS complexes in the
electro-cardiogram. Vagal activity was measured as the number
of firings in each heart beat within a 320-msec interval
following the QRS complex.
than the sympathetic ones in causing rapid changes in the speed of the heart, 1,4 the asymmetry in the vagal firing frequency for rising and falling pressures resulted in a marked asymmetry in the heart-rate response.
The decrease of vagal firing during the elevated pressure level may have been caused by the adaptation of the baroreceptors, coupled with a threshold for introducing changes in the vagal firing frequency. This could account for the observed behavior shown in Fig. XXV-14. It only need be assumed that in the multi-fiber preparation one or more high-threshold cardiac efferent fibers were among other types of fibers that did not change their firing frequency as a result of blood-pressure changes. (Fibers of this type in the trunk of the cervical vagus have been described.2) Adaption of the vagus center, the possibility of which has been suggested by Wang and Borison,4 may
also have been a factor in producing the decreasing firing frequency indicated in Fig. XXV-14.
The technical help of Messrs. Nicholas Pantelakis, Brian S. Terry, and James W. Poitras was invaluable in obtaining the nerve recordings.
P. G. Katona
References
1. P. G. Katona, "Computer Simulation of the Blood Pressure Control of Heart Period," Sc.D. Thesis, Department of Electrical Engineering, M. I. T., June 1965.
2. D. L. Jewett, "Activity of Single Efferent Fibres in the Cervical Vagus Nerve of the Dog with Special Reference to Possible Cardio-inhibitory Fibres," J. Physiol. 175, 321 (1964).
3. S. Landgren, "On the Excitation Mechanism of the Carotid Baroreceptors," Acta Physiol. Scand. 26, 1 (1952).
4. S. C. Wang and H. L. Borison, "An Analysis of the Carotid Sinus Cardiovascular Reflex Mechanism," Am. J. Physiol. 150, 712 (1947).