Publisher’s version / Version de l'éditeur:
Vous avez des questions? Nous pouvons vous aider. Pour communiquer directement avec un auteur, consultez la première page de la revue dans laquelle son article a été publié afin de trouver ses coordonnées. Si vous n’arrivez pas à les repérer, communiquez avec nous à [email protected].
Questions? Contact the NRC Publications Archive team at
[email protected]. If you wish to email the authors directly, please see the first page of the publication for their contact information.
https://publications-cnrc.canada.ca/fra/droits
L’accès à ce site Web et l’utilisation de son contenu sont assujettis aux conditions présentées dans le site LISEZ CES CONDITIONS ATTENTIVEMENT AVANT D’UTILISER CE SITE WEB.
Research Report (National Research Council of Canada. Institute for Research in
Construction), 2011-03-31
READ THESE TERMS AND CONDITIONS CAREFULLY BEFORE USING THIS WEBSITE.
https://nrc-publications.canada.ca/eng/copyright
NRC Publications Archive Record / Notice des Archives des publications du CNRC : https://nrc-publications.canada.ca/eng/view/object/?id=f7e6092b-4802-4f17-b188-3c4ebff4a72d https://publications-cnrc.canada.ca/fra/voir/objet/?id=f7e6092b-4802-4f17-b188-3c4ebff4a72d
NRC Publications Archive
Archives des publications du CNRC
For the publisher’s version, please access the DOI link below./ Pour consulter la version de l’éditeur, utilisez le lien DOI ci-dessous.
https://doi.org/10.4224/20374012
Access and use of this website and the material on it are subject to the Terms and Conditions set forth at
Development of a Speech Security Quick Test and Software
http://www.nrc-cnrc.gc.ca/irc
De ve lopm e nt of a Spe e c h Se c urit y Quic k T e st a nd Soft w a re
I R C - R R - 3 1 3
B r a d l e y , J . S . ; G o v e r , B . N .
M a r c h 2 0 1 1
The material in this document is covered by the provisions of the Copyright Act, by Canadian laws, policies, regulations and international agreements. Such provisions serve to identify the information source and, in specific instances, to prohibit reproduction of materials without
written permission. For more information visit http://laws.justice.gc.ca/en/showtdm/cs/C-42
Les renseignements dans ce document sont protégés par la Loi sur le droit d'auteur, par les lois, les politiques et les règlements du Canada et des accords internationaux. Ces dispositions permettent d'identifier la source de l'information et, dans certains cas, d'interdire la copie de
Development of a Speech Security Quick Test
and Software
J.S. Bradley and B.N Gover
IRC Report RR‐313
31 March 2011
DRAFT COPY B3487.1 ‐ 1
Acknowledgements
This research was jointly funded by the Royal Canadian Mounted Police (RCMP), Public Works and Government Services Canada (PWGSC) and the National Research Council, Institute for Research in Construction (NRC‐IRC).Extended Summary
Precise methods of assessing the speech privacy of enclosed rooms are required to ensure the security of conversations held in particular rooms. Considerable previous research has shown that the speech privacy of a particular room is related to the sum of the ambient noise level (Ln(avg)) at a receiver position in adjacent spaces and the level difference of transmitted speech sounds (LD(avg)) between the source room and the same receiver positions in adjacent spaces. The sum of these two quantities is referred to as the Speech Privacy Class (SPC). SPC = Ln(avg) +LD(avg) (1) Arithmetic averaging of the decibel values over the speech frequencies from 160 to 5000 Hz is implied by the ‘(avg)’ symbols. This simple method of combining the effect of different frequencies of sounds has been shown to lead to measures that best predict the degree of speech privacy. The ASTM E2638 measurement standard describes a comprehensive test for evaluating the speech privacy of an enclosed room. This test is referred to as the Full Speech Security Tests in this report (FSST). It specifies how to measure the quantities in the above equation. The Level Differences (LD(avg)) are measured as the difference between the average level of test sounds from several loudspeaker positions in the room being evaluated and the transmitted levels at test points usually 0.25 m from the outside of the room. Although this results in quite accurate evaluations of the speech privacy provided by the room, the process is somewhat time consuming. There are many situations when a simpler more efficient test would be preferred. These could include verifying that modifications to doors and door seals have been successful without re‐testing the entire room. However, the more efficient test must provide measured values that can be used to predict the results of the FSST reasonably accurately. The purpose of this new work is to evaluate methods of performing a ‘Quick Test’ (QT) that would more quickly provide results that could be used to accurately predict FSST results. Figure A. Details of Quick Test source and 1.2 m 1.0 m 0.25 m test wall microphone loudspeaker The concept of the Quick Test is to measure level differences from a source in the test room located 1 m from the test wall and a microphone located 0.25 m from the other side of the wall in the adjacent space. This Quick Test set up is illustrated in Figure A. Previous research investigated the effects of the height of the loudspeaker and its distance from the test wall and determined the procedure illustrated in Figure A to be appropriate. Further investigations in this report included determining how best to evaluate the source level to use in the calculations of level differences. A previous investigation used the level 1 m from the source in a free field, which ideally requires access to an anechoic room. This is difficult to measure and does not include the effects of reflected sound in the test room. Two methods of determining the level of the source in the actual test room were evaluated along with the previousanechoic room. This report includes the results of systematic comparisons of FSST, QT and standard transmission loss (TL) measurements for the 9 combinations of 3 wall constructions and 3 amounts of room sound absorption. For each case, transmitted sound levels were measured at 9 positions along the test walls. All measurements were repeated for two types of test loudspeaker source: one omni‐directional (OMNI) and the other directional (DIREC). For the QT measurements source levels were determined: by direct measurement at several positions in the source room, by calculations from measurements of the sound power output of the source, and as previously considered, at a distance of 1 m in a free field. Two types of QT measurements were made: one using steady state white noise and the other using the new measurement software that calculates level differences from impulse response measurements. The latter is potentially more efficient and can provide complete answers while on site to make problem solving more rapid. The impulse response technique also can enhance signal‐to‐noise ratios without having to use such loud test sounds as are required for tests using white noise. The results showed the OMNI source to be the better choice for measuring level differences that can be used to more accurately relate to standard TL test results and to FSST results. Figure B shows how the differences between QT measurements of LD(avg) values and TL(avg) values vary with changing room absorption as predicted by reverberant sound levels when an OMNI source is used. These results show very little scatter about the best fit line and show an almost constant difference for the more common conditions in typical office buildings when an OMNI source is used. The QT results obtained using the OMNI source were also found to be accurate predictors of FSST results. Figure C compares measured FSST LD(f) values plotted versus frequency with adjusted QT results, which are seen to agree well for the quite different cases of Wall02 and Wall03 (with mock door) results. ‐6.0 ‐5.0 ‐4.0 ‐3.0 ‐2.0 ‐1.0 0.0 ‐14.0 ‐13.0 ‐12.0 ‐11.0 ‐10.0 ‐9.0 ‐8.0 ‐7.0 ‐6.0 ‐5.0 ‐4.0 LD (a vg )‐ TL (a v g ) dif fe re n ce , dB 10log{4/A}, dB <‐ More typical conditions in office buildings ‐>
<‐ More absorption Less absorption ‐>
Figure B. LD(avg) –TL(avg) differences from Quick Test and transmission loss measurements of the 9 experimental conditions, using the OMNI source, plotted versus the reverberant sound level, (10log{4/A}), to indicate the effects of varied room absorption.
125 250 500 1000 2000 4000 10 20 30 40 50 60 LD(f ), dB Frequency, Hz FSST Wall02 QT Wall02 FSST Wall03 QT Wall03 Figure C. Comparison of LD(f) versus frequency for FSST and QT results for the Wall02‐HF and Wall03‐HF conditions at microphone position #5 using the OMNI source. Comparisons between QT measurement results using conventional steady state white noise signals and those using impulse response techniques agreed very closely. The new procedure and the new software provide successful tools for more efficiently assessing the speech security of enclosed rooms.
DRAFT COPY B3487.1 ‐ 5
Table
of
Contents
page
Acknowledgements
1
Extended
Summary
2
Table
of
Contents
5
A.
Introduction
6
B. Experimental Evaluations of Quick Test Procedure
9
Experimental
Details
9
Description of Systematic Measurements
11
Analyses of the Results of the Systematic Measurements
21
(a) The relationships between FSST LD(f) values and TL(f) values
21
(b) The relationships between FSST results and QT results
24
(c) The relationships between the QT results and TL values
29
(d) Variation of FSST and QT results with position along the walls
33
C. New Quick Test Measurement Software
38
Description
of
the
Quick
Test
Software
38
(a) New
⅓-octave
band
filter
routine
38
(b) Obtaining and verifying adequate signal-to-noise in QT measurements 39
(c) Comparisons of LD(f) values using QT software with those using white
noise
42
D.
Discussion
and
Conclusions
49
(a) Summary of systematic measurements
49
(b) Conclusions
51
References
53
A. Introduction
Previous studies [1‐6] have developed a new speech security assessment procedure for measuring the speech privacy of closed rooms [7]. The new method, referred to as the Full Speech Security Tests (FSST) in this report, is different than the standard sound transmission loss tests between rooms [8]. As illustrated in Figure 1(a), a conventional sound transmission loss (TL) test measures room‐average levels of a test sound using multiple loudspeaker positions in the source room and multiple microphone positions in both the source and receiving rooms. With the addition of reverberation time measurements in the receiving space, the average sound transmission loss between the two spaces can be calculated. A similar procedure is used in standard laboratory tests [9] of wall sound transmission characteristics from which sound transmission class (STC) ratings can be determined. The new speech privacy test [7] measures the attenuation of speech sounds in terms of the level differences between an average source room level and the levels at spot receiver positions 0.25 m from the separating wall in the receiving space (see Figure 1(b)). A room average is used in the source room because the talker could be anywhere in the source room. The receiver is located at positions 0.25 m from the test wall because: (a) these represent more sensitive positions for eavesdroppers without being too sensitive to errors in the microphone position, (b) they don’t require the receiving space to have a diffuse field, and (c) they make it possible to measure variations in the attenuation of speech sounds to detect weak points in the sound insulation such as near doors. Figure 1. Comparison of measurement approaches for: (a) conventional transmission loss test[8], (b) new speech privacy test [7], and (c) proposed Speech Privacy Quick Test.(a) Transmission loss test (TL)
(b) Full Speech Security Test (FSST)
(c) Speech privacy Quick Test (QT)
Source room Receiving room
Spot receivers The new FSST can more accurately assess the speech privacy afforded by a closed room than can a conventional TL test. However, for the most accurate results, it can be time consuming. In some cases, a less comprehensive test would be adequate. For example, the speech privacy of most meeting rooms is limited by sound leaks through doors and door seals. There is often no need to precisely evaluate the complete room until the problem of the door can be rectified. Alternatively, if a room has been evaluated and a door found to be a problem, it is desirable to be able to quickly evaluate improvements to the door without retesting the complete room. Source room Source room Receiving room Receiving room Spot receivers
(QT) measures attenuations between a loudspeaker 1 m from one side of a wall to a measurement point 0.25 m from the other side of the wall or other type of separating element (see Figure 1(c) and Figure 2). The output of the test loudspeaker would first be measured and then this same level of the test signal would be used as the source level in the measurements of sound transmission through the element to be tested, and the transmitted levels would be measured 0.25 m from the element in the receiving space. Several methods for determining the source levels are evaluated in this report. A previous study [10] established that the proposed QT procedure was a viable option and explored the effects of a number of variables on the FSST and QT results. As in this study variables were investigated for a number of different wall constructions and varied room absorption. The measured level differences (LD(f) and LD(avg)) from FSST measurements were found to vary with variations in the total sound absorption in the room being evaluated. However, for the FSST procedure the measured LD(f) and LD(avg) values using an omni‐directional source (OMNI) and those using a directional source (DIREC) were very similar. In the previous work, the positions of the sound source and the measuring microphone, when making QT measurements, were extensively varied and evaluated for combinations of wall construction and room absorption. Positioning the source 1.0 m from the test wall and the microphone 0.25 m from the other side of the wall in the receiving space was found to be a suitable combination for QT measurements. Figure 2 illustrates this geometry with the microphone directly opposite the sound source for each QT measurement. The height of the source and receiver was not found to have a significant effect and in the current new measurements was fixed at 1.2 m above the base of the test wall. Figure 2. Details of Quick Test source and receiver positions relative to the test wall. 1.2 m 1.0 m 0.25 m test wall microphone loudspeaker There were differences between the FSST and QT measurement results that varied with room absorption and source type and these differences varied with frequency. Differences in LD(avg) values from the QT and FSST results could be as much as 7 dB but it was possible to make reasonable predictions of FSST test results from QT measurements. The large differences between the two methods were influenced by the choice of reference sound level for the QT measurements in the initial study [10]. The source output was characterised by the free field levels of each source. These were measured on‐axis, at a distance of 1 m from the source in an anechoic room. In the current new work the merits of other reference levels for the output of the QT sound source were investigated. These were two different estimates of the total sound levels of the test source at a distance of 1.0 m from the source in the source room of the QT measurements. This would be a more practical measurement to assess the source levels and leads to QT results that are more similar to the corresponding FSST results. The previous study made an initial confirmation that one could use impulse response techniques [11] to measure the required attenuations of walls to accurately obtain the required LD(f) values. The new work in this report included developing measurement software based on the previously developed SPMSoft program [12, 13] that was intended to measure speech privacy in open‐plan offices. The results of evaluations of the Quick Test software are included in this report. Using an impulse response technique DRAFT COPY B3487.1 ‐ 7
allows one to accurately evaluate high LD(f) values without excessively loud test sounds and can be a very successful approach for field measurements. The amount of equipment required and the need for external processing is minimized and results can be obtained instantly while on site, making it easier to diagnose acoustical problems. This report includes two main parts. The first part reports on the experimental evaluation of Quick Test measurement procedures from the results of a series of systematic measurements of sound transmission through 3 different walls in controlled but variable conditions with 3 different amounts of room sound absorption. The second part describes the new Quick Test measurement software and compares measurement results using the new software to results from more conventional measurements of the same constructions.
DRAFT COPY B3487.1 ‐ 9
B. Experimental Evaluation of Quick Test Procedure
Experimental Details
A large series of systematic measurements were made of sound transmission for the 9 combinations of 3 walls and 3 different amounts of room absorption. Extensive sound transmission measurements of all of the 9 conditions were made using: standard sound transmission loss (TL) tests, Full Speech Security Tests (FSST) and several variations of the speech security Quick Test (QT). Table 1 summarises the various tests that were performed on each of the 9 test conditions.Test Variations Source
TL (Transmission Loss) Both directions Chamber system
FSST (Full Speech Security Test) None OMNI
“ None DIREC
QT (Quick Speech Security Test) Re Measured source levels OMNI
“ “ DIREC “ Re source levels from sound power OMNI “ “ DIREC “ RE direct sound source levels OMNI “ “ DIREC Table 1. Summary of the various tests performed for each of the 9 conditions. The experimental studies in this report were carried out in the wall sound transmission loss suite in Building M27 of NRC‐IRC. This consists of two reverberation chambers with a large, 3.66 by 2.44 m (12’ by 8’) opening between them into which walls can be constructed to measure their sound transmission
characteristics. The large chamber has a volume of 250 m3 and the small chamber a volume of 140 m3. Walls
are constructed in massive test frames that can be rolled into place between the two chambers and sealed in place with pneumatic seals. For standard sound transmission loss tests, each reverberation chamber includes 4 loudspeakers for producing test sounds driven by independent noise generators. There is also a robot microphone system in each chamber so that the microphone can be moved automatically under computer control to each measurement position. For standard sound transmission loss tests carried out according to the ASTM E90 procedure [9], sound levels are measured at 9 independent positions in each chamber and level differences between the source and receiving room averages calculated. After also measuring reverberation times in the receiving room, sound transmission loss (TL) values are calculated in ⅓‐octave bands from 50 Hz to 6.3 kHz. Sound transmission class (STC) ratings are derived from these laboratory sound transmission loss values. In addition to the sound transmission loss tests, two types of speech security test were carried out for each of the 9 conditions using both an omni‐directional source (OMNI) and a directional loudspeaker source (DIREC). The directional characteristics of the two sources are described in Appendix I. The Full Speech Security Test (FSST), described in ASTM E2638‐10 [7], involves measuring room average levels in the source room and transmitted sound levels at positions 0.25 m from the test wall in the receiving space. To obtain accurate room average source room levels, measurements were made for 5 independent source positions in the current studies. For the speech security tests, the large chamber was the source room because the robot microphone in the small chamber could then be used to measure the transmitted levels at positions
0.25 m from the test wall. The received levels were measured at 9 positions 0.25 m from the test wall in the small chamber, as illustrated in Figure 1 (b). The new speech security Quick Test (QT) measurements used a loudspeaker source 1 m from the test wall and 1.2 m above the base of the wall in the source room. The receiving microphone was 0.25 m from the test wall in the receiving room and 1.2 m above the base of the test wall. In all QT measurements the microphone was exactly opposite the loudspeaker sound source which was on the other side of the wall in the source room as illustrated in Figure 1(c) and Figure 2. The QT procedure measures level differences between the reference output level of the source and the measured levels at 0.25 m from the wall in the receiving space. The reference levels at a distance of 1 m were obtained using 3 different methods. (1) In one case the reference source level was an average of measured levels on‐axis and 1 m from the source in the actual source room. For these results an average of 12 measurements, 1 m from the source, and at different positions in the source room was used as the reference source level. This source level was re‐measured for all 9 combinations of 3 wall constructions and 3 room absorption values. (2) The second method was to measure the total sound power level of the source in the diffuse sound field of the large reverberation chamber and then to calculate the expected total level at 1 m from the source. The calculated value included the effects of the source directionality characteristics from Appendix I and was intended to represent the total level of the source. (3) The third method was to calculate the expected source levels at a distance of 1 m in a free field from the measured sound power levels and the directional characteristics included in Appendix I. This method was used in the previous examinations of possible quick test procedures [10]. Figure 3 compares the 3 types of reference levels for both the OMNI and DIREC loudspeakers obtained for the Wall01‐NF condition (measurement conditions are explained in the following section). There are differences between the measured total source levels at 1m and those predicted from the measured sound power levels (SWL). The source total levels calculated from the measured sound power levels include the directional characteristics of the source on the direct sound component of the total sound. The measured total levels at 1 m are the actual total levels of the source for the conditions of each test. There are differences that are most noticeable for the DIREC source presumably because applying the directional information in Appendix I to the direct sound component is not adequate to accurately predict the total sound level at 1 m from this source. There are also differences at lower frequencies because all of the measured values were measured with exactly the same source‐receiver geometry and were influenced by the same interference effects from floor reflections. The third approach using calculated direct sound only levels leads to levels that are much lower than the other methods and that vary with frequency relative to the other methods. Although this is seen to be a less satisfactory reference sound level, it is included because previous results were based on this quantity.
125 250 500 1000 2000 4000 60 70 80 90 100 Total from SWL Total measured Direct only OMNI source SPL( f) , dB Frequency, Hz 80 90 100 110 SP L (f) , d B DIREC source Figure 3. Comparison of 3 reference sound levels at 1m from the source for both the directional loudspeaker (DIREC) and the omni‐directional loudspeaker (OMNI). “Total from SWL” indicates that the total sound level at a distance of 1 m that was calculated from measured sound power levels in a diffuse reverberant sound field. “Total measured” corresponds to the total sound level at a distance of 1 m and was an average of measurements at 12 positions in the source room. “Direct only” corresponds to the case of calculating the direct sound level on‐axis and at a distance of 1 m from the source from the measured sound power levels of that source.
Description of Systematic Measurements
Extensive measurements of sound transmission were made for 9 conditions consisting of the combinations of 3 wall constructions and 3 different amounts of room absorption. The types of tests were described in the previous section and summarised in Table 1. The 3 wall constructions consisted of 3 steel stud walls. In all cases the stud system consisted of 90 mm light weight (25 gauge) steel studs at 610 mm spacing and with the stud cavity completely filled with glass fibre batts. Wall01 had 1 layer of 16 mm type X gypsum board on one side of the studs and 2 layers on the other side. Wall02 had 1 layer of 16 mm type X gypsum board on both sides of the studs. Wall03 had 1 layer of 16 mm type X gypsum board on both sides of the studs and also included a mock door. The door consisted of a framed opening in the wall with a single panel of 16 mm gypsum board taped in place in the opening to represent the characteristic of a typical door. Wall03 provided an example of a common construction where the sound transmission through the wall would vary with position along the wall because of the mock door. DRAFT COPY B3487.1 ‐ 11
Figure 4 shows a photograph of the wall stud system with partial gypsum board on one side of the wall and no glass fibre batts installed as viewed from the receiving room. The extra framing for the mock door that is seen in this photograph was included in the constructions of Wall01 and Wall02. The extra framing within the door opening was removed for the Wall03 construction. The lower half of Figure 4 illustrates the locations of measurement positions. For the FSST measurements, microphones were located at each of these 9 measurement positions and spaced 0.25 m from the wall surface. For QT measurements the same microphone positions were used and the source was positioned 1.0 m from the wall on the other side of the wall opposite each of these 9 microphone positions. Both the source and the microphone were at a height of 1.2 m above the base of the wall. Some positions were directly adjacent to studs while alternate positions were in between studs as illustrated in Figure 4. Sound absorbing foam was added to both source and receiving rooms to create 3 different amounts of room reverberation. The no foam case (NF) had no added foam absorbing material. The full foam case (FF) had the most amount of sound absorbing foam material and the half foam case (HF) had a smaller amount that led to measured reverberation times intermediate to the NF and FF cases. The room reverberation times were measured for all 9 conditions (3 walls by 3 absorption conditions). Figure 5(a) shows the measured reverberation times for all 9 conditions in the source room. Figure 5(b) shows the measured reverberation times for all 9 conditions in the receiving room. The absorbing foam was always carefully replaced in the same positions for the tests of each of the 3 walls. As a result there are only very small differences among the 3 wall construction cases for the same absorption conditions. The three absorption conditions provide a wide range of room reverberation conditions for each of the 3 wall constructions as desired to examine the effect of room reverberation on the various measurements. The standard sound transmission loss was measured according to the ASTM E90 procedure [9] for all 9 combinations of the 3 wall constructions and the 3 absorption conditions. These are plotted in Figure 6. There were only tiny changes in transmission loss values with varied room absorption. The associated STC ratings were: Wall01 STC 49, Wall02 STC 46 and Wall03 STC 32. The ratings of Wall01 and Wall02 were a little less than reported for nominally similar constructions. This was probably due to the inclusion of extra framing in wall to make possible easy installation of the mock door for Wall03. The 3 walls do provide a range of constructions for comparing different measurement procedures.
3.66 m 1.2 m 2.44 m 2 3 4 5 6 8 9 1 7 Figure 4. Upper: Photograph of the wall stud system for Wall01 and Wall02 as seen from the receiving space. Lower: Location of the 9 measurement position relative to the stud system. DRAFT COPY B3487.1 ‐ 13
125 250 500 1000 2000 4000 0 1 2 3 4 T 60 , s Frequency, Hz Wall01 Wall02 Wall03 FF 0 1 2 3 4 HF T 60 , s 0 1 2 3 4 NF T 60 , s Figure 5(a). Measured reverberation time (T60) versus frequency for all 3 absorption cases (NF, HF and FF) for all 3 wall constructions in the source room (large chamber, volume 250 m3).
125 250 500 1000 2000 4000 0 1 2 3 4 T 60 , s Frequency, Hz Wall01 Wall02 Wall03 FF 0 1 2 3 4 HF T 60 , s 0 1 2 3 4 NF T 60 , s Figure 5(b). Measured reverberation time (T60) versus frequency for all 3 absorption cases (NF, HF and FF) for all 3 wall constructions in the receiving room (small chamber, volume 140 m3). DRAFT COPY B3487.1 ‐ 15
125 250 500 1000 2000 4000 10 20 30 40 50 60 70 T L(f ), dB Frequency, Hz NF HF FF Wall03 10 20 30 40 50 60 70 Wall02 T L(f ), dB 10 20 30 40 50 60 70 Wall01 TL (f ), d B Figure 6. Measured sound transmission loss (TL) versus frequency for all 9 combinations of 3 wall constructions and 3 room absorption conditions.
DRAFT COPY B3487.1 ‐ 17 In addition to the basic measurements described above, measurements for both types of speech security test were made for each of the 9 test conditions. These were measurements of the full speech security test (FSST) as described in the ASTM E2638 standard [7] and several variations of the speech security Quick Test procedure (QT). Figures 7(a), 7(b) and 7(c) compare FSST and QT results with transmission loss (TL(f)) values for Wall01, Wall02 and Wall03 respectively. Each figure compares results for the 3 absorption conditions for each wall and for results that are the average over all 9 microphone positions. In addition to the TL(f) values, each of the 9 panels in these graphs includes FSST results using both the omni‐directional source (OMNI) and the directional source (DIREC). The FSST results were obtained using steady state white noise from 5 source positions in the source room and the transmitted levels were measured at 9 positions in the receiving space as illustrated in Figure 1 (b). In addition each panel includes QT results for both types of sources for the average of the 9 positions along the test wall. In calculating the QT level differences (LD(f)), the source level used was obtained as the average of 12 measurements in the source room on‐axis and at a distance of 1 m from the source for each of the two source types. In general the TL(f) values, FSST results and the QT results provide somewhat different trends that vary differently with the changes in room absorption. These differences will be discussed briefly here to give an overall qualitative view of the results. The following sections will more quantitatively discuss the differences between the different types of test results. As seen in Figure 6, the standard transmission loss values did not vary significantly with varied room absorption. As intended, they are a measure of only the transmission characteristics of the test walls. In all 9 cases, the FSST results for both OMNI and DIREC sources, agree quite closely over all frequencies. However, the FSST results do vary with room absorption and the level differences from the FSST results systematically increase with increasing room absorption, so that for the FF case, the FSST results are quite similar in magnitude to the TL(f) values. The exception to this is that for higher frequencies, above the coincidence dip (which is located at 2000 and 2500 Hz for this wall) the LD(f) values from the FSST tests increase more rapidly with frequency than the corresponding TL(f) values. (The coincidence dip is due to the properties of the particular gypsum board used as the surfaces of the walls). It is not clear why these small differences between the LD(f) values from the FSST results and the TL(f) values occur, but they may be due to the gypsum board surfaces having different radiation characteristics above the coincidence dip that lead to reduced levels(and increased LD(f)) at 0.25 m from the wall compared to room average values used to assess TL(f) values. The QT results show more complex changes among the 9 cases in that there are also significant differences between the QT results using the OMNI source and those using the DIREC source. The differences between the OMNI and DIREC source QT results increase with increasing frequency above about 500 Hz. The QT LD(f) values do not generally increase with increasing room absorption as much as the FSST results do. However, there is a more rapid increase in QT LD(f) values at high frequencies above the coincidence dip as occurs for the FSST results. The 9 graphs of Figures 7(a), 7(b) and 7(c) give a good overview of the differences among the main types of measurement results. The following sections explore the various differences among these results in more detail and in a more quantitative manner to determine how well we can estimate one set of values from one of the other sets of values.
125 250 500 1000 2000 4000 10 20 30 40 50 60 70 TL (f ) o r LD (f ), dB Frequency, Hz TL FSST-OMNI FSST-DIREC QT-OMNI QT-DIREC FF 20 30 40 50 60 70 HF T L (f ) or LD (f ), dB 20 30 40 50 60 70 NF TL(f ) or LD (f ), dB Figure 7(a). Comparison of measurement results for 3 absorption conditions (NF, HF and FF) for Wall01. Five different quantities are plotted versus frequency: sound transmission loss (TL); level differences for the full speech security test, using the omni source (FSST‐OMNI); level differences for the full speech security test, using the directional source (FSST‐DIREC); level differences for quick test, using the omni
125 250 500 1000 2000 4000 10 20 30 40 50 60 70 TL (f ) o r LD (f ), dB Frequency, Hz TL FSST-OMNI FSST-DIREC QT-OMNI QT-DIREC FF 20 30 40 50 60 70 HF T L (f ) or LD (f ), dB 20 30 40 50 60 70 NF TL(f ) or LD (f ), dB Figure 7(b). Comparison of measurement results for 3 absorption conditions (NF, HF and FF) for Wall02. Five different quantities are plotted versus frequency: sound transmission loss (TL); level differences for the full speech security test, using the omni source (FSST‐OMNI); level differences for the full speech security test, using the directional source (FSST‐DIREC); level differences for quick test, using the omni source (QT‐OMNI) and level differences for quick test, using the directional source (QT‐DIREC). All results are averages over all 9 microphone positions. DRAFT COPY B3487.1 ‐ 19
125 250 500 1000 2000 4000 10 20 30 40 50 60 70 TL (f ) o r LD (f ), dB Frequency, Hz TL FSST-OMNI FSST-DIREC QT-OMNI QT-DIREC FF 20 30 40 50 60 70 HF T L (f ) or LD (f ), dB 20 30 40 50 60 70 NF TL(f ) or LD (f ), dB Figure 7(c). Comparison of measurement results for 3 absorption conditions (NF, HF and FF) for Wall03. Five different quantities are plotted versus frequency: sound transmission loss (TL); level differences for the full speech security test, using the omni source (FSST‐OMNI); level differences for the full speech security test, using the directional source (FSST‐DIREC); level differences for quick test, using the omni
Analyses of the Results of the Systematic Measurements
(a) The relationships between FSST LD(f) values and TL(f) values
The results in the 3 parts of Figure 7 showed that there are differences between the LD(f) values measured using the full speech security test (FSST) and the measurements of sound transmission loss (TL(f)). To explore these differences further, plots of the differences versus frequency are given in Figure 8(a) for OMNI source results and in Figure 8(b) for the DIREC source results. The differences, obtained by subtracting each TL(f) value from the corresponding LD(f) value of the FSST results, are mostly negative indicating that TL(f) values tend to be higher than the LD(f) values from the FSST test. The FSST test LD(f) values systematically increase as the amount of sound absorption in the room is increased. For the high absorption case (full foam, FF) the differences approach approximately 0 for a wide range of frequencies. The differences do not vary systematically over frequency except that at frequencies, above the coincidence dip (i.e. above 2500 Hz) the differences increase sharply. The differences in Figures 8(a) and 8(b) seem to be relatively similar for each of the 9 conditions. This indicates that the FSST results are relatively independent of the type of source, when an adequate number of source positions are used as described in the ASTM E2638 standard [7]. The divergence of results above the coincidence dip (i.e. increased LD(f) values) is less for Wall03 and also for all FF conditions when using the OMNI source. 125 250 500 1000 2000 4000 -8 -4 0 4 8 L D (f )-T L (f ), d B Frequency, Hz NF HF FF Wall03 -4 0 4 8 Wall02 LD (f )-T L (f ), d B -4 0 4 8 Wall01 L D (f )-T L (f ), d B Figure 8(a). Plots of LD(f) – TL(f) differences versus frequency for the 9 combinations of the 3 walls and 3 room absorption treatments. LD(f) values obtained using the FSST test procedure and the OMNI source. DRAFT COPY B3487.1 ‐ 21
Figure 8(b). Plots of LD(f) – TL(f) differences versus frequency for the 9 combinations of the 3 walls and 3 room absorption treatments. LD(f) values obtained using the FSST test procedure and the DIREC source. 125 250 500 1000 2000 4000 -8 -4 0 4 8 LD (f)-TL( f) , dB Frequency, Hz NF HF FF Wall03 -4 0 4 8 Wall02 L D (f )-T L (f ), dB -4 0 4 8 Wall01 L D (f )-T L (f ), d B
Speech security ratings are related to the measured LD(avg) of the wall. This is the arithmetic
average of the LD(f) values over the speech frequencies from 160 to 5000 Hz. By considering
LD(avg) and TL(avg), where both are arithmetic averages over frequencies from 160 to 5000 Hz, we
can quantify the differences between the FSST results and the standard laboratory measurement
of sound transmission through walls. Figure 9 plots the LD(avg) – TL(avg) differences to show how
they vary with the reverberant sound level. As expected from the results in Figures 7(a), 7(b), 7(c),
8(a) and 8(b), adding absorption to the rooms decreases the magnitude of the TL(avg) – LD(avg)
differences to close to zero. Similar results were obtained from both loudspeakers within fractions
of a decibel. The data points to the right of the graph indicate very reverberant conditions
corresponding to the no added absorption (NF) conditions in the reverberation chambers. The
conditions within the rectangular box on the graph represent more typical conditions for office
buildings with low to moderate reverberant sound levels.
For conditions with low reverberant sound we can use the approximation that LD(avg) values
expected in the rooms will be approximately equal to TL(avg) values from laboratory tests of the
same construction. Where rooms are moderately reverberant, we can expect the LD(avg) values
from an FSST test to be about 1 dB smaller than the TL(avg) values from laboratory tests of the
These approximate relationships are useful for estimating speech security ratings at the design
stage, but are based on conditions with similar amounts reverberant sound in both spaces. More
reverberant receiving spaces will tend to have higher levels of total transmitted sound in the
receiving space and these approximations may not be optimum. However, the results in Figure 9
suggest that even in highly reverberant spaces the differences will only change by 1 or 2 dB. Such
highly reverberant conditions would be very uncommon in office type buildings and these
approximations seem quite adequate to use at the initial design stage.
These results are a little different than a previous analysis of similar data [4] due to differences in
the order of calculations. In the previous tests, arithmetic averages over the frequencies from 160
to 5000 Hz were first calculated to get average source, Ls(avg), and receiver, Lr(avg), levels at each
microphone position. Then energy averaging was performed on these frequency averages to get
average levels over positions in the source room and at each receiver position. These average
levels were then subtracted to get LD(avg) values. Since that initial work, the ASTM E2638 standard
has been published and specifies that the levels for each 1/3 octave frequency band must first be
energy averaged to get average source room and receiver levels. These are subtracted to get ⅓‐
octave band LD(f) values from which LD(avg) values are determined. Also in the previous tests
both rooms did not always have the same absorption conditions and source room absorption
effects were estimated from separate tests. While Figure 9 is a plot of LD(avg) – TL(avg)
differences, the previous results were in terms of TL(avg) – LD(avg) differences between the
previous and the current procedures. The curve labelled ‘Previous’ is from the previous results with
the sign of the differences reversed to match the current results. The many differences could easily
explain the approximately 1 dB difference between the current results and the previous results for
conditions more typical of those in office buildings.
‐5 ‐4 ‐3 ‐2 ‐1 0 1 2 3 ‐14.00 ‐12.00 ‐10.00 ‐8.00 ‐6.00 ‐4.00 ‐2.00 LD ‐TL = k 10Log{4/A}, dB DIREC OMNI Previous ALL<‐ More absorption Less absorption ‐>
<‐ More typical conditions in office buildings ‐> Figure 9. Plots of LD(avg) –TL(avg) differences versus 10log{4/A}. Here ‘A’ is the total sound absorption in the room in m2 and 10 log{4/A} is proportional to the strength of the reverberant sound level when diffuse field conditions are assumed to exist. Data is shown for the results from measurements with both the OMNI and the DIREC sound sources, and ‘All’ is the regression line fitted to the combined data of both sources. DRAFT COPY B3487.1 ‐ 23
(b) The relationships between FSST results and QT results
A successful Quick Test procedure should more efficiently provide results that closely approximate those of the FSST procedure or that can easily be converted to be equivalent to FSST test results. It is therefore of interest to examine the differences between QT and FSST test results for several variations of the QT. As in the previous section, these differences are first considered in terms of plots of the differences in LD(f) values versus frequency for QT values relative to FSST results using different methods to determine the source reference levels for the QT results. These plots of LD(f) differences were created for each of the 9 measurement conditions. Figure 10(a) plots differences in LD(f) values for measurements using the OMNI source and Figure 10(b) shows the corresponding differences in LD(f) values when using the DIREC source. Both sets of results were obtained using measured reference sound levels. There are again variations in the LD(f) differences resulting from changes in the total room absorption. However, the effects of room absorption on these differences is less than for the LD(avg) – TL(avg) differences in Figures 8(a) and 8(b). For the OMNI source results in Figure 10(a), the LD(f) differences do not vary greatly over frequency. There are some low frequency irregularities in the differences due to the effects of floor reflections on the source level measurements used in calculating the QT results. However, for the results using the DIREC source (Figure 10(b)), the differences systematically increase with increasing frequency by up to 15 dB and this increase seems to vary between wall constructions. These variations of the differences would make it more complicated to accurately predict FSST results from QT measurements using the DIREC source. The QT results used to produce Figures 10(a) and 10(b) were level differences relative to an average of 12 measurements of the source levels at 1 m from each source in the source room. This was thought to be the most practical and accurate procedure for determining a measure of the source output. However, it was thought possible that measuring the on‐axis level of the DIREC source at 1 m, might exaggerate the level of the total incident sound on the test wall. Consequently, another approach was also tried by calculating the total source levels at 1 m from measurements of the sound power output and directional characteristics of the source. The sound power output of both sources was measured from the reverberant levels of the output in the source room for each of the 9 conditions. The level of the total sound on axis at a distance of 1 m, was then calculated and used as the effective source level. From these source levels, new Quick Test LD(f) values were calculated. These QT results were again compared with the corresponding FSST test results in terms of the differences in LD(f) values. Figure 11(a) plots differences in LD(f) values for measurements using an OMNI source and Figure 11(b) shows the corresponding differences in LD(f) values when using the DIREC source. In both cases QT results were based on reference source levels calculated from the measured sound power levels of the sources. The results in Figure 11(a) are very similar to those in Figure 10(a) for measurements using the OMNI source. This is to be expected because this source is not strongly directional and the measured and calculated source levels at 1 m would be quite similar. There are some small differences between the two graphs in that the curves in Figure 10(a) are a little more irregular than those in Figure 11(a) at lower frequencies. This is because all measured source levels include the exactly the same interference effects of floor reflections. This causes some small peaks and dips in the measured source levels that are not present in the calculated source levels.Figure 11(b) for the QT results from the calculated source levels for the DIREC source than in Figure 10(b). The calculated reference levels suggest less influence of the direct sound on the central axis of the loudspeaker. This indicates that using the directional information from Appendix I to modify the level of the direct sound is not adequate to describe the total sound level for the DIREC source. Although the increase in differences with increasing frequency is smaller for the DIREC source results using calculated source levels, an increase does still occur and would probably vary among directional sources. . QT results were also calculated using a calculated direct sound only level as the reference source level. This resulted in QT LD(f) values that tended to be much smaller than the FSST results, that varied more over frequency, and for which the DIREC source results were more different than the OMNI source results. This approach was used in the previous study [10] but now seems to have less merit than the two schemes evaluated in Figures 10(a), 10(b), 11(a) and 11(b). Of the two more successful approaches, the most accurate and convenient approach for carrying out QT measurements is to use an OMNI source and measure source levels at a distance of 1.0m in the source room. 125 250 500 1000 2000 4000 -8 -4 0 4 8 12 16 LD (f ) di ff er enc e, dB Frequency, Hz NF HF FF Wall03 -4 0 4 8 12 16 Wall02 LD (f ) di ff er enc e, dB -4 0 4 8 12 16 Wall01 LD dif fe renc e , dB Figure 10(a). FSST – QT differences in LD(f) values for QT results obtained using measured source levels at 1.0 m and the OMNI source.
DRAFT COPY B3487.1 ‐ 25
125 250 500 1000 2000 4000 -8 -4 0 4 8 12 16 LD (f ) di ff er enc e, dB Frequency, Hz NF HF FF Wall03 -4 0 4 8 12 16 Wall02 LD (f ) di ff er enc e, d B -4 0 4 8 12 16 Wall01 LD(f ) dif fe ren c e , dB Figure 10(b). FSST – QT differences in LD(f) values for QT results obtained using measured source levels at 1.0 m and using the DIREC source. 125 250 500 1000 2000 4000 -8 -4 0 4 8 12 16 LD (f ) di ff e renc e , dB Frequency, Hz NF HF FF Wall03 -4 0 4 8 12 16 Wall02 LD (f ) di ff erenc e, dB -4 0 4 8 12 16 Wall01 LD (f ) di ff eren c e, dB
125 250 500 1000 2000 4000 -8 -4 0 4 8 12 16 LD (f ) di ff er enc e, dB Frequency, Hz NF HF FF Wall03 -4 0 4 8 12 16 Wall02 LD (f ) di ff er enc e, d B -4 0 4 8 12 16 Wall01 LD(f ) dif fe ren c e , dB Figure 11(b). FSST – QT differences in LD(f) values for QT results obtained using source levels at 1.0 m from the DIREC source, calculated from diffuse field sound power levels in the source room. The differences between the FSST and the QT results were also examined in terms of differences in LD(avg) values for each of the 9 conditions and for measurements using both source types. Figure 12(a) plots variations in differences in LD(avg) values with varied reverberant sound level as related to the reverberant levels (10log{4/A})in the rooms using the OMNI source. LD(avg) values from the FSST tend to be a little larger than those from the QT results using the OMNI source and the differences vary systematically with varied room absorption. For typical conditions in office buildings, the FSST LD(avg) values would be about 2 dB higher than those from QT results of the same conditions. Figure 12(a) includes QT results using measured source levels as well as those from calculated source levels. The results are seen to be very similar for these two types of OMNI source results and the scatter about the regression line is quite small. Figure 12(b) plots variations in differences in LD(avg) values with varied reverberant sound level as predicted from (10log{4/A}) values in the rooms using the DIREC source. These results are quite different than those for the OMNI source measurements and exhibit much greater scatter. The results using measured source levels are about 2 dB different than those using calculated source levels. These results confirm that QT results using the DIREC source are less well related to the FSST results for the same configurations. Therefore, QT measurements using an OMNI source would provide more accurate predictions of the FSST test results of the same situations. DRAFT COPY B3487.1 ‐ 27
‐2.0 ‐1.0 0.0 1.0 2.0 3.0 4.0 ‐14.00 ‐12.00 ‐10.00 ‐8.00 ‐6.00 ‐4.00 ‐2.00 LD (a vg) d ifferen ce, dB 10 log{4/A}, dB OMNI SWL OMNI‐Meas <‐ More absorption Less absorption ‐> <‐ More typical conditionsinoffice buildings ‐> Figure 12(a). FSST – QT differences in measured LD(avg) values related to reverberant sound levels, (10log{4/A}), for measurements using the OMNI source. ‘SWL’ indicates the source levels for the QT results were calculated from sound power levels and ‘Meas’ indicates the source levels were measured. ‐5.0 ‐4.0 ‐3.0 ‐2.0 ‐1.0 0.0 1.0 ‐14.00 ‐12.00 ‐10.00 ‐8.00 ‐6.00 ‐4.00 ‐2.00 LD (a v g ) d iff er en ce , dB 10 log{4/A}, dB DIREC‐All DIREC SWL DIREC‐Meas <‐ More absorption Less absorption ‐> <‐ More typical conditions in office buildings ‐> DIREC re SWL DIREC All data DIREC re Meas Figure 12(b). FSST – QT differences in measured LD(avg) values related to reverberant sound levels, (10log{4/A}), for measurements using the DIREC source. ‘SWL’ indicates the source levels for the QT results were calculated from sound power levels and ‘Meas’ indicates the source levels were measured. There are linear regression lines for each set of data and the middle line for all of the data combined.
DRAFT COPY B3487.1 ‐ 29
(c) The relationships between the QT results and TL values
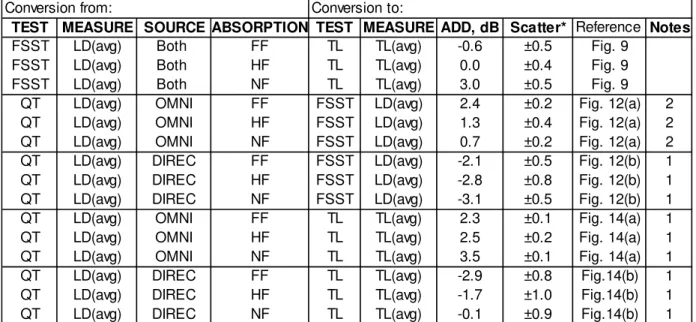
In addition to comparing QT results with the FSST results, it is of interest to compare QT results directly with transmission loss values. Figures 7(a), 7(b) and 7(c), showing plots of TL(f) and LD(f) values from various speech security tests, suggest that the QT results roughly parallel the TL(F) values and vary less with room absorption than do the LD(f) values for the FSST results. These differences can be seen more clearly in Figures 13(a) and 13(b) that plot the differences between TL(f) values and LD(f) values from Quick Test measurements (calculated as QT – TL). Figure 13(a) is for QT results using the OMNI source and Figure 13(b) is for DIREC source results. For the OMNI source results the LD(f) values parallel the TL(f) values. There are exceptions to this at high and low frequencies. At low frequencies there are some irregularities that are probably caused by interference effects associated with floor reflections on the reference source level measurements. At high frequencies the LD(f) values increase with frequency relative to the TL(f) values. The results in Figure 13(b) for the DIREC source show that for this source the LD(f) values increase with increasing frequency from about 1000 Hz. The variations with frequency also vary a little among the 3 different wall constructions and the LD(f) values tend to increase a little with increased room absorption. The QT and TL results are also compared by relating QT LD(avg) values to TL(avg) values. Figure 14(a) plots differences of measured LD(avg) – TL(avg) values versus variations of the reverberant sound levels to indicate the effects of room absorption on these differences. The results show very little scatter and only a small effect of varied room absorption. For the HF and FF cases, which are most representative of conditions in typical office buildings, LD(avg) values are about 2.5 dB greater than the corresponding TL(avg) values with the scatter about the regression line much less than ±0.5 dB. It is therefore possible to predict TL(avg) values quite accurately from QT measurements of LD(avg) values using the OMNI source. A similar comparison of QT and transmission loss measurements is made in Figure 14(b) for results obtained using the DIREC source. The results in Figure 14(a) for the OMNI source measurements indicate that LD(avg) values for QT results are about 2.5 dB lower than the corresponding TL(avg) values for more typical conditions. However, Figure 14(b) suggests that for the DIREC source results LD(avg) values are about 2.5 dB higher than the corresponding TL(avg) values for the more typical conditions. The plot of the DIREC source results also includes more scatter than does the plot for the OMNI source results. Although the LD(avg) values using the DIREC source are on average larger than the TL values, the initial plots in Figures 7(a), 7(b) and 7(c), showing all of these values indicate that the DIREC source QT values vary with frequency quite differently than the TL(f) values. This would make it quite difficult to accurately predict TL(f) from QT measurements using the DIREC source.
125 250 500 1000 2000 4000 -8 -4 0 4 8 12 16 20 LD (f ) - T L (f ), dB Frequency, Hz NF HF FF Wall03 -4 0 4 8 12 16 20 Wall02 LD (f )-TL(f ), dB -4 0 4 8 12 16 20 Wall01 LD (f )-T L( f), dB Figure 13(a). Differences between LD(f) values from QT results and TL(f) values from transmission loss results (QT – TL). For the 9 test conditions using the OMNI source to obtain QT results.
125 250 500 1000 2000 4000 -8 -4 0 4 8 12 16 20 LD (f )-T L(f ), dB Frequency, Hz NF HF FF Wall03 -4 0 4 8 12 16 20 Wall02 LD (f )-TL(f ), dB -4 0 4 8 12 16 20 Wall01 LD (f )-T L( f), dB Figure 13(b). Differences between LD(f) values from QT results and TL(f) values from transmission loss results (QT – TL). For the 9 test conditions using the DIREC source to obtain QT results. DRAFT COPY B3487.1 ‐ 31
‐6.0 ‐5.0 ‐4.0 ‐3.0 ‐2.0 ‐1.0 0.0 ‐14.0 ‐13.0 ‐12.0 ‐11.0 ‐10.0 ‐9.0 ‐8.0 ‐7.0 ‐6.0 ‐5.0 ‐4.0 LD (a vg) ‐TL (a v g ) dif fe re nc e , dB 10log{4/A}, dB <‐ More typical conditions in office buildings ‐>
<‐ More absorption Less absorption ‐>
Figure 14(a). LD(avg) –TL(avg) differences from Quick Test and transmission loss measurements of the 9 experimental conditions, using the OMNI source, plotted versus the reverberant sound level, (10log{4/A}), to indicate the effects of varied room absorption. ‐2.0 ‐1.0 0.0 1.0 2.0 3.0 4.0 ‐14.0 ‐13.0 ‐12.0 ‐11.0 ‐10.0 ‐9.0 ‐8.0 ‐7.0 ‐6.0 ‐5.0 ‐4.0 LD (a vg) ‐TL (a v g ) d if fer en c, dB 10log{4/A}, dB <‐ More absorption Less absorption ‐> <‐ More typical conditions in office buildings ‐> Figure 14(b). LD(avg) –TL(avg) differences from Quick Test and transmission loss measurements of the 9 experimental conditions, using the DIREC source, plotted versus the reverberant sound level, (10log{4/A}), to indicate the effects of varied room absorption.
(d) Variation of FSST and QT results with position along the wall
All results presented up to this point have been averages of measurements at all 9 positions along the test walls. Wall03 included a mock door specifically to provide results for a typical situation where transmitted sound levels would vary with position along the wall. This section presents measurements at individual positions along the walls to illustrate what each type of measurement is capable of revealing about the properties of a particular construction when considered at individual receiver positions. The results include comparisons of measured attenuations as a function of frequency from FSST and QT. Measurement results are first discussed in terms of LD(avg) values at each position along the walls for the 4 combinations of FSST and QT test results using both the OMNI and the DIREC sources. Figure 15 plots LD(avg) values from all 4 types of measurements for the 9 positions along Wall02 for the HF condition. As expected, the LD(avg) values do not vary greatly with position along the wall because the construction does not vary significantly from one part of the wall to another. For the 2 FSST test results LD(avg) values are very similar for the OMNI and DIREC source results at all positions along the wall. Both of these results tend to increase a little at position #1which is closer to one end of the wall. The magnitudes of the two QT results are quite different but they both vary little from position to position along the wall. Figure 16 plots a similar comparison to that of Figure 15 above for measured LD(avg) values of Wall03 versus position for the 4 combinations of FSST and QT results using both OMNI and DIREC sources. Wall03 included a mock door and transmitted sound levels were expected to vary with position along the wall as occurs in this figure. Values of all 4 sets of results are lowest at position 4 and 5 which were located near the middle of the door (see Figure 4). The LD(avg) values from the FSST results for the OMNI and DIREC sources are quite similar at each position but vary by up to about 2 dB with position along the wall, being lowest at positions 4 and 5 near the centre of the door. The QT test results vary more with position along the wall. The QT results using the OMNI source vary by up to about 3 dB and those using the DIREC source by up to almost 5 dB. The results from the QT using the DIREC source can best discriminate the variations in transmission characteristics along the wall. However, all measurements at all positions are to varying degrees influenced by sound transmission through all parts of the wall. There is very little attenuation of the sound coming through the mock door to other points along the wall in the receiving room. 1 2 3 4 5 6 7 8 9 42 44 46 48 50 52 LD(avg), dB Position QT-DIREC FSST-DIREC FSST-OMNI QT-OMNI Figure 15. Measured LD(avg) values versus position along the wall for the Wall02‐HF case. They include FSST results for the OMNI and DIREC sources as well as QT results for both sources. DRAFT COPY B3487.1 ‐ 331 2 3 4 5 6 7 8 9 26 28 30 32 34 36 38 40 LD(avg), dB Position QT-DIREC FSST-DIREC FSST-OMNI QT-OMNI Door Figure 16. Measured LD(avg) values versus position along the wall for the Wall03‐HF case. They include FSST results for the OMNI and DIREC sources as well as QT results for both sources. The location of the mock door is also shown. The differences in measurements at positions along the wall are further explored by comparison of the spectrum of the LD(f) values. Figure 17 compares LD(f) values using the OMNI source with the measured TL(f) values for data from the Wall02‐HF and Wall03‐HF cases. Transmission loss data are shown for the measurements of the 2 cases. Calculated transmission loss values for the door are also shown. These were obtained by an area weighted subtraction of the measured TL(f) values of the Wall02‐HF and Wall03‐HF cases. The door TL(f) values are quite low and are representative of some real doors except that they include a coincidence dip at 2500 Hz due to the properties of the gypsum board mock door. The more complex constructions of a real door are not likely to have this feature. The measured QT LD(f) values at positions 4 and 5 (near the centre of the door) are similar to, but a little higher than, the calculated TL(f) for the door. The QT LD(f) values for the Wall02‐HF condition are a little lower than the measured TL(f) values at most frequencies. 125 250 500 1000 2000 4000 10 20 30 40 50 60 LD( f) or T L (f), dB Frequency, Hz TL door TL Wall03 TL Wall02 QT Wall03 #5 QT Wall03 #4 QT Wall02 #4