HAL Id: hal-02356932
https://hal.archives-ouvertes.fr/hal-02356932
Submitted on 9 Nov 2019
HAL is a multi-disciplinary open access
archive for the deposit and dissemination of
sci-entific research documents, whether they are
pub-lished or not. The documents may come from
teaching and research institutions in France or
abroad, or from public or private research centers.
L’archive ouverte pluridisciplinaire HAL, est
destinée au dépôt et à la diffusion de documents
scientifiques de niveau recherche, publiés ou non,
émanant des établissements d’enseignement et de
recherche français ou étrangers, des laboratoires
publics ou privés.
Distributed under a Creative Commons Attribution - NonCommercial| 4.0 International
License
Deep-Sea Trenches of the Pacific Ocean: a Comparative
Analysis of the Submarine Geomorphology by Data
Modeling Using GMT, QGIS, Python and R.
Polina Lemenkova
To cite this version:
Polina Lemenkova. Deep-Sea Trenches of the Pacific Ocean: a Comparative Analysis of the Submarine
Geomorphology by Data Modeling Using GMT, QGIS, Python and R.. Doctoral. China. 2019, pp.106.
�hal-02356932�
Deep-Sea Trenches of the Pacific Ocean:
a Comparative Analysis of the Submarine Geomorphology
by Data Modeling Using GMT, QGIS, Python and R
Mid-Term PhD Thesis Presentation: Current Research Progress
Polina Lemenkova
Ocean University of China, College of Marine Geo-Sciences
Study Information
I Supervisor: Prof. Dr. Yonghong Wang
I School: Ocean University of China
I Department: College of Marine Geo-sciences
I Major: Marine Geology
I Level: Doctor of Philosophy (PhD)
I Student ID: w11160411002
I Course Duration: 09/2016 - 07/2020
I Location: People’s Republic of China (P. R. C.), Shandong Province, Qingdao
I Funding: China Scholarship Council (CSC), State Ocean Administration (SOA), Marine Scholarship of China, People’s Republic of China (P. R. C.), Beijing, Grant #2016SOA002, 2016-2020.
Research Highlights
Research Object
I Deep-sea trenches of the Pacific Ocean
Research Focus
I Submarine geomorphology of the trenches: comparative analysis of their structure
I Seafloor bathymetry of the trenches: modelling spatial variations of their patterns
I Impact factors affecting trench formation: highlighting their variability
Research Techniques
I Methods: data analysis, processing, visualization, statistical modelling, cartographic mapping, 3D and 2D simulation models, graphical plotting
I Tools: Generic Mapping Tools (GMT); QGIS plugins; statistical libraries of the programming languages: Python, R, Matlab/Octave and AWK
Mid-Term PhD Thesis Presentation of Polina Lemenkova. College of Marine Geo-Sciences, Ocean University of China. Qingdao, 04/11/2019. 3
Pacific Ocean
Pacific Ocean
Figure 2:General geologic map of the seafloor of the Pacific Ocean
Mid-Term PhD Thesis Presentation of Polina Lemenkova. College of Marine Geo-Sciences, Ocean University of China. Qingdao, 04/11/2019. 5
Research Goals
Research Objective
The impact of the factors (geology, tectonics, seismicity) on its geomorphology studied by methods of the data visualization, modelling and statistical analysis.
Research Goals
I Investigating the geology and submarine geomorphology of the Pacific trenches
I Technical improving and testing of the advanced algorithms of geodata analysis
I Applying innovative methods in cartographic data visualization and mapping
I Developing techniques of the automatic digitizing of the cross-section profiles
I Sequential data processing & modelling by QGIS, Python, R, GMT, AWK, Octave
I Automatization in geological data analysis aims at:
I precision and reliability of the results
I increased speed of the data processing
I accuracy and precision of the data modelling
I crucial for the big data processing common for geological field marine observations
I Geospatial analysis to identify variations and to highlights correlations between the geomorphic shape of the trenches (slope steepness gradient, depth ranges)
Research Actuality
Research Actuality
I Inaccessible location => the seafloor of the deep-sea trenches can only be visualized using RS and ML tools
I Knowledge of ocean floor bathymetry is essential for understanding ocean structure and related disciplines: physical oceanography, marine biology, marine chemistry, and marine geology.
I Currents, tides, mixing, and upwelling of nutrient rich water are all influenced by the seafloor bathymetry [94].
Research Aims
I to map bathymetric heterogeneity of the Pacific trenches seafloor by means of cartographic visualization in QGIS and GMT [101] using ETOPO1, GEBCO, SRTM, ETOPO5 and EGM96 high quality datasets [102]
I to visualize variations of geomorphology and model trends of the geomorphic shape curves of trenches using data processing in Python, GMT, Octave and R
I to study properties of the hadal trenches in the Pacific Ocean, detect correlation of their geologic settings with geomorphology
Mid-Term PhD Thesis Presentation of Polina Lemenkova. College of Marine Geo-Sciences, Ocean University of China. Qingdao, 04/11/2019. 7
Data
Accuracy of digital bathymetric data is of crucial importance and well discussed [92]. Current work uses such datasets as GEBCO, ETOPO1, SRTM for high quality mapping and modelling and other data summarized in the table below.
Table 1:Data sources, types and precision
No Data Origine Type
1 ETOPO1 NOAA 1 arc-min GRM grid [2] 2 ETOPO5 NOAA 5 arc-min GRM grid 3 GEBCO BODC 15-sec DEM raster grid 4 SRTM NASA 15-sec DEM raster grid [7] 5 Geology USGS Vector layers
6 Gravity Scripps IO CryoSat-2, Jason-1 grid [86] 7 EGM96 Scripps IO Geopotential geoid model 8 ASCII Scripps IO Topo tables (xyz format) 9 GEBCO IHO-IOC Geographic gazetteer [38]
Data
Table 2:Statistics on major 20 deep-sea trenches of the Pacific Ocean
No Name Max depth Length* Width*
1 Aleutian 8,109 3,400 59 2 Mariana 10,994 2,550 59 3 Philippine 10,540 1,320 65 4 Kuril-Kamchatka 10,542 2,900 59 5 Middle America 6,669 2,750 34 6 Peru-Chile 8,065 5,900 64 7 Hikurangi 3,750 350 80 8 Puysegur 6,300 620 76 9 Palau 11,034 700 47 10 Japan 8,513 800 59 11 Kermadec 10,047 1,200 88 12 Tonga 10,882 1,375 78 13 Izu-Bonin 9,780 2,800 82
14 New Britain (Bougainville) 9,140 335 70 15 San Cristobal 8,255 742 64
16 Manila 5,400 648 76
17 Yap 8,850 500 45
18 Vanuatu (New Hebrides) 7,600 1,200 34
19 Vityaz 5,984 580 65
20 Ryukyu 7,460 2,250 38
*Length and width are indicated in km
Mid-Term PhD Thesis Presentation of Polina Lemenkova. College of Marine Geo-Sciences, Ocean University of China. Qingdao, 04/11/2019. 9
Tools
Why GMT ?
I Advanced level of cartographic functionality: variety of projections, data processing, import/export, etc
I High quality cartographic design solutions: colour palettes, layouts, grids, vector lines, advanced data visualization
I Flexibility of coding / shell scripting from UNIX console
I Embedded data analysis and visualization: cartographic mapping, graphcial modelling, data logical queries, statistical analysis, import/export, vector and raster processing
I Open source
Why AWK ?
I Powerful tool for data extracting and sorting for further processing
I Tables processing: reshaping, modification, generating reports
I Data: operating with small databases, validating, producing indexes
I Operating with streams of table data
I UNIX command line operable
Tools
Why Python ?
I General purpose famous high-level programming language
I Data analysis: full range of algorithms used in data science and processing
I Statistical analysis: well developed stand-alone libraries (Matplotlib, SciPy, NumPy, Pandas, StatsModels)
I Beauty & elegance of graphs: advanced design solutions for data visualization in Matplotlib & Seaborn
I Scripting approach with more readable syntax => easier to learn than R
I Open-source
Why R ?
I Reputable high-level programming language
I Statistical analysis is supported by powerful variety of algorithms in R packages
I Effectiveness specifically in advanced scientific statistical data analysis
I Complex syntax with scripting approach => flexibility of data processing (big tables, data frames)
I Beauty & elegance of graphs (e.g. packages: {ggplot}, {tidyverse})
I Open source
Mid-Term PhD Thesis Presentation of Polina Lemenkova. College of Marine Geo-Sciences, Ocean University of China. Qingdao, 04/11/2019. 11
Kuril-Kamchatka Trench I Kuril-Kamchatka Trench
(KKT): depths > 5000 m
I KKT is located on the border of the Sea of Okhotsk, Far East, NW Pacific
I KKT continues
south-eastwards from the coast of the Kamchatka Peninsula, in parallel to the Kuril Island chain until Hokkaido Island.
I The Sea of Okhotsk max depths 3374 m [76]
I The deepest strait to the NW Pacific Ocean is Bussol (2300m) [15]
Kuril-Kamchatka Trench
Key points on the geologic and tectonic settings of the KKT:
I presents a boundary of the large subduction zone of the Pacific tectonic plate under the Okhotsk tectonic plate [12]
I irregularity in its bathymetric shapes and geomorphic structure
I together with Aleutian Trench, the KKT presents contiguous complex, area: 254,740 km2[34].
I The Okhotsk plate represents a region of active grabens lying southwards of a chain of small sedimentary basins in the Cherskii Mnts [89].
Mid-Term PhD Thesis Presentation of Polina Lemenkova. College of Marine Geo-Sciences, Ocean University of China. Qingdao, 04/11/2019. 13
Kuril-Kamchatka Trench
Geoid model (EGR96) of the Kuril-Kamchatka Trench and Kamchatka Peninsula. [47]
Key points on the geologic and tectonic settings of the KKT:
I there is proved radially symmetric coherence between satellite gravity and multibeam bathymetry grids [78]
I the free-air marine gravity fields map illustrates values (mGal) of the density anomalies at seafloor topography, sediments, crust and mantle [93].
I the free-air anomaly is dominated by the short wavelength variations which reflect the density contrast at the seafloor.
I the gravity spectrum correlates with the bathymetry of the seafloor.
Kuril-Kamchatka Trench
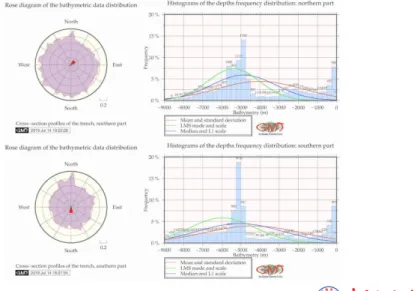
Figure 3:Cross-section bathymetric profiles across the Kuril-Kamchatka Trench. [47]
Mid-Term PhD Thesis Presentation of Polina Lemenkova. College of Marine Geo-Sciences, Ocean University of China. Qingdao, 04/11/2019. 15
Kuril-Kamchatka Trench
3D visualization of the Kuril-Kamchatka Trench and Kamchatka Peninsula geomorphic structure. [47]
Key points on the Kuril-Kamchatka Trench geomorphology:
I the KKT floor geomorphology on the N: gentle slope patterns and depths <7, 400 m
I N wall of the trench is the island-ward sloping surface of the Kuril islands.
I N profiles are mainly flat and go parallel form at the shallower depths that extend to ca. 7,200 m in the seafloor.
I most N profiles shows shallow depths and gentle slope shape following the enlargement of the trench valley.
I stacks of local small hills and bulges across the trench indicate sediment deposition along the trench slope in its N part.
Kuril-Kamchatka Trench
Figure 4:Cross-section bathymetric profiles across the Kuril-Kamchatka Trench, Octave
Mid-Term PhD Thesis Presentation of Polina Lemenkova. College of Marine Geo-Sciences, Ocean University of China. Qingdao, 04/11/2019. 17
Kuril-Kamchatka Trench
Kuril-Kamchatka Trench
Key points on the Kuril-Kamchatka Trench bathymetry:
I southern part is deeper reaching -8,200 m depth while northern part has -7,800 at maximal records.
I at a southern segment, the seafloor depths increase with increasing latitude gradually while moving southwards.
I the profiles located in in the northern segment are shallower
I variations illustrates tectonic and geological local variations and different sedimentation of the northern and southern part of the trench.
These are the results of the comparative analysis of the two distinct parts of the trench located north- and southwards from the Bussol Strait.
Mid-Term PhD Thesis Presentation of Polina Lemenkova. College of Marine Geo-Sciences, Ocean University of China. Qingdao, 04/11/2019. 19
Aleutian Trench
Aleutian Trench
Key points on the Aleutian Trench (AT) geology and tectonics:
I The AT is located in the North Pacific Ocean in the area of PP subduction.
I The tectonics of the Aleutian-Komandorsky chain is colliding with Kamchatka at the Kamchatsky Peninsula Cape.
I Structural evolution of the Kamchatka–Aleutian junction area in the Mesozoic and Tertiary was affected by the subduction in Kronotskiy subduction zone and collision of the Kronotskiy arc against North-East Eurasia margin [26]
I The Aleutian Islands arc is an accreting margin with most of the arc having a well-developed frontal prism formed in the Plio-Pleistocene.
I The central Aleutian volcanic front migrated northwards 30-60 km since the formation of the arc massif completed in the late Eocene. Aleutian Trench has weak coupling between the surface tectonic plate and subducting slabs [107].
I The Aleutian tectonics is deeply connected with KKT since the Aleutian transform fault separated the Kronotskiy terrane block from the Pacific plate [23]
I The seafloor of the AT is constantly experiencing deformations under the impact of the plate tectonic processes.
I Various factors affect its formation, among which, tectonics plates movement, subduction of the underlying slab into the deep mantle, seismic activities in the study area, e.g. submarine earthquakes [91].
Mid-Term PhD Thesis Presentation of Polina Lemenkova. College of Marine Geo-Sciences, Ocean University of China. Qingdao, 04/11/2019. 21
Aleutian Trench
Figure 7:Cross-section bathymetric profiles across the Aleutian Trench
The profiles plotted in an automated regime are located with a distance of 20 km between each pair, spaced every 2 km along the profiles itself and have a total length of 400 km, that is 200 km to both sides from the trench. depths with ranges between -5600 and -5400 m have occurrence of 1106 (8%); depths with ranges between -5400 and -5200 m have occurrence of 846 (7%); depths with ranges between -4900 and -5200 m have occurrence of 1297 (11%).
Aleutian Trench
The topography in the study area ranges between -8000/2000 m. According to the statistical histogram modelling, the most often depth value in the study area is -4800 with frequency 1722. The highest values demonstrated values of -4900 and -4700 with 1722 occurrences (13,2%). Significantly low values demonstrated shallow areas with depth ranges between -4500 and -3000 m with occurrence of below 200 (all of then less than 2,5%).
Figure 8:Statistical analysis of the profiles, AT: GMT
Mid-Term PhD Thesis Presentation of Polina Lemenkova. College of Marine Geo-Sciences, Ocean University of China. Qingdao, 04/11/2019. 23
Middle America Trench
The Middle America Trench (MAT) is located on the Cocos Plate, between the Tehuantepec Ridge and stretching until Cocos Ridge, off Guatemala. Important geological historical context on the Cocos Plate (CP):
I CP is young oceanic tectonic plate, beneath the Pacific Ocean off the coast of the Central America continent [81]
I CP was created as a results of the break of Farallon Plate into Nazca and CP [99]
I CP is bounded by: North American, Caribbean, Pacific and Nazca plates [33]
Mid-Term PhD Thesis Presentation of Polina Lemenkova. College of Marine Geo-Sciences, Ocean University of China. Qingdao, 04/11/2019. 24
Middle America Trench
Key points on the Middle America Trench:
I The neotectonic MAT consists of two distinct parts with varying features of the oceanic plate and geology in either: northern and southern
I The division between the both parts goes by the Tehuantepec Ridge [5]
I The northern part of MAT, off Mexico, a.k.a. Acapulco Trench: a minor hadal trench, a part of the East Pacific Rise, from Jalisco to Tehuantepec Ridge.
Figure 10:Geological settings in the region of the Middle America Trench
Mid-Term PhD Thesis Presentation of Polina Lemenkova. College of Marine Geo-Sciences, Ocean University of China. Qingdao, 04/11/2019. 25
Middle America Trench
Study sample area is a southern part of MAT: Guatemala Trench
Middle America Trench
The study area is 94◦W-87◦W, 11,5◦N-15◦N
Figure 12:Statistical analysis of the Middle America Trench
Mid-Term PhD Thesis Presentation of Polina Lemenkova. College of Marine Geo-Sciences, Ocean University of China. Qingdao, 04/11/2019. 27
Middle America Trench
Key results on the Middle America Trench:
I MAT geometry demonstrates its relatively steep and strait shape.
I major depth samples: between the -3000 and -6200 m; seafloor 3-5 km wide.
I frequency samples distribution shows changes by profiles. Increase of frequency between -3000 to -4000 m caused by the geologic settings of the Cocos Plate.
I the deepest depth data range with 1,111 records takes 25% of the samples.
I mean sample values: -2,200, and 7,5% at -4,000 to -3,500 m
I median values: -3,200 to -3,300 m.
I NW distribution of the rose diagram shows steep slope on the oceanward forearc with few samples due to the steepness on the continental slope with denser samples on the CP where the geomorphology has more gentle shape.
Peru-Chile Trench
Key points on the topography of the Peru-Chile Trench (PCT):
I PCT a.k.a. Atacama Trench, the longest Pacific trench (5900 km)
I PCT stretches from Ecuador to Chile 6◦S, 81◦50W to 39◦S, 75◦W.
I In total length, PCT covers area of ca. 590,000 km2.
I The PCT is shallower comparing to other Pacific trenches (64 km width).
I Max depth 8065 m => deepest trench in South PO
Mid-Term PhD Thesis Presentation of Polina Lemenkova. College of Marine Geo-Sciences, Ocean University of China. Qingdao, 04/11/2019. 29
Peru-Chile Trench
Key points on the geology of the Peru-Chile Trench (PCT):
I PCT is formed by the subduction of the Nazca and Antarctic plates beneath the South American Plate [9].
I specific geologic, geotectonic, geomorphic and climatic characteristics generated between the Chilean-Peru Trench and the Chilean coasts
I PCT is exposed to a wide variety of hazards: earthquakes, local tsunamis, volcanism, continent-specific hazards (floods, landslides, mass movements)
I giant earthquakes: Valdivia (Mw=9.5), 1960, Maule (Mw=8.8), 2010.
I processes in the oceanic fracture zones in PCT area are affected by high degree of hydration in the crust and upper mantle is discussed by [16].
I according to the sedimentation conditions, the Peru-Chile Trench can be divided into two main provinces: the main sediment-free province extending 8◦S-32◦S and the sedimentary province extending 33◦S-57◦S [35].
Peru-Chile Trench
Key points on the sedimentation of the Peru-Chile Trench (PCT):
I Over 50% of the world’s deep-sea trenches are ’sediment starved’ or ’partly sediment filled’ [29].
I N part of PCT, (Peruvian segment), is ’sediment starved’, while S part (Chilean segment) is ’partly sediment filled’ [28].
I As a response of sediment loading at the trench, the downward deflection determines its sediments capacity (amount of subducted sediments)
I Weak and hot oceanic plates has larger space for sediment subduction [18].
I Downward deflection of the plate is larger along the Chiloé segment comparing to Maule segment [19]
I The margin off Isla de Chiloé is characterized by a largely sedimented segment of the Peru-ChileTrench.
I This is caused by the extension of turbidite deposits seaward reaching 250 km from the trench axis [17].
I The region close to the Taitao Triple Junction is devoid of sediments and has rapid narrowing of the forearc region [8].
Mid-Term PhD Thesis Presentation of Polina Lemenkova. College of Marine Geo-Sciences, Ocean University of China. Qingdao, 04/11/2019. 31
Peru-Chile Trench
Peru-Chile Trench
Key result points on the Peru-Chile Trench:
I the most frequent depths for the Peruvian segment range from -4,000 to -4,200 (827 samples) vs range of -4,500 to -4,700m for the Chilean segment (1410 samples).
I the Peruvian segment of the Peru-Chile Trench is more deep and the geomorphology is more steep with abrupt slopes comparing to the Chilean segment.
I the highest frequency of the data for both segments, the following findings are notable: the Peruvian segment has the majority of the data (23%) reaching 1,410 (-4,500 to -4,700m are the most frequent values for the Peruvian segment).
I this peak shows steep pattern in data distribution, while other data in the neighbor diapason are significantly lower: 559 (-4,700 to -5,000 m) and 807 (-4,200 to -4,400 m) for the Peruvian segment.
I the Chilean segment has more even shape with unified data distribution for the depths -6,000 to -7,000 m.
Mid-Term PhD Thesis Presentation of Polina Lemenkova. College of Marine Geo-Sciences, Ocean University of China. Qingdao, 04/11/2019. 33
Hikurangi Trench
Figure 14:Topographic settings of the Hikurangi Trench.
Figure 15:Modeled cross-section profiles of the Hikurangi Trench
I Unique tectonic setting of the region consist in the connection of two subduction zones
I 2 subduction zones: N (Hikurangi margin) and S (Puysegur margin), connected by oblique continental collision along the Alpine Fault located in the South Island, NZ
I Connected by oblique continental collision along the Alpine Fault: South Island, NZ
I =>Variations in the submarine geomorphic structure of the trenches which is also referred as “subduction scissor”
I Puysegur/Hjort subduction is highly oblique (dextral) and directed southwards.
I Hikurangi subduction is directed northwestwards. The South Island is caught in between by “subduction scissor”.
Puysegur Trench
Figure 16:Geologic map: Puysegur and Hjort trenches
Figure 17:Modeled cross-section profiles of the Puysegur an Hjort trenches
I Puysegur subduction is highly oblique (dextral), directed S.
I PT: Bimodal way of DD : clear peaks at ranges -4,200 to -4,400 (373 s.) and at -3,200 to -3,000 m (140 s.).
I HT: histogram has classic ‘bell-shape’ form with one peak in DD at -3,300 to -3,500 m (364 s.).
I HT: equal DD (not oblique).
Mid-Term PhD Thesis Presentation of Polina Lemenkova. College of Marine Geo-Sciences, Ocean University of China. Qingdao, 04/11/2019. 35
Kermadec Trench
Kermadec Trench
Key points on the Kermadec (KT) and Tonga (TT) trenches:
I KT is located 120 km off the New Zealand with axis continues 26◦S – 36◦S [22]
I KT is the 5thworld’s deepest trench, max depth 10,177 m, length 1500 km [39]
I KT and TT closeness to the Antarctic => among the world’s coldest trenches [10]
I KT runs parallel to the Kermadec Ridge with geomorphology of V- shape formed by tectonic subduction of the Pacific Plate under the Indo-Australian Plate [45]
I KT extends from ca. 26◦to 36◦S near the NE tip of New Zealand’s North Island.
I The specific tectonic setting is the subduction of the PP at a rapid rate beneath the Indo-Australian Plate along the TT and KT
I A convergence at max rate (ca. 249 mm/yr) along the TK arc system => one of the world’s most seismically active subduction zones [11]
I TT is 2nddeepest trench in the world (max depths of 10,882 m) [13].
I KT and TT belongs to the South Pacific Subtropical Gyre (SPSG) biogeochemical province, has the same primary productivity rate of 87 g C m-2 y-1 [105]
I Both trench axes have roughly 30◦slight from the longitude line.
Mid-Term PhD Thesis Presentation of Polina Lemenkova. College of Marine Geo-Sciences, Ocean University of China. Qingdao, 04/11/2019. 37
Tonga Trench
Tonga Trench
Figure 20:Cross-section profiles of the Tonga and Kermadec trenches. [48]
Mid-Term PhD Thesis Presentation of Polina Lemenkova. College of Marine Geo-Sciences, Ocean University of China. Qingdao, 04/11/2019. 39
Tonga Trench
Key result points on the Tonga Trench:
I TT has shallower depths on the eastern part along but KT has more abrupt shape with 2,641 depth records s from -6,600 to -6,800m.
I TT geomorphology has steeper gradient slope on the western flank.
I TT deepest values > 9, 000m: 320 observation samples
I KT deepest values > 9, 000m: 251 samples => TT is deeper than KT.
I KT has more values in this range: 6167 samples. For the TT, the same range gives 4803.
I KT has more gentle slope shape form and shallower depths of the western slope off Tonga Ridge.
I Variations of the seafloor depths at range from -6,000 to -5,000.
I Variation between KT and TT illustrates tectonic and geological local settings => different sedimentation of the KT and TT => different geomorphic shape despite close location
Tonga Trench
Figure 21:Modeled gradient slopes of the profiles of the TT and KT. [48]
Mid-Term PhD Thesis Presentation of Polina Lemenkova. College of Marine Geo-Sciences, Ocean University of China. Qingdao, 04/11/2019. 41
Vanuatu Trench
Figure 22:Topographic map and location of the Vanuatu (New Hebrides) and Vityaz trenches
Key points on the formation of the Vanuatu (a.k.a. New Hebrides) Trench:
I located in Fiji Basin, East Australia
I area of the double convergent complex boundary
I PP subducts under the IAP westwards
I IAP subducts beneath North Fiji back-arc basin northeastwards.
I Complex geophysical settings, high seismicity, geodynamic complexity and instability of the region
I Vanuatu arc stretches ca. 1200 km in SW PO, 10◦S-23◦S, 160◦-180◦E.
I Vanuatu trench-arc system divides the NH back-arc troughs and active North Fiji marginal basin.
Vanuatu Trench
Figure 23:Modeled cross-sections of the Vanuatu (New Hebrides) and Vityaz trenches
Key points on the comparative analysis of the geomoprhic modelling of Vityaz and Vanuatu trenches:
I Vt has more flat wide bottom similar to a trough, with steeper gradient slope on the eastern flank.
I Vn has more V-form classic shape for the trench with gentle shapes on both western and eastern slopes.
I Vt has shallower depths with maximal not exceeding -5,000 m while Vn is more deep with -6,000 m.
I The surrounding relief of the Vn & Vt varies: Vt has the flat neighboring surface;
I Vn is surrounded by complex submarine relief of North Fiji Basin (its eastern flank) and its western flank
Mid-Term PhD Thesis Presentation of Polina Lemenkova. College of Marine Geo-Sciences, Ocean University of China. Qingdao, 04/11/2019. 43
Vityaz Trench
Figure 24:Geologic map and tectonic setting of the Vanuatu (New Hebrides) and Vityaz trenches
Key points on the Vityaz Trench:
I Vt has developed in a situation of complex tectonic settings.
I Tectonic plates convergence is marked by 2 opposite subduction zones, defined by the Vt (W) and the Tonga Trench (E)
I This results in an asymmetric opening of the North Fiji back-arc basin
I Subducting IAP and a subduction of the d’Entrecasteaux ridge => New Hebrides trench-arc system
I Southern NH Arc and NF Basin enlighten the geodynamic complexity and instability of the region
I Active volcano Mt. Yasur: located in Tanna Island of the Vanuatu arc
Vityaz Trench
Figure 25:Statistical analysis on the digitized cross-sections of the Vanuatu (New Hebrides) and Vityaz trenches
Key points on the statistical analysis of the Vt and Vn trenches:
I Bathymetry of the Vt is shallower: depths <-6,100 m; Vn reaches -7,000 m
I Vt: ’bell-shape’ with 2 peaks: -3,500 to -3,700 m, and -4,800 to -5,000 m
I Vt: the majority of values are within the range of -5,000 to -3,000 m.
I Vn: data distribution is even with slight increase of depths at -2,200 to -800 m (total 1,353 samples)
I Vt: 1605 samples (517, 653 and 435) at the first peak (-3,300 to -4,000) and 839 samples (238, 304, 297) at -4,500 to -5,200 m.
Mid-Term PhD Thesis Presentation of Polina Lemenkova. College of Marine Geo-Sciences, Ocean University of China. Qingdao, 04/11/2019. 45
New Britain Trench
New Britain Trench
Key points on the geology and tectonics of the New Britain Trench:
I The NBT (a.k.a. Bougainville Trench) is defined by the 6,000 m isoline [77]
I It is a narrow, 50-75 km wide trench extending NE from the E end of the Huon Gulf along the S coast of New Britain [77]
I Its name is derived from the New Britain Island from the New Britain arc
I Its W extension are: north-dipping Ramu-Markham fault zone, West Bismarck arc [1]
I The northern part is characterized by the Bismark Sea back-arc basin where active rifting and seafloor spreading take place [72]
I The Bismark Sea back-arc basin comprises the South and North Bismarck microplates separated by the Bismarck Sea fault [97]
I The islands of eastern Papua New Guinea and the Solomon Islands are island arc terranes, surrounding New Britain Trench, are formed adjacent to the boundary between the Australia and Pacific plates
I Woodlark Basin subducts beneath the Solomon Islands arc region, forming a double-sided subduction zone [106].
Mid-Term PhD Thesis Presentation of Polina Lemenkova. College of Marine Geo-Sciences, Ocean University of China. Qingdao, 04/11/2019. 47
New Britain Trench
New Britain Trench
Key points on the New Britain Trench:
I NBT is shallower comparing to the SCT : it has median values not exceeding -7,000m (vs -8,000 m median value for the SCT). SCT has 33◦slope oceanwards while 33,69◦landwards increasing in relief more direct on the oceanward side.
I NBT has more asymmetrical U-shaped cross-section dipping westwards with 35◦eastward slope, and 41◦westward slope
I The increase in depth by NBT is more gentle: in 50km segment it reaches 2000 m depths (from -7,000 to -5,000)
I The increase for the SCT is more abrupt: for the same distance (50 km) the depths rise from -8,000 to -5,200 m (that is, ca 3000 m).
I NBT has gentle slope on the Solomon Sea side. NBT is markedly asymmetric in the landward slope and has an arc form in E.
Mid-Term PhD Thesis Presentation of Polina Lemenkova. College of Marine Geo-Sciences, Ocean University of China. Qingdao, 04/11/2019. 49
San Cristobal Trench
San Cristobal Trench
Key points on the geographic and geological settings of the NBT and SCT:
I NBT and SCT are located eastwards off Papua New Guinea as northern borders of the Solomon Sea, Pacific Ocean
I SCT stretches in SE direction from the junction from the New Britain along the group of Solomon Islands Bougainville, Choiseul, Santa Isabel, Malaita until San Cristobal Island
I The region is one of the world’s active subduction zones at the triple junction of the Pacific, Indo-Australian and Solomon Sea
I Woodlark Basin, a young (ca. 5 Ma) oceanic basin that subducts beneath the NBT and Solomon Islands arc region forming a double-sided subduction zone. It is adjacent to the SCT to the SW and to the S of the Solomon Islands arc region
I The E part of the Solomon Plate (SP) bordering the SCT, enters the front of the Pacific Plate. It results in significant earthquakes along SP
I NBT and SCT region is situated within the complex zone of the convergence at the tectonic plates boundary and trapped between the converging Ontong Java Plateau and Australian continent.
I Geologically, the area of NBT and SCT belongs to one of the most prospective for intrusion-related mineral deposits
Mid-Term PhD Thesis Presentation of Polina Lemenkova. College of Marine Geo-Sciences, Ocean University of China. Qingdao, 04/11/2019. 51
San Cristobal Trench
Key result points on the NBT and SCT:
I there is distinct variability in depths by samples in two trenches.
I The SCT is generally deeper reaching -9,000m while median for NBT <-7,000m.
I The gradient slope of SCT is more symmetric with accurate ’V’ form.
I In a cross-section graph, the NBT landward slope is markedly asymmetric U-shaped form and has crescent form in the east.
I The NBT slope dips westwards with 35◦eastward, and 41◦westward, while SCT slope has 33◦oceanwards and 33,69◦landwards.
I The differences between the trenches are explained by the context of the historic and actual geomorphic and sedimentary processes affected their formation and structure.
Philippine Trench
Figure 29:Map of the region of Philippine Trench. Mapping: QGIS.
Mid-Term PhD Thesis Presentation of Polina Lemenkova. College of Marine Geo-Sciences, Ocean University of China. Qingdao, 04/11/2019. 53
Philippine Trench
Key points on the QGIS digitizing:
I The 1.000 km long profiles were drawn along the trench using ’Add Line Feature’ tool from the Digitizing Toolbar.
I The intersections between the lines and the bathymetry was done using ‘Vector / Analysis Tools / Lines Intersection’ command. This resulted in the array of the points along each profile. Each point has now a bathymetry depth value and a point reference number.
I Lat/lon coordinates were added to the attribute table of each intersection line of the profiles using plugin ’Lat Lon Tools / Conversion / Point layer to fields’.
I This added the 25 layer’s latitude, longitude (Y, X) and copied into the text fields in the new layers. I The topography was plotted using
’ProfileFromPoints’ plugin, along a profiles centerline using elevation Z (depths). I The attribute tables were exported from the QGIS
she files (’Export / Save Features As’) to csv format for each of the profiles.
I The results are shown left.
I The csv table was then further processed by Python and SPSS.
Philippine Trench
Figure 30:Letter-value plot (modified box plot) visualizing descriptive statistics of the topography of the cross-section profiles: mean, median, upper and lower quartiles of the data distribution. Plotting: Python, Matplotlib
Figure 31:Strip plots showing data distribution across tectonic plates (A) and geology (B). Plotting: Python.
Mid-Term PhD Thesis Presentation of Polina Lemenkova. College of Marine Geo-Sciences, Ocean University of China. Qingdao, 04/11/2019. 55
Philippine Trench
Figure 32:KDE plots for the 25 profiles crossing the Philippine Trench area. Plotting: Python libraries Matplotlib & Seaborn
The Kernel Density Estimation (KDE) analysis shows combining five plots of the bathymetric cross-section profiles. It shows range of the density distribution in the elevations across the Philippine archipelago and Philippine Trench.
Philippine Trench
Figure 33:Distribution of the samples from the cross-section profiles across tectonic plates. Plotting: Python, Matplotlib library and R (subplot in ’D’ shows correlation sediment thickness vs slope angles across profiles)
Mid-Term PhD Thesis Presentation of Polina Lemenkova. College of Marine Geo-Sciences, Ocean University of China. Qingdao, 04/11/2019. 57
Philippine Trench
Correlation matrix by Spearman method visualizing influence of the impact factors on the geomorphology of the profiles. Plotting: R.
Ranking geomorphology of the cross-section profiles. Plotting: R.
Philippine Trench
Key points on the ridgeline plot by R:
I To better understand the behavior of the spatial distribution in elevations as a stream view, a ridge line technics of the landforms data visualization using functionality of R was applied
I Ridgeline profiling shows comparative visualization of the density distribution of depths by profiles
I Graph provides insight into the statistical distribution of the depth and elevation ranges of the Philippine Trench and Philippine archipelago
I From these profiles (left), it is possible to comparatively analyze and observe distribution of an elevation values varied for 25 cross-section profiles.
Mid-Term PhD Thesis Presentation of Polina Lemenkova. College of Marine Geo-Sciences, Ocean University of China. Qingdao, 04/11/2019. 59
Philippine Trench
Key points on the regression analysis by R:
I For the assessment of the variation in the geomorphology of the trench, it is of significant advantage to visualize the data set using regression analysis (Fig. left).
I Regression analysis determines the range, general trend in data distribution and scale of the changes in the observed bathymetry by analyzing changes in the values of the elevation.
I The algorithms and approaches for the performed regression analysis use existing methods and embedded in {ggplot} library of R.
I Advantages of plotting a facetted graph consists in visualizing a stream of the data at one look.
Philippine Trench
I SPSS based statistical analysis is done by Graphs/Legacy Dialog menu
I box plots show the extreme values in the bathymetric and topographic elevations across the Philippine Trench and archipelago [53].
I 25 box plots include: min, max, 1st and 3rdquartiles, median, error bars
I Pairwise comparative analysis of sample distribution by two plates
I Philippine Sea plate max samples (profiles 21, 22 and 23: 765, 681 and 652 samples), SW Philippines [53].
I Sunda Plate has lesser samples: max for profile 25 (622).
Mid-Term PhD Thesis Presentation of Polina Lemenkova. College of Marine Geo-Sciences, Ocean University of China. Qingdao, 04/11/2019. 61
Philippine Trench
I variation of the data distribution for the geologic classes across 25 profiles
I qualitative analysis of the geological classes by the multi-plot visualization for comparative analysis
I graph shows mean values of the observation samples by separate variables (profiles 1:25) [53].
I topographic analysis by statistical plotting of data using the high-low charts, SPSS, [53]
I shows analysis of the depth ranges: summaries of variables by 25 profiles
Manila Trench
Key points on the Trench:
I located in South China Sea, west Pacific Ocean, west of islands Luzon and Mindoro, Philippines.
I located in the Manila subduction zone at the Philippine Sea plate boundary where it moves NW to the Eurasian plate with a high convergence rate [74]
I depth ca 5,400 m [73], stretches in almost vertical NS direction is created by the subduction of the Eurasian Plate (its part Sunda Plate) under the Philippine Sea Plate
I repetitive earthquakes, seismicity [104]
I frequent destructive tsunami hazard, by the subducting slab of the Eurasian plate beneath the MT => catastrophic damages along the coastlines of the Luzon Island.
Mid-Term PhD Thesis Presentation of Polina Lemenkova. College of Marine Geo-Sciences, Ocean University of China. Qingdao, 04/11/2019. 63
Manila Trench
Key points on the comparison between 2 segments of the trench (N and SE):
I S part of the trench has steeper slope gradient (oceanward)
I on the contrary, N part is steeper in the continental slope
I submarine terraces can be noted on the N segment of the trench at - 2,000 m.
I generally, the modelling of the N part shows more steep degree of the oceanward slope.
I a gradually slanting terrace on the S part of the trench can be seen on the fragment 50-100 of the cross-section at -1,100 to -1,300 m.
I N part is shallower comparing to the S yet more steep slope on the Luzon Island side.
Ryukyu Trench
Key points on the Trench:
I RT is 1400 km long, stretches along the SE edge of the Ryukyu Arc, between Taiwan & Kyushu [3].
I located to NW of the Ryukyu Arc, a back-arc basin and depression of the Okinawa Trough
I formed as a result of the subduction of the oceanic crust of the PSP beneath the continental crust of the EP [20].
I bathymetry varies in its N and S parts of RT: correlation bw. shape, gradient slope steepness, tectonics
I N: the subduction of the PSP is notable for shallow depths and steepness, reaches ca. 11◦.
I on the contrary, S: angle becomes steeper, reaching 70◦below ca. 70 km.
Mid-Term PhD Thesis Presentation of Polina Lemenkova. College of Marine Geo-Sciences, Ocean University of China. Qingdao, 04/11/2019. 65
Ryukyu Trench
Key points on the geology:
I double subduction system of the RT: PP subducts beneath the PSP, which is in turn subducts beneath the EP along the RT [24].
I RT reaches depths of 7000 m b.s.l.; forearc slope between the island chain and the RT is 130-160 km wide.
I N group: Yaku-shima and Tanega-shima and 200 km long Tokara Channel gap between the island groups [84].
I tectonics reflects evolutional processes of the building seamounts and the structure of the Earth’s crust.
I variations in the lithological patters, geological conditions of the rocks formation, stratigraphy, sedimentary of the ocean seafloor formation during J, M and C
Ryukyu Trench
Mid-Term PhD Thesis Presentation of Polina Lemenkova. College of Marine Geo-Sciences, Ocean University of China. Qingdao, 04/11/2019. 67
Ryukyu Trench
Key result points on the Ryukyu Trench:
I the median stacked profile on the S shows more gentle slope shape with submarine terraces
I there are no clear on northern part of the forearc slope
I At the same time the depth of the forearc slope increases in the N segment of the trench
I differences in the depth ranges along the Ryukyu Arc: max -5,500 to -5,700 m for N (334 samples).
I S: comparable values (329 samples) for the same depth range.
I significant differences for depths >6,000 m.
I S: has only few values (9 samples) with depths >6,800m while N shows 41, 59 and 23 records, with a max -7,460 m.
I Moderate to shallow depths with ranges -3,000 to -5,000 m for both N and S with values < 68 samples for N and 42 samples for S.
I The forearc basin deeper than 2,000 m and shallower than 1,000 m b.s.l.: more samples in the N than in the S.
Palau Trench
The Islands of Palau located W to the PT, composed of volcanic rocks capped by coral reef limestone => Palau islands were located along the volcanic front.
Key points on the Palau Trench:
I PT is located in the Philippine Sea, N from the Papua-New Guinea and E from the Philippines
I PT has greatest depth at 8,080 m (S), has straight geometric shape form
I PT stretches SW to NE, located within a square 133◦- 136◦E and 6◦-8◦N, east from the Yap Islands.
I PT uniqueness: short distance (35 km) between the trench axis and the coast of the Palau Islands W [43]
I PT geology: sequences of serpentinized peridotite, basalts, limestones, block of coral-reef limestones (4,900 to 6,500m) [43]
I PT is connected with the Kyushu-Palau Ridge (N) and Ayu Trough (S).
Mid-Term PhD Thesis Presentation of Polina Lemenkova. College of Marine Geo-Sciences, Ocean University of China. Qingdao, 04/11/2019. 69
Yap Trench
Key points on the Trench:
I YT is located in the Philippine Sea, N from the Papua-New Guinea and E from the Philippines.
I YT has the greatest depth at 8,292 m, is 700km long and 50km wide [88].
I YT stretches from the trench axis to Yap islands arc with a characteristic ’J’ form [46].
I YT is morphologically divided into the N and S parts with the the boundary between the two at 8◦260N [25].
I YT and PT are distinguished from the flat-bottomed Ayu Trough by their V shape.
Yap Trench
Key points on plate tectonics of the Yap and Palau trenches:
I PT and YT form a typical trench-arc-basin system which includes:
I deep trench,
I island arcs,
I back-arc basin (a Parece Vela Basin, located in the E side of the PSP).
I Such complex tectonic structure of the region is reflected in notable heterogeneity of the crustal and upper mantle velocity structures beneath the PSP [83].
I Necessarily, it affects the submarine seafloor topography and its geomorphology.
I The Yap-Palau subduction zone lies S off the Mariana arc-trench system.
I PT and YT are formed in the place of the PSP subduction and oceanic lithosphere sinking to the mantle.
I As the sinking PSP moves deeper into the mantle, the fluids are released from the mantle rock => melting of the the overlying mantle.
I The new magma rises to the surface and erupts violently forming volcanoes and arcs of islands along the convergent tectonic plate boundary.
I Therefore, earthquakes are common in subduction zone of PSP, YT and PT.
Mid-Term PhD Thesis Presentation of Polina Lemenkova. College of Marine Geo-Sciences, Ocean University of China. Qingdao, 04/11/2019. 71
Mariana Trench
Mariana Trench
Figure 35:Mindmap of the project: methods, concepts, approaches and tools. Plotting: LATEX [49]
Mid-Term PhD Thesis Presentation of Polina Lemenkova. College of Marine Geo-Sciences, Ocean University of China. Qingdao, 04/11/2019. 73
Mariana Trench
Figure 36:Mariana Trench crossing four tectonic plates. [54]
Mariana Trench
Figure 38:4 steps of the QGIS based digitizing of the trench profiles. [50]
Mid-Term PhD Thesis Presentation of Polina Lemenkova. College of Marine Geo-Sciences, Ocean University of China. Qingdao, 04/11/2019. 75
Mariana Trench
Figure 39:Cross-section profiles of the Mariana Trench
Key points on QGIS methodology of manual digitizing:
I Manual digitizing of the 25 bathymetric profiles across the trench: length 1000 km, a distance gap of 100 km, 518 sample points in each.
I Coordinates converted to UTM; reading depths of the samples into csv table.
Mariana Trench
Figure 40:Normalized steepness slope calculation of the cross-section profiles: R library {ggplot}, [98]. [60]
Mid-Term PhD Thesis Presentation of Polina Lemenkova. College of Marine Geo-Sciences, Ocean University of China. Qingdao, 04/11/2019. 77
Mariana Trench
Figure 41:Boxplots of the cross-section profiles: R based statistical analysis. [60]
Figure 42:Violin plots of the profiles: R based statistical plotting. [59]
I box plot & violit plot graphically displays summary on the statistical distribution of depths: frequencies, range and quartiles of samples across profiles
I plots shows: x-axis is measured variable (profiles); y-axis is frequency/count on depths
Mariana Trench
Figure 43:Scatterplot matrices of the factors affecting Mariana Trench formation: R based statistical analysis, [98]. [58]
Mid-Term PhD Thesis Presentation of Polina Lemenkova. College of Marine Geo-Sciences, Ocean University of China. Qingdao, 04/11/2019. 79
Mariana Trench
Figure 44:R based dendrogram tree of the 25 profiles. Left: unsorted, right: sorted. [61]
Mariana Trench
Figure 46:Ranking dot plots by data grouping: R based statistical analysis, libraries {ggalt} and {ggplot}. [56]
Mid-Term PhD Thesis Presentation of Polina Lemenkova. College of Marine Geo-Sciences, Ocean University of China. Qingdao, 04/11/2019. 81
Mariana Trench
Figure 47:Kernel Density Estimation (KDE) for the profiles bathymetry. Python libraries: Matplotlib, Seaborn, Pandas [85]. [55]
Mariana Trench
Quantile regression tested by Python library StatsModel. [52]
I quantile regression is tested by Python library StatsModel [85] for sediment thickness (m) versus geologic parameters [52]
I quantile regression (approach of the linear regression) shows the estimated conditional median and other quantiles of the response geological variables:
I the upper two rows of the plot show (subplots A, B, C, D) data distribution across tectonic plates: A) Pacific Plate; B) Philippine Plate; C) Mariana Plate; D) Caroline Plate; E)
Cumulative sediment thickness; F) Slope angle degree by profiles
I the lower row of the plot (subplots E, F) shows data distribution for the cumulative sediment thickness and slope angle degree by profiles.
Mid-Term PhD Thesis Presentation of Polina Lemenkova. College of Marine Geo-Sciences, Ocean University of China. Qingdao, 04/11/2019. 83
Mariana Trench
Mariana Trench
Figure 49:R based analysis of the submarine geomorphology if the Mariana Trench (steepness angles): unsorted (left); sorted and grouped (right), libraries {tidyverse} and {ggsignif}. [50]
Mid-Term PhD Thesis Presentation of Polina Lemenkova. College of Marine Geo-Sciences, Ocean University of China. Qingdao, 04/11/2019. 85
Mariana Trench
Figure 50:Partial regression analysis for the slope gradient in profiles by tectonic plates. Python library {StatsModels}
Mariana Trench
Figure 51:Data distribution analysis: ranges of the maximal depths. Python library {Matplotlib}
I The deepest part is in SW and C segments where trench crosses PSP and PP.
I Moderate depths correlate with MP and the majority of the PSP.
I The depths ranges higher in the S part than in N. Central part has variations in depth. General trend: increased depths to S
I Comparing the profiles Nr. 3, 4, 9, 12 (green) to profiles Nr. 18, 16, 15, 13 (orange) => depths increase up to max in the Nr. 20, 21, 19, 14, blue group).
I Max depths: Nr. 20, 21, 19, 14, min depths: Nr. 24, 23, 22, 10.
I Profile depth ranged from -10.600m to -3150m
Mid-Term PhD Thesis Presentation of Polina Lemenkova. College of Marine Geo-Sciences, Ocean University of China. Qingdao, 04/11/2019. 87
Izu-Bonin Trench
IBT a.k.a. Izu-Ogasawara Trench is located in west Pacific Ocean, lies south of Japan
Key points on the Izu-Bonin Trench (IBT):
I The Izu-Bonin Trench is boarded on the east by the Ogasawara Plateau [82]
I Longitudinally, it extends from near Tokyo, Japan to Guam [6]
I In its structure, IBT continues the JT. The Izu-Bonin Trench is formed in the area of active tectonic subduction of the Cretaceous (135 Ma) PP beneath the PSP [87]
I As a consequence of this subduction the following structured are formed (volcanic arc of the on the Izu-Bonin-Mariana Arc system):
I Izu Island
I Bonin Islands
Izu-Bonin Trench
Key points on the cross-sectioned profiles
visualized at two IBT segments: I S segment is deeper and hasmore accurate V-form with a steeper gradient slope on both slopes
I N segment has asymmetric shape of the slope with notable
submarine terrace on the W part and more straight shape on the oceanwards side
I S segment of the trench has Bonin Ridge distinguishable on the graph.
I Comparison of the oceanward flank of the both segments of the Izu-Bonin Trench show similar geomorphic shape but seamounts on the N
Mid-Term PhD Thesis Presentation of Polina Lemenkova. College of Marine Geo-Sciences, Ocean University of China. Qingdao, 04/11/2019. 89
Japan Trench
The Japan Trench is located in W part of the Pacific Ocean, E off Japan.
Geologic and tectonic settings are strongly influenced by subduction of the PP beneath Japan and NAP along JT [36].
Key points on the Japan Trench (JT):
I JT region is a convergent zone associated with earthquakes [108].
I JT belongs to circum-Pacific seismic belt ’Ring of Fire’ => large
earthquakes are in sedimentation area on upper forearc slopes [4].
I JT structure is a typical arc-trench system [75].
I JT arc-trench system is a type of the mobile belts with bathymetric and topographic relief formed under the impact of tectonic plates subduction, active volcanism, repetitive
earthquakes and orogenesis.
I Geological complexity of the JT results in the highly seismicity [37]; [71]; [14].
Japan Trench
Key points on the cross-sectioned profiles visualized at two JT segments:
rugged geomorphic structure of the median profiles and increased altitude in S-N direction on the N part
I N more steep slope on the continental slope part beneath the frontal wedge of the North American tectonic plate.
I S shows more gentle slope on the Honshu Island.
I 12 profiles were drawn for the southern segment and 14 profiles for the northern one.
I geological settings and seismicity of the area impact the trench roughness and general geomorphic shape
I W part of the trench profiles (Honshu Island slope) has steeper slopes comparing to the oceanward slopes for both segments
Mid-Term PhD Thesis Presentation of Polina Lemenkova. College of Marine Geo-Sciences, Ocean University of China. Qingdao, 04/11/2019. 91
Research Innovation
There are both theoretical and practical innovations of the presented research.
I The theoretical novelty lies in the comparative geomorphological mapping of the 20 Pacific hadal trenches that does not exists in the available literature.
I The practical novelty consists in the developed methodology of the sequential technological chain of processes: GMT, QGIS plugins, Python [85],
Matlab/Octave, AWK and R.
I Cartographic novelty consists in the developed and presented algorithm of the cross-section profiles digitizing and geomorphic modelling of the hadal trench modelling through the ’grdtrack’ (main) GMT module.
I Hadal trench present a complex system with highly interconnected factors affecting geomorphological structure, formation and development of the trench: slabs and tectonics plates, bathymetry, geographic location, geologic structure of the underlying basement and sediment thickness.
I Therefore, comparative analysis of the trenches of the Pacific Ocean requires advanced methods of data analysis for operating with large data sets, structuring, organizing and managing thematic information in a GIS database, linking data and creating map overlays [65], [62].
I Integrating multi-source data supports verification of the data precision and control. The most important geodata include GEBCO [79]; [80], SRTM [7], ETOPO1 [2], Goole Earth [66], CryoSat-2, Envisat, Jason-1 [86].
Research Significance and Justification
The significance and justification of this works consist in the following:
I Although ML has been significantly increased recently, using scripting and ML in cartography still remains lower comparing to the traditional GIS used in geosciences (e.g. [96], [40], [42], [41], [67], [95], [70], [21], [69], [68]).
I Seafloor mapping includes multiple steps in technological process which may include: Hydrosweep DS sonar echo-sounding [64], CARIS HIPS data processing [27], ArcGIS/ArcCatalog database management, GMT data processing [63].
I Accurate digitizing cross-section profiles using ArcGIS is slower comparing to the developed GMT-based automated digitizing. This is important for accurate geomorphological data analysis and crucial for better understanding of the seafloor landforms.
I GMT-based mapping provides accurate visualization of the seafloor [27]
I GMT-based mapping provides faster and preciser cartographic digitizing comparing to the traditional GIS.
I The traditional handmade (e.g. via QGIS) cartographic digitizing is a tedious monotonous slow-speed routine, might be prone to minor or major errors. Efforts in developing methodology in automatization in bathymetric mapping exists [90].
I The GMT based ML methodology ([103], [100]) enabled to make further steps in automatization of the cartographic techniques. This significantly improved the speed, precision and quality of the data modelling.
Mid-Term PhD Thesis Presentation of Polina Lemenkova. College of Marine Geo-Sciences, Ocean University of China. Qingdao, 04/11/2019. 93
Conclusion
I Precise, correct and up-to-date information about the geomorphology hadal trenches in the Pacific Ocean is necessary understanding marine geology, tectonics, seismicity, processes of sedimentation and geodynamic evolution of the seafloor [31], [32], [44], [30].
I Submarine geomorphological and bathymetric mapping plays a critical role in analysis of the geological structures of the seafloor, marine benthic habitats, navigation, geological drilling, modelling marine environment and other aspects of geosciences.
I Current studies contributed to the methodological testing and technical application of the advanced algorithms for seafloor modelling and mapping and to the geomorphological modelling.
I Tested, presented and explained functionality of the several GMT modules enables to do automated digitizing of the orthogonal profiles crossing trenches in the perpendicular direction. Through this modelling, the shape of the landforms and steepness gradient of the trenches were visualized, compared and statistically analyzed.
Thank you for attention!
Mid-Term PhD Thesis Presentation of Polina Lemenkova. College of Marine Geo-Sciences, Ocean University of China. Qingdao, 04/11/2019. 95
[1] L. D. Abbott, E. A. Silver, and J. Galewsky.“Structural evolution of a modern arc-continent collision in Papua New Guinea”.In: Tectonics 13 (1994), pp. 1007–1034 (cit. on p.47).
[2] C. Amante and B. W. Eakins.ETOPO1 1 Arc-Minute Global Relief Model: Procedures, Data Sources and Analysis.NOAA Technical Memorandum, 2009, p. 19.DOI:10.7289/V5C8276M(cit. on pp.8,92).
[3] M. Ando, A. Kitamura, Y. Tu, Y. Ohashi, T. Imai, M. Nakamura, R. Ikuta, Y. Miyairi, Y. Yokoyama, and M. Shishikura.“Source of high tsunamis along the southernmost Ryukyu trench inferred from tsunami stratigraphy”.In: Tectonophysics 722 (2018), pp. 265–276.
DOI:10.1016/j.tecto.2017.11.007(cit. on p.65).
[4] K. Arai, T. Inoue, K. Ikehara, and T. Sasaki.“Episodic subsidence and active deformation of the forearc slope along the Japan Trench near the epicenter of the 2011 Tohoku Earthquake”.In: Earth and Planetary Science Letters 408 (2014), pp. 9–15.ISSN: 0012-821X.DOI:10.1016/j.epsl.2014.09.048(cit. on p.90).
[5] J. Aubouin, J. Azéma, J. C. Carfantan, A. Demant, C. Rangin, M. Tardy, and J. Tournon.“The Middle America Trench in the Geological Framework of Central America”.In: Deep Sea Drilling Project Reports and Publications 67 (1982), pp. 747–755.DOI:
10.2973/dsdp.proc.67.141.1982(cit. on p.25).
[6] J. D. Barnes and S. M. Straub.“Chorine stable isotope variations in Izu Bonin tephra: Implications for serpentinite subduction”.In: Chemical Geology 272 (2010), pp. 62–74.DOI:10.1016/j.chemgeo.2010.02.005(cit. on p.88).
[7] J. J. Becker, D. T. Sandwell, W. H. F. Smith, J. Braud, B. Binder, J. Depner, D. Fabre, J. Factor, S. Ingalls, S. H. Kim, R. Ladner, K. Marks, S. Nelson, A. Pharaoh, R. Trimmer, J. Von Rosenberg, G. Wallace, and P. Weatherall.“Global bathymetry and elevation data at 30 arc seconds resolution: SRTM30_PLUS”.In: Marine Geodesy 32 (4 Nov. 2009), pp. 355–371.ISSN: 0149-0419.DOI:
10.1080/01490410903297766(cit. on pp.8,92).
[8] J. S. a. S. D. Behrmann, S. C. Cande, and ODP Leg 141 Scientific Party.“Tectonics and geology of spreading ridge subduction at the Chile Triple Junction: A synthesis of results from Leg 141 of the Ocean Drilling Program”.In: Geologische Rundscha 83 (1994), pp. 832–852 (cit. on p.31).
[9] J. P. Bello-González, E. Contreras-Reyes, and C. Arriagada.“Predicted path for hotspot tracks off South America since Paleocene times: Tectonic implications of ridge-trench collision along the Andean margin”.In: Gondwana Research 64 (2018), pp. 216–234.
ISSN: 1342-937X.DOI:10.1016/j.gr.2018.07.008(cit. on p.30).
[10] G. M. Belyaev.Deep-Sea Ocean Trenches and Their Fauna.Nauka Publishing House, 1989 (cit. on p.37).
[11] M. Bevis, F. W. Taylor, B. E. Schutz, J. Recy, B. L. Isacks, S. Helu, R. Singh, E. Kendrick, J. Stowell, B. Taylor, and S. Calmant.
“Geodetic observations of very rapid convergence and back-arc extension at the Tonga arc”.In: Nature 347 (1995), pp. 249–251 (cit. on p.37).
[12] P. Bird.“An updated digital model of plate boundaries”.In: Geochemistry Geophysics Geosystems 4 (3 2003).ISSN: 1525-2027.
DOI:10.1029/2001GC000252(cit. on p.13).
[13] L. E. Blankenship, A. A. Yayanos, D. B. Cadien, and L. A. Levin.“Vertical zonation patterns of scavenging amphipods from the Hadal zone of the Tonga and Kermadec Trenches”.In: Deep-Sea Research I 53 (2006), pp. 48–61.DOI:
10.1016/j.dsr.2005.09.006(cit. on p.37).
[14] B. Boston, G. F. Moore, Y. Nakamura, and S. Kodaira.“Forearc slope deformation above the Japan Trench megathrust: Implications for subduction erosion”.In: Earth and Planetary Science Letters 462 (2017), pp. 26–34.ISSN: 0012-821X.DOI:
10.1016/j.epsl.2017.01.005(cit. on p.90).
[15] A. Brandt, I. Alalykina, H. Fukumori, O. Golovand, K. Kniesz, A. Lavrenteva, A.-N. Lörz, M. Malyutina, K. Philipps-Bussau, and B. Stransky.“First insights into macrofaunal composition from the SokhoBio expedition T (Sea of Okhotsk, Bussol Strait and northern slope of the Kuril-Kamchatka Trench)”.In: Deep-Sea Research Part II 154 (2018), pp. 106–120.DOI:
10.1016/j.dsr2.2018.05.022(cit. on p.12).
[16] E. Contreras-Reyes, I. Grevemeyer, E. R. Flueh, and C. Reichert.“Upper lithospheric structure of the subduction zone offshore southern Arauco Peninsula, Chile at 38◦ S”.In: Journal of Geophysical Research 113 (B07303 2008), pp. 1–10.DOI:
10.1029/2007JB005569(cit. on p.30).
[17] E. Contreras-Reyes, I. Grevemeyer, E. R. Flueh, M. Scherwath, and M. Heesemann.“Alteration of the subducting oceanic lithosphere at the southern central Chile trench-outer rise”.In: Geochemistry Geophysics Geosystems 8 (Q07003 2007), pp. 1–10.
DOI:10.1029/2007GC001632(cit. on p.31).
[18] E. Contreras-Reyes and A. Osses.“Lithospheric flexure modeling seaward of the Chile trench: implications for oceanic plate weakening in the Trench Outer Rise region”.In: Geophysical Journal International 182 (1 2010), pp. 97–112.DOI:
10.1111/j.1365- 246X.2010.04629.x(cit. on p.31).
[19] E. Contreras-Reyes, J. Jara, A. Maksymowicz, and W. Weinrebe.“Sediment loading at the southern Chilean Trench and its tectonic implications”.In: Journal of Geodynamics 66 (2013), pp. 134–145.ISSN: 0264-3707.DOI:
10.1016/j.jog.2013.02.009(cit. on p.31).
[20] W.-B. Doo, C.-L. Lo, W.-N. Wu, J.-Y. Lin, S.-K. Hsu, Y.-S. Huang, and H.-F. Wang.“Strength of plate coupling in the southern Ryukyu subduction zone”.In: Tectonophysics 723 (2018), pp. 223–228.DOI:10.1016/j.tecto.2017.12.028(cit. on p.65).
[21] A. D. Dumnov et al.Nacional’nyj Atlas Rossii. Priroda. Jekologija. (National Atlas of Russia. Nature. Ecology).Russian. Ed. by V. M. Kotlyakov. Vol. 2. Institute of Geography, Russian Academy of Science (RAS), Moscow, Russia: PKO Kartografiya, 2007. 496 pp.ISBN: 5-85120-250-5.URL:https://elibrary.ru/item.asp?id=23676880(cit. on p.93).
Mid-Term PhD Thesis Presentation of Polina Lemenkova. College of Marine Geo-Sciences, Ocean University of China. Qingdao, 04/11/2019. 97
[22] R. A. Duncan, T. L. Vallier, and D. A. Falvey.“Geology and Offshore Resources of Pacific Island Arcs; Tonga Region”.In: ed. by D. W. Scholl and T. L. Vallier. Houston, TX, United States: Circum-Pac. Counc. Energy and Miner. Resour., 1985. Chap. Volcanic episodes at Eua, Tonga Islands, pp. 281–290 (cit. on p.37).
[23] G. Ekstrom and E. R. Engdahl.“Earthquake source parameters and stress distribution in the Adak Island region of the central Aleutian Islands, Alaska”.In: Journal of Geophysical Research 84 (1989), pp. 15499–15519 (cit. on p.21).
[24] C. Faccenna, A. F. Holt, T. W. Becker, S. Lallemand, and L. H. Royden.“Dynamics of the Ryukyu Izu-Bonin-Marianas double subduction system”.In: Tectonophysics (2018), pp. 229–238.ISSN: 0040-1951.DOI:10.1016/j.tecto.2017.08.011(cit. on p.66).
[25] T. Fujiwara, C. Tamura, A. Nishizawa, K. Fujioka, K. Kobayashi, and Y. Iwabuchi.“Morphology and tectonics of the Yap Trenches”.
In: Marine Geophysical Research 21 (2000), pp. 69–86 (cit. on p.70).
[26] C. Gaedicke, B. Baranov, N. Seliverstov, D. Alexeiev, N. Tsukanov, and R. Freitag.“Structure of an active arc-continent collision area: the Aleutian-Kamchatka junction”.In: Tectonophysics 325 (2000), pp. 63–85 (cit. on p.21).
[27] S. Gauger et al.“Swath-bathymetric mapping”.In: The expedition ANTARKTIS-XXIII/4 of the Res. Vessel ’Polarstern’ in 2006. Berichte zur Polar- und Meeresforschung // Reports on Polar and Marine Research 557 (2007). Ed. by K. Gohl, pp. 38–45.ISSN: 1618-3193.DOI:10.6084/m9.figshare.7439231. HAL:hal- 02022076.URL:
https://www.coldregions.org/vufind/Record/288392. In English Ant. Acc. No.: 85104. CRREL Acc. No.: 63000887; illus., incl. sketch maps (cit. on p.93).
[28] J. Geersen.“Sediment-starved trenches and rough subducting plates are conducive to T tsunami earthquakes”.In: Tectonophysics 762 (2019), pp. 28–44.DOI:10.1016/j.tecto.2019.04.024(cit. on p.31).
[29] J. Geersen, D. Voelker, and J. H. Behrmann.“Submarine Geomorphology”.In: ed. by J. Geersen. Springer, 2018. Chap. Oceanic Trenches, pp. 409–424 (cit. on p.31).
[30] K. Gohl et al.Deep crustal refraction and reflection seismics. Crustal and sedimentary structure and geodynamic evolution of the West Antarctic continental margin and Pine Island Bay.Bremerhaven, Germany: Alfred Wegener Institute, 2006, pp. 20–30.DOI:
10.6084/m9.figshare.7439243.URL:https://epic.awi.de/29852/1/PE_75.pdf. Expedition program No. 75 of ANT-XXIII/4 Cruise 11-12 (cit. on p.94).
[31] K. Gohl et al.“Tectonic and Sedimentary Processes of the West Antarctic Margin of the Amundsen Sea Embayment and Pine Island Bay”.In: 2nd Open Science Conference and 29th SCAR on ’Antarctica in the Earth System’ (July 12–14, 2006). Hobart, Tasmania, Australia, July 2006.DOI:10.6084/m9.figshare.7435484.v1.URL:https://www.scar.org/events/(cit. on p.94).

![Figure 3: Cross-section bathymetric profiles across the Kuril-Kamchatka Trench. [47]](https://thumb-eu.123doks.com/thumbv2/123doknet/14716796.750305/16.544.115.438.65.331/figure-cross-section-bathymetric-profiles-kuril-kamchatka-trench.webp)


![Figure 18: Topographic map and location of the Kermadec and Tonga trenches. [48]](https://thumb-eu.123doks.com/thumbv2/123doknet/14716796.750305/37.544.150.399.84.318/figure-topographic-map-location-kermadec-tonga-trenches.webp)
![Figure 19: Geologic settings of the Kermadec and Tonga trenches. [48]](https://thumb-eu.123doks.com/thumbv2/123doknet/14716796.750305/39.544.107.457.75.334/figure-geologic-settings-kermadec-tonga-trenches.webp)
![Figure 20:Cross-section profiles of the Tonga and Kermadec trenches. [48]](https://thumb-eu.123doks.com/thumbv2/123doknet/14716796.750305/40.544.115.438.75.342/figure-cross-section-profiles-tonga-kermadec-trenches.webp)
![Figure 21: Modeled gradient slopes of the profiles of the TT and KT. [48]](https://thumb-eu.123doks.com/thumbv2/123doknet/14716796.750305/42.544.101.447.66.335/figure-modeled-gradient-slopes-profiles-tt-kt.webp)
