DOI 10.1007/s11558-007-9020-3
Referendums in the EU’s constitution building process
Simon Hug· Tobias Schulz
Received: 7 September 2006 / Revised: 2 November 2006 / Accepted: 1 March 2007 / Published online: 26 April 2007 © Springer Science + Business Media, LLC 2007
Abstract In ten member states of the European Union (EU) the new con-stitutional treaty was supposed to be ratified by referendum. A growing number of theoretical models predicts that such additional ratification hurdles result in an advantage for negotiators in the bargaining game. The impact such a referendum constraint can exert, however, depends on the timing of its announcement, the remaining ratification rules as well as the preference constellations. If parliament and voters are actually in favor of the new treaty, ratification constraints may cease to affect the bargaining outcome. After presenting the theoretical foundation of these arguments, we present empirical
This article emanates from the DOSEI (Domestic Structures and European Integration) project funded by the European Union in its Fifth Framework program and directed by Thomas König (Universität Speyer) and relies on an earlier version prepared for
presentation at the DOSEI Final Conference (Brussels, Belgium; June 19–22, 2005) and the conference “The EU’s constitution-building process: From high hopes to ratification failure and beyond” (Zürich June 30–July 1, 2006). Participants at this conference, and especially Helen Milner, and two anonymous reviewers provided much appreciated comments. Irena Brinar, Mark Chandler, Michelle Cini, Béla Jankya, Leszek Jesien, and Andris Runcis provided invaluable help in locating EU treaties in the languages of the new member countries. We gratefully acknowledge the able research assistance of Ladina Caluori, Barbara Gähwiler, Ursula Häfliger, Annika Raudonat, and the financial support of the Swiss
Bundesamt für Bildung und Wissenschaft (Grant number BBW Nr 02.0313) and the Grundlagenforschungsfonds of the University of St. Gallen (Grant number G12161103).
S. Hug (
B
)· T. SchulzInstitut für Politikwissenschaft, Universität Zürich, Hirschengraben 56, 8001 Zürich, Switzerland e-mail: [email protected]
T. Schulz
e-mail: [email protected]
S. Hug· T. Schulz
evidence much in line with the theoretical implications. More specifically, especially for the issues changed during the intergovernmental conference, those governments gained that had scheduled a referendum and voters had a stronger preference for the status quo.
Keywords Negotiations· Referendums · Two-level games
JEL Codes K33· H77 · D72
1 Introduction
The negative outcomes of the referendums in France and the Netherlands, followed by the decided suspension of the referendums in Great Britain and the anticipated suspension in Denmark,1 has at least temporarily halted the ratification of the “Treaty Establishing a Constitution for Europe.”2 These events, combined with the unprecedented number of referendums scheduled on this treaty, illustrate the increasing importance of popular input in ratifica-tion processes of internaratifica-tional treaties, at least in the European Union (EU). The negative outcomes of the referendums in France and the Netherlands also provide ample illustration of so-called “involuntary defections” (e.g., Schelling
1960; Iida1996) in the ratification of international treaties.
While these topical events raise the question of what will happen to the EU-constitution, and how the two countries having experienced a negative referendum outcome will deal with their rejection, our focus will be on how expectations of such possible ratification accidents may have affected the negotiations on the EU constitution. Ratification accidents may obviously happen in different arenas, but given the considerable number of referendums having been scheduled on the EU-constitution, the focus of this article will be on the impact of popular consultations. Needless to say, assessing the impact of these referendums requires controlling for the possible impact of the other ratification hurdles.3
The argument that the hurdles raised by the domestic ratification proce-dures may affect the bargaining outcome is prominent in the literature on two-level games (e.g., Schelling1960; Putnam1988; Iida1993; Schneider and Cederman 1994; Mo 1994; Milner and Rosendorff 1996). Empirical studies
1The British government has suspended the discussion of the bill that would have led to a
referendum (Financial Times, June 7, 2005, 1), while the Danish government is still hesitating (Neue Zürcher Zeitung, June 11, 2005, 3). At the time of writing 15 member countries have ratified the EU constitution (Source:http://europa.eu.int/constitution/ratification_en.htm(accessed June 24, 2006), while the member states have decided to keep on hold the treaty for another year (Financial Times June 16, 2006, 3).
2This is the official name of what we will refer to as EU-constitution in what follows.
3In previous work (Hug and Schulz2005), we did not control for these other hurdles. In addition,
in this article we also address more specifically the problem whether particular gains might be due more to “luck” than “power” (Barry1980a,b).
(e.g., Evans et al.1993; Milner1997; König and Hug2000; Hug and König2002,
2006b; Mertah and Pahre 2005), however, are largely hampered by the
con-siderable demands put on the amount and quality of information on various aspects of the negotiation and the ratification stages.4Hence, it cannot surprise that few studies have found systematic and consistent evidence in support of implications from two-level games.
Drawing on a wealth of information coming from diverse sources, this article offers an assessment of how referendums scheduled for the ratification of the EU-constitution have affected the bargaining over this new treaty. We find evidence that countries having announced a referendum before the conclusion of the Intergovernmental Conference (IGC) in Brussels in June 2004 made significant gains in the last phases of the negotiations, depending on the voters’ preferences.
We proceed as follows. In the next section we start by discussing the theoret-ical background allowing us to derive hypotheses on the effect of ratification constraints on negotiation outcomes. Given that we derive these hypotheses from spatial models, their empirical tests also require a spatial representation of the various actors’ positions. Thus, in section three we discuss the way in which we derive a common bargaining space in which the positions of the relevant ratifying actors may be mapped. This spatial representation, based on data collected in the DOSEI-project (“Domestic structures and European Integration”),5 allows us to derive information on negotiation gains, ratifica-tion constraints etc. In secratifica-tion four we discuss the instituratifica-tions under which the ratifications in the various member countries occurred, as well as the timing of the decision to launch a referendum. The former is crucial information to assess whether the governments were constrained by the requirements of the parliamentary ratification process. The latter is necessary to determine the effect of referendums on the possible gains realized by negotiators. Based on this information we propose in section five empirical tests of our theoretically derived implications on the effects of referendums on negotiation gains. In section six we conclude.
2 Theoretical Models on the Effect of Ratification Processes and Referendums
At least since Schelling’s (1960) influential work scholars try to understand how ratification constraints may affect the power of negotiators.6 Putnam’s (1988) article provided a first attempt to formalize negotiations followed by domestic ratification processes to understand their possible effects. This article
4Hug and König (2002) discuss these requirements in detail, as does Pahre (2005) from another
perspective.
5seehttp://dosei.dhv-speyer.de.
spawned a series of studies attempting to understand various aspects of these two-level games (e.g., Iida 1993; Schneider and Cederman 1994; Mo 1994; Milner and Rosendorff1996; Tarar2001,2005; Dai2002; Butler2004). While many of these articles came to rather strong predictions concerning the effect of ratification constraints, the systematic evaluation of all possible preference profiles by Hammond and Prins (2006) alerted scholars to the contingency of many of these results.7
In addition, these formal models are limited in ways that make them difficult to apply to many recent international negotiations. On the one hand, almost all models focus on bilateral negotiations, which are hardly characteristic of most negotiations taking place in the EU context, for instance. On the other hand, most formal models systematically restrict their bargaining space to a one-dimensional line.8While this one dimension may represent the contract curve derived from a multi-dimensional bargaining space in a bilateral negotiation, this shortcut is no longer available in multilateral negotiations.
Recent advances in theoretical models on multilateral bargaining allow, however, to derive implications for the effect of ratification constraints under empirically more realistic assumptions.9Almost systematically, the “multiplic-ity of subgame perfect equilibria” (Muthoo 1999, 337) in these bargaining models with more than two players is either circumvented with a restriction of the bargaining protocol (e.g., Chae and Yang1988,1994; Baliga and Serrano
1995; Krishna and Serrano 1996) or the assumption of stationary strategies (e.g., Merlo and Wilson1995; Winter1996; Banks and Duggan2000).
While the multiplicity of equilibria in multilateral bargaining situations is a first complication, an additional one becomes especially relevant for international negotiations whose outcomes require ratification, namely the nature of the bargaining good. While in bilateral negotiations, the contract curve may either reflect an underlying private good, like a dollar, or a public good, this simple equivalence does no longer hold in multilateral negotiations. Hence, the distribution of the bargaining gains domestically has to be assessed explicitly in the case of negotiations over a private good.10
7Hug and König (2002) illustrate these contingent effects in their study on the negotiations on the
Amsterdam treaty.
8The only exception to this we are familiar with is Gilligan’s (2004) model, which focuses on
multilateral negotiations in a multidimensional space. The model deals, however, not with the ratification constraints directly, but focuses on the issues of compliance at the domestic level. Hammond and Prins (2006) also consider a two-dimensional model, but are unable to derive general results, while Mansfield et al.’s (2000) model focuses on bilateral bargaining in a two-dimensional space, but, as Dai (2002) rightly criticizes, restricts the set of possible bargaining outcomes.
9Still at the end of the 1990s the author of a leading textbook on bargaining models argued that “...
the literature on multilateral and coalitional bargaining that uses... game-theoretic methodology... is extremely small (albeit growing) and under-developed” (Muthoo1999, 336).
10Tarar (2005) rightly argues that even in bilateral negotiations the nature of the bargaining good
Based on Tarar’s (2001) model for bilateral negotiations, Hug (2004) pro-poses an extension covering negotiations over a private good among three negotiators. While some of Tarar’s (2001) results carry over to this multilateral bargaining situation, others do not. More precisely, in trilateral negotiations ratification constraints are profitable for all participant negotiators as long as the former are not mutually incompatible. In addition, however, it is the initiator of the negotiations who is likely to reap the largest gains.11
Negotiations over a public good are more easily formalized in Banks and Duggan’s (2000) general bargaining model.12 Hug (2004) links Banks and Duggan’s (2000) model for negotiations on public goods under a unanimous decision rule with possible ratification constraints. This attempt illustrates and underlines that under these modeling assumptions no general conclusions are possible, except that the initiator of the bargaining process may reap any remaining spoils. Whether particular ratification constraints will strengthen the bargaining positions of particular negotiators depends on the relative location of the reversion (or status quo) point and the positions of the various negotiators and domestic ratification agents.
Nevertheless, as general insight may serve the result that domestic con-straints may strengthen the bargaining position of particular countries de-pending on the preference configuration. In addition, the advantage of the initiator of the bargaining process, first derived by Rubinstein (1982), seems also to be a rather robust result. The question arises, however, whether referendums as a last stage of a ratification process have specific additional effects. The important distinction here is between normal ratification proce-dures for international treaties and proceproce-dures that change over the course of a negotiation.13If normal ratification procedures allow or require a referendum, for instance in France or Denmark,14then this institutional element combined with the preferences of the voting population forms an additional ratification constraint.15 More complicated is the situation when constitutions allow for referendums on unspecified topics or if countries announce referendums without relying on specific constitutional foundations. In that case, the effect of these additional ratification hurdles is likely to be determined by the timing of launching a referendum. If a referendum is triggered before the end of the negotiations, we may presume that an additional ratification hurdle is erected. If the referendum is triggered after the end of the negotiations, like for instance the French referendum on the EU-constitution, we would expect few if any effects on the bargaining outcome.
11These results are based on a model of negotiations over a private good, where the gains
are shared with the whole population. In Tarar’s (2001) conception this would correspond to a presidential system, where the president has the goal to get reelected.
12Gilligan (2004) also builds on this very general model.
13Milner (1997) discusses ratification constraints that vary over time. 14We discuss these institutional provisions in more detail below.
15Hug (1997) (see critique by Feld1997), as well as Feld et al. (2002), Hug (2002), and Feld and
Kirchgässner (2004) discuss formal models dealing specifically with referendums on international treaties, mostly in the context of European integration.
Thus our current theoretical knowledge would suggest the following hypotheses:
Hypothesis 1 Countries with an electorate preferring the status quo and a
referendum announced before the end of the IGC realize more negotiation gains, independent of the other domestic ratification constraints.
Hypothesis 2 Independent of the domestic ratification constraints, the initiator
of the negotiations reaps more gains than the other negotiators.
3 Deriving the Bargaining and Ratification Space
To test our hypotheses, we need information on the bargaining positions of three different sets of actors as well as relative positions for the three policy positions corresponding to the status quo, the draft constitution and the final IGC outcome. First, we obviously need information on the positions that the national governments hold on the issues raised by the constitution project. In addition, we also must be able to evaluate these positions relative to the final constitutional treaty, the draft constitution presented by the Laeken Convention as well as the status quo (i.e. the (Nice-)consolidated versions of the Treaty on European Union (TEU) and the Treaty establishing the European Community (TEC)). Second, relative to these positions we must be able to establish the positions of the respective electorates, since our main interest is in assessing the influence of the referendum constraint. Third, we also have to take into account the preference constellation in the national parliaments. This is only possible if we are able to gain information about the positions of national parties holding seats in the parliaments. The parlia-mentary ratification stage is a crucial control variable within our model that cannot be dismissed. Given that no single data-source covers all three sets of policy positions, we must link the political positions derived from three different sources.
We derive the positions of the governments from an expert survey carried out in the DOSEI-project,16 whereas for the positions of the median voters we rely on mass survey data, namely the Eurobarometer-data.17In addition,
16This survey elicited from experts the government positions on the contentious issues in the
bargaining process. The list of questions used in this article is listed in Table12in the appendix, while the contributions in König and Hug (2006) discuss the results by country.
17Our analysis is based on the EB 60.1 for the old member states and on the CCEB 2003.4 for the
new member states. The Eurobarometer-data is aggregated on the national level, by determining the median response category for each national electorate. These median positions were unique for all countries, except Italy, where for one question the same number of respondents chose one of the two answer categories. We have employed both of these median values in the subsequent analyses, but we will report only the results of one of these analyses here. The result of the second analysis yields similar results.
we employ party manifestos for the 2004 European Parliament Election to determine the positions of the political parties in the national parliaments.18 As a control, we also estimate the parties’ position on the EU-constitution by aggregating the responses of their voters to the question whether they are in favor of a constitution or not.19
Having the basic ingredients for our empirical tests, the next question relates to how we test our hypotheses. More precisely, we have to determine what the relevant bargaining and ratification spaces are. There are basically two main strategies how to proceed at this stage. First, we could assume that the dimen-sionality of the bargaining space corresponds to the set of main issues debated during the negotiations.20The drawbacks of this approach are that we have to assume that the various issues are dealt with independently of each other,21 and given the data restriction, we would need to make strong assumptions concerning the ratification space. The advantage, on the other hand, is that we can more easily control for the overall preference configuration. Second, we could assume that the relevant bargaining and ratification spaces are similar (if not identical), and thus carry out our analysis in one common space. The disadvantage of this approach is that it is much more difficult to control in our analysis for the general preference configuration. On the other hand, we explicitly allow for (and actually assume) issues to be dependent on each other. The solution we choose attempts to combine both approaches. We first follow a twofold strategy to combine these datasets: In a first step we matched the information contained in the two surveys into a common space before in a second step, the party manifestos may be used to determine the party positions relative to the constitutional projects and the status quo. The combination of the two survey-datasets must rely on a dimensional analysis of the data,22since we do not have exactly the same information for the governments’ and voters’ positions.
18The party manifestos of the old member states have been made available to us by Manfred G.
Schmidt, to whom we wish to express our gratitude. The manifestos of the remaining countries have been collected in a joint effort of the scholars engaged in the DOSEI-project.
19Unfortunately, the resulting indicator has no variance whatsoever, suggesting that the
Constitu-tion would be ratified by the parliaments of all member countries according to the specified rules. Only if we consider the relevant criterion for Denmark the 5/6 majority, do we find one parliament where the expected outcome would be negative.
20The presumption here would be that our expert survey has covered all the relevant issues. 21Obviously there are (imperfect) ways to address the dependence of these various issues. 22In both datasets the variables are ordinal and therefore a factor analysis based on a linear
relationship is inappropriate. We therefore employed a factor analysis for ordinal variables developed by Martin and Quinn (2004) which is discussed by Quinn (2004) in more detail. This factor analysis relies on Bayesian statistics and the mean of the posterior distribution can be interpreted as the maximum-likelihood estimate under the assumption of uninformative priors (Jackman2004). Hix and Crombez (2005) propose different ways in which policy spaces might be derived for the data stemming from the expert survey, while our approach is discussed in more detail in Hug and Schulz (2005).
First Dimension Second Dimension – 0.1 0.0 0.1 – 0.05 0.00 0.05 0.10
upper case: voters lower case: national positions
Fig. 1 Matched spaces of the DOSEI- and EB60.1/CCEB2003.4-data, full set of EB questions
The matching of the two two-dimensional policy spaces we obtain from the factor analysis23 is straightforward if the three outcomes (the status quo, the draft constitution and the IGC result) are included in each dataset by assigning the survey answer categories for each issue of the dataset.24Because this results in three observations that the two datasets now have in common, we can use the positions of these three common points as anchors to map the positions of the voters into the policy space of the governments. The rotation and stretching of the space of the electorates are done by regressing the two coordinates of each anchor in the voters’ space on each dimension of the anchors in the governments’ space.25Figure1depicts the resulting bargaining space. As the information provided in the appendix shows, the first dimension is mostly related to policy issues in the areas of taxation, cohesion policies, but
23Ideally, we would have determined the dimensionality of the bargaining space on the basis of
an information criterion covering the whole analysis. Unfortunately, the factor analysis of ordinal variables we employ (Quinn2004) fails to yield the relevant information to calculate, for instance, a Bayes factor. Instead of this we assessed the “fit” of various bargaining spaces with different dimensionalities by assessing how well the corresponding factor scores predicted the responses on the various issues. Especially for the expert survey data we found that the average value of the Akaike information criterion drops considerably from a one-dimensional space to a two-dimensional space. Increasing the two-dimensionality from two to three or four, however, fails to change this average value. The results of these additional analyses will be made available on our website.
24In Table13in the appendix this coding is listed for the Eurobarometer-data.
25The technical details on this simple procedure are discussed in more detail by Hug and Schulz
(2005). The validity of this matching procedure is highly dependent on the similarity of the structure of the data in the two datasets. Clearly, the relative positions of the three policy outcomes across the data sources should be very similar as should the dimensions that have been established. Hug and Schulz (2005) compare the factor loadings of the two dimensional analyses in detail, so that we only list the relevant questions from the two sources in the appendix (Tables12and13).
also institutional questions. The second dimension, on the other hand, relates mostly to the role of the European parliament.
Once we have a common space for voters and national governments, we need to determine the relative position of the parliamentary actors, namely the political parties.26 In previous analyses (e.g., Hug and König 2002; König and Luetgert2003; Schulz2003), this information has been extracted from mass surveys, since there used to be questions on the party affiliation in earlier Eurobarometer-surveys. Unfortunately, party affiliation is no longer systematically available,27 forcing us to rely on other sources. One easily available source for information on party positions are party manifestos. Since most parties in the European member states (including the new members) published manifestos related to the European Parliament (EP) Elections of 2004,28 analyzing such texts should generate relatively valid estimates of a party’s position toward the content of the constitutional treaty. Given that a hand-coding of these texts is resource intensive, we rely on a computer-assisted coding using the Wordscores methodology proposed by Laver et al. (2003).29
The Wordscores methodology relies on a-priori reference scores that must be assigned to a-priori chosen reference texts against which the remaining texts (virgin texts) will be compared and scored. It is well suited for our purpose, i.e. to integrate the party positions into the two-dimensional bargaining space. To this end, we first have to choose the positions of the status quo, the IGC and the Draft Constitution on both dimensions as reference scores. What re-mains to be found are reference texts that define these three points extensively. We have chosen to rely on the original treaties but we used only those parts of these texts that correspond to the issues that appear in our expert survey.30The results of this scoring-strategy are listed in Table14in the appendix. All in all,
26Here we assume that the political parties are very disciplined and thus can be considered as
unitary actors.
27The EB 60.1 does not include information on party affiliation while the CCEB 2003.4 does. The
most recent Eurobarometer for the old member states (EB 61) does provide such information for the European Parliament election and so does the corresponding dataset for the new members (CCEB 2004.1). Important items, however, for example the questions on competence delegation for 25 policy fields, are missing in this questionnaire. Since this has, as we show in Hug and Schulz (2007), severe consequences for the dimensional analysis, we refrain from using the more recent Eurobarometer-dataset. We also assess on the basis of a question concerning a likely vote on the EU constitution to assess whether particular parties were in favor or not. Using this information to determine the likelihood of ratification in parliament suggested, however, that in all parliaments the required majorities would have been achieved.
28We employ the party manifestos for the EP elections instead of those for national elections
for several reasons. First, most manifestos for the EP elections, contrary to those for national elections, contained statements on the constitutional treaty or at least on the way in which the EU should develop. Second, using manifestos for national elections would have created a problem of timing, since the national elections occur at different times. This would have resulted in the texts referring to proposals made at very different points in time. Finally, contrary to König and Finke (2007) (in this issue), we also refrained from using data from expert surveys, since the link to positions on the constitutional treaty is tenuous at best.
29Benoit et al. (2005) apply the same methodology in their analysis of contributions to the
European convention.
Table 1 Ratification of international treaties
Parliamentary chambers
1 2+
Simple majority MT, UK BE, IT, NL, IE
Qualified majority AT(2/3), CY(2/3), DK(5/6), EE(3/5), EL(3/5), FI(2/3), HU(2/3), LT(2/3), LU(2/3), LV(2/3), PT(2/3), SE(5/6), SI(2/3), SK(3/5)
CZ(3/5), DE(2/3), ES(3/5), FR(3/5), PL(2/3)
+ referendum DK FR, (IE)
Source: Hug and Schulz (2005), Hug and König (2006b) and http://www.unizar.es/ euroconstitucion/Treaties/Treaty_Const_Rat.htm
Legend: FR and IE appear twice, since there are alternative ratification processes, of which, in the
case of Ireland, one only applies to treaties related to the EU (hence the parentheses)
the results are quite plausible: not only are most parties positioned relative to the three versions of the treaties as well as relative to the other parties in an expected manner,31 but in many cases the government parties are also located quite close to the national position identified by the expert survey, although this position did not enter the wordscoring as a reference score. Of course, since the draft constitution, the IGC outcome and the status quo do not differ much on the second dimension (see Fig.1), there is not much variation between the party positions on this dimension. The national positions, on the other hand, do vary on the second dimension quite considerably. The variance is much greater on the first dimension, however, and thus reduces the importance of the second dimension for the following analysis.
4 Institutional Ratification Provisions
With respect to the constitutional treaty the ratification constraints the 25 governments of the EU face in their countries vary to a large extent. These constraints are rather complex and have not been known with great certainty at every stage of the bargaining process for every country. While in some coun-tries (for example Ireland) the rules had been clear and well known from the outset, other countries have not yet managed to decide definitely at the time of writing whether a referendum should be held on the topic (as it is the case in the Czech Republic). As far as the majority rule in parliament is concerned, most countries know a stronger and a weaker requirement for international treaties depending on whether the treaty affects the national constitution or not. While in some countries it obviously was not too difficult to decide that the national constitution was not affected by the constitutional treaty,
31There are some exceptions, of course, for example the “Uniti nell’ Ulivo” in Italy, the “ÖVP” in
Austria or the communist party in France. Most of these cases can be explained, however, by the quality of the texts available.
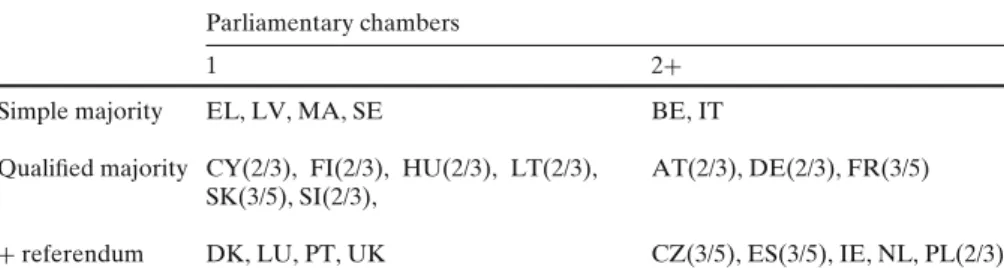
Table 2 Ratification of treaty on EU constitution
Parliamentary chambers
1 2+
Simple majority EL, LV, MA, SE BE, IT
Qualified majority CY(2/3), FI(2/3), HU(2/3), LT(2/3), SK(3/5), SI(2/3),
AT(2/3), DE(2/3), FR(3/5)
+ referendum DK, LU, PT, UK CZ(3/5), ES(3/5), IE, NL, PL(2/3)
in other countries, this decision was explicitly made by parliament (Austria) or the constitutional court (Spain). Thus, Table1summarizes the ratification processes under the assumption that the ratification of an international treaty requires constitutional changes.
For the ratification of the EU-constitution the ratification constraints differ, however, considerably. Obviously it is difficult to assess precisely what the negotiators anticipated regarding the various ratification procedures to be used in the 25 domestic arenas. In Table2we report, however, the majority requirements in parliament as we think they might have been expected during the final IGC. We expect that at that time a discussion about the effect of the treaty on the national constitution should have been started. In some countries, however, namely Luxembourg, Greece, Sweden and Lithuania, no indication of such a public discussion could be found. Hence, we conclude that it was not expected that the more stringent ratification rule will apply in these countries. A special case is Spain, where the constitutional court had to decide on the applicability of the higher ratification provisions, which it did not before December 2004. Therefore, we will assume the higher parliamentary ratification hurdle for this country.
As far as the referendums are concerned, the situation is not less com-plicated. In many countries referendums on international treaties could be triggered by the elite under certain circumstances. Table 3 shows at what point in time referendums were called. As the table shows, all referendums, except one, namely the French one, were called between the end of the Laeken convention and the end of the IGC. Given our discussion above, we will only
Table 3 Timing of
referendum announcement Country Time of announcement
Ireland No announcement, since required Spain June 1, 2003 (Aznar)
June 24, 2004 (Zapatero) Luxembourg June 27, 2003
Denmark August 8, 2003
Netherlands September 10, 2003 Portugal October 7, 2003 Czech Republic October 7, 2003
Poland March 24, 2004
United Kingdom April 20, 2004
Belgium June 1, 2004, but then withdrawn
Table 4 Referendums on the EU constitution
Referendum or not Countries
No referendum Austria (AT), Belgium (BE), Cyprus (CY), Estonia (EE), Finland (FI), Germany (DE), Greece (EL), Hungary (HU), Italy (IT), Latvia (LV) Lithuania (LT), Malta (MT), Slovakia (SK), Slovenia (SI), Sweden (SE)
Referendum, not binding, but announced after IGC
Referendum, not binding and announced before IGC
Luxembourg (LU), Netherlands (NL), United Kingdom (UK)
Referendum, binding but announced after IGC
France (FR),
Referendum, binding, required and/or announced before IGC
Czech Republic (CZ), Denmark (DK), Ireland (IE), Poland (PL), Portugal (PT), Spain (ES)a aIt was not before late December 2004 that the Spanish Constitutional Court ruled that the
constitutional treaty did not affect the Spanish constitution and that as a consequence a binding referendum would not be necessary (comparehttp://www.unizar.es/euroconstitucion/Treaties/ Treaty_Const_Rat_spain.htm)
consider this set of countries as having possibly profited from the scheduling of a referendum during negotiations.32 Table4differentiates the countries that had announced referendums during and shortly after the bargaining process from those with no referendum. In addition Table4also indicates whether the outcome of the referendum is binding. Spain is a special case, because a binding referendum was probably expected before the Constitutional Court ruled that out.
5 Testing the Effects of Referendums
Testing our theoretically derived hypotheses requires apart precise informa-tion on the preferences of various actors as discussed above, also a measure of gains realized during the negotiations.33In their study on the Amsterdam negotiations Hug and König (2002) used the number of issues dropped from the final draft which would have made a country worse of as measure for the gains realized. König and Daimer (2005) on the other hand use as measure for the negotiation gains the number of issues settled according to a country’s preferences.
32Additional analyses reported in Hug (2007) (forthcoming) support this theoretically informed
decision. If France is added to this set of countries most of the effects of this additional ratification hurdle are reduced.
33It is quite obvious that we need to subscribe here to the assumption of interpersonal
compar-isons of utilities, since hypotheses derived from two-level games suggest differential effects on negotiation gains. While being aware of the problem of such comparisons, we alert the reader that all studies, whether quantitative or qualitative, engage either implicitly or explicitly in such comparisons.
Given our interest in the final stages of the negotiations and our explicit spatial representation we will rely on two different measures. First, we will look only at those issues covered by our expert survey for which the draft adopted at the June 2004 Brussels IGC differed from the Convention draft.34 This limited set allows us to measure the negotiation gains that were realized between the end of the Laeken Convention and the final IGC meeting, i.e., the period during which all referendums were announced, with the exception of the French one as discussed above. In addition, given that the set of issues is quite limited we can also assess whether gains were realized in issue areas that were considered as vital for particular governments.35Second, we will also measure in our spatial representation discussed above (see Fig.1) whether governments were able to move the negotiation outcome toward their preferred position, both over the full Constitution building process (distance to status quo compared to distance to IGC outcome) and the final negotiation phase (distance to draft compared to distance to IGC outcome).
In a first stage we analyze whether governments that had announced ref-erendums before the end of the IGC negotiations fared any better than the remaining countries in the last stage of the negotiations. If we consider all issues that were changed in this last stage, we find that on average countries having announced a referendum gained 1.11 points,36 while the average is only 0.94 for the other countries. If we consider the gains the negotiators realized only for issues that our experts considered as vital for the government under consideration, we find a different picture. Countries having announced referendums before June 2004 actually incurred a loss of−0.22 for their vital issues, while the remaining countries faced a loss of only−0.09.
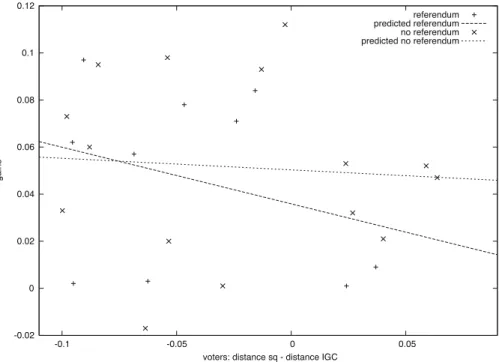
This simple analysis only partly confirms the hypothesized effect of referen-dums on the negotiations on the EU-constitution, however, the tests so far neglected the contingent effect of referendums. More precisely, theoretical models suggest that the effect should depend on the voters’ preferences as stated in Hypothesis 1. Thus, in what follows we will provide a more precise test of this hypothesis by looking at the effect of voter preferences contingent on the presence of a scheduled referendum or not. The results are depicted in Figs.2and3. In both figures we depict on the horizontal axis the difference between two distances, namely the one between the voters’ ideal point and the status quo, and the distance between the voters’ ideal point and the IGC outcome. Since we subtract the former from the latter, positive values indicate that voters are closer to the draft treaty than the status quo, while negative values indicate the reverse. Consequently, negative values suggest that voters
34We thank George Tsebelis for suggesting this additional analysis.
35At the end of the expert survey, the experts were asked to identify the issues which they
considered to be of vital importance for their national governments. Hug and König (2006a) provide a comparative analysis of these vital issues.
-2 -1 0 1 2 3 4 -0.1 -0.05 0 0.05 gains
voters: distance sq - distance IGC
referendum predicted referendum no referendum predicted no referendum
Fig. 2 Gains during the IGC: all issues. Regression for countries with referendums: gains =
0.20(0.58) − 21.12(8.96) * voters’ preferences (standard errors in parentheses); regression for
countries without referendums: gains =0.81(0.68) − 4.92(11.28) * voters’ preferences (standard errors in parentheses)
in a particular country prefer the status quo to the proposed constitutional treaty. On the vertical axis we depict the gains in the measure discussed above. Figure2reports the results when considering all issues having been changed in the draft treaty before the adoption at the IGC in June 2004. Each × corresponds to a country that has called a referendum on the EU-constitution before the end of the IGC, while the+s correspond to the remaining countries. The two lines summarize the relationship between the preferences of the voters and the gains realized in the last phase of the negotiation. For the countries having called a referendum, we find as expected a strong negative relationship. This suggests that countries with a skeptical electorate and a referendum announced before the end of the IGC fare better in the last stages of the negotiations and realized more gains than the other countries. If countries having triggered referendums before the end of the IGC have a rather supportive electorate for the EU-constitution, we find that they actually gained less than the remaining countries. The second line for the countries having refrained from calling a referendum suggests that the preferences of the voters did not affect systematically the gains realized in the last phase of the negotiations.
While Fig. 2 provides considerable support for Hypothesis 1, we might suspect that the gains realized by countries should be more strongly visible
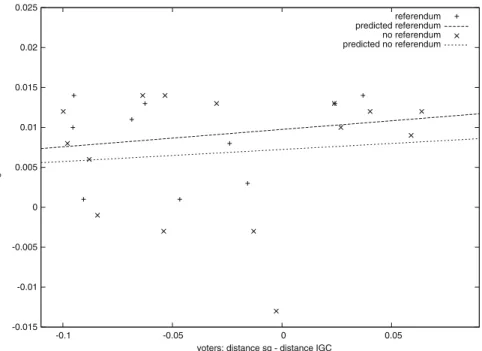
-2 -1 0 1 2 3 4 -0.1 -0.05 0 0.05 gains
voters: distance sq - distance IGC
referendum predicted referendum no referendum predicted no referendum
Fig. 3 Gains during the two stages of negotiation: vital issues. Regression for countries with
referendums: gains= −0.55(0.31) − 7.68(4.79) * voters’ preferences (standard errors in paren-theses); regression for countries without referendums: gains= −0.34(0.27) − 9.46(4.43) * voters’ preferences (standard errors in parentheses)
in areas their respective governments considered important.37Thus, in Fig.3 we report the results of the same analysis as in Fig.2but only count the gains a particular country realized on issues considered to be vital to its national government.38 While we find again a negative relationship for referendum countries, the negative effect also appears for those countries that have not triggered a referendum. This suggests that when it comes to vital issues, having a skeptical electorate at home was sufficient to threaten at the negotiation table.
The same analysis is also possible for the other measure of the gains realized. We present the results of these parallel analyses in Figs.4and5. In the first of these figures (Fig.4) we use the overall gains realized over all issues by comparing the preferences over the current status quo and the IGC outcome. As in the previous figures we find a negative relationship for the set of member countries having announced a referendum before the end of the IGC. Thus, again, overall member countries with such referendum announcements fared better, provided their electorate were critical toward the EU-constitution. For the countries without referendum announcement we also find a negative relationship, but it is much weaker.
37We thank Michael Marsh for the suggestion to control for the salience of issues. 38These obviously differ from one member state to the next.
-0.02 0 0.02 0.04 0.06 0.08 0.1 0.12 -0.1 -0.05 0 0.05 gains
voters: distance sq - distance IGC
referendum predicted referendum no referendum predicted no referendum
Fig. 4 Overall gains: SQ - IGC outcome. Regression for countries with referendums: gains = 0.04
(0.02) -0.21 (0.24) * voters’ preferences (standard errors in parentheses); regression for countries without referendums: gains= 0.06(0.01) − 0.04(0.14) * voters’ preferences (standard errors in parentheses)
Since all referendums were announced between the end of the Laeken Convention and the end of the IGC, we would expect that the relationship would even be stronger for the indicator measuring gains in this last phase. Figure5 shows, however, a different picture. Both for the countries having announced a referendum and those that refrained from doing so, we find a positive relationship between voter preferences and gains.
These results may be influenced, however, by the fact that referendums are not the only ratification constraint. Based on our information on the location of various actors in a bargaining space, we can also determine whether par-liaments are likely to encounter problems in the ratification process. Table5
summarizes this information unfortunately only for 23 out of the 25 countries. Given that our method to derive the policy positions of parties on the basis of their party manifestos and the treaties in their domestic language, we faced two problems. First, Malta apparently has not yet a completely translated set of currently used treaties. Hence, we were unable to determine the positions of the Maltese parties. Second, the party manifestos of Cyprus were not available electronically, forcing us to drop also this country from the analyses. In the analyses that follow, we will only retain from this table whether ratification was likely (1) or not (0). We use this variable together with the information already presented to test our hypotheses.
-0.015 -0.01 -0.005 0 0.005 0.01 0.015 0.02 0.025 -0.1 -0.05 0 0.05 gains
voters: distance sq - distance IGC
referendum predicted referendum no referendum predicted no referendum
Fig. 5 Overall gains: Convention draft - IGC outcome. Regression for countries with referendums:
gains= 0.01(0.00) + 0.03(0.03) * voters’ preferences (standard errors in parentheses); regression for countries without referendums: gains= 0.01(0.00) + 0.02(0.04) * voters’ preferences (standard errors in parentheses)
In Tables6,7,8,9, and10we report the results of simple regression analyses attempting to explain the various measures for the gains.39 As independent variables we use the scheduling of a referendum before the end of the IGC, this variable interacted with an indicator whether parliamentary ratification was likely not to cause any problems, the voters’ preferences interacted first with the referendum variable then also with the parliamentary ratification indicator, and finally the parliamentary ratification indicator and two dichotomous vari-ables for the two countries having held the presidency during the final stages of the IGC, namely Ireland and Italy.
In Table 6our dependent variable is the number of points by which the issues changed during the IGC were altered in the direction of a national positions. The first two models reflect the results presented graphically in Fig.2. As discussed above, the simple fact of scheduling a referendum before the end of the IGC increased the gains during this last phase of the negotiations (model 1). The results of model 2 suggest again that these gains are largely
39For all the regressions based on a sample of 23 or 25 observations we calculated also, based on a
suggestion by one reviewer, bootstrapped standard errors. Systematically, the differences were at most 10% of the OLS-estimates, hence affecting in no case our substantive conclusions. For this reason, we refrain from reporting these results here.
Table 5 Preference configurations and ratification constraints in n ational p arliaments Country Pos. seats a Pos. seats S cored b Scored Seats c Seats R ule d Rule Threshold T hreshold D if fe rence D if fe rence lower upper lower upper lower upper lower upper lower upper lower upper at 73 23 170 58 183 62 0.667 0.667 122.000 41.333 − 49.000 − 18.333 be 97 45 149 71 150 71 0.500 0.500 75.000 35.500 22.000 9.500 cz 120 32 200 73 200 81 0.600 0.600 120.000 48.600 0.000 − 16.600 de 554 56 603 63 603 69 0.667 0.667 402.000 46.000 152.000 10.000 dk 98 0 175 0 179 0.500 89.500 8.500 ee 62 0 101 0 101 0.500 50.500 11.500 el 135 0 300 0 300 0.500 150.000 − 15.000 es 182 118 340 246 350 259 0.600 0.600 210.000 155.400 − 28.000 − 37.400 fi 191 0 200 0 200 0.667 133.333 57.667 fr 563 276 574 276 577 321 0.600 0.600 346.200 192.600 216.800 83.400 hu 198 0 386 0 386 0.667 257.333 − 59.333 ie 132 49 151 53 166 60 0.500 0.500 83.000 30.000 49.000 19.000 it 495 246 600 299 613 320 0.500 0.500 306.500 160.000 188.500 86.000 lt 95 0 121 0 137 0.500 68.500 26.500 lu 26 0 5 9 0 59 0.500 29.500 − 3.500
lv 61 0 100 0 100 0.500 50.000 11.000 nl 137 69 148 72 150 75 0.500 0.500 75.000 37.500 62.000 31.500 pl 330 81 403 83 460 100 0.667 0.667 306.667 66.667 23.333 14.333 pt 111 0 216 0 230 0.500 115.000 − 4.000 se 117 0 349 0 349 0.500 174.500 − 57.500 si 38 0 8 0 0 90 0.667 60.000 − 22.000 sk 82 0 128 0 150 0.600 90.000 − 8.000 uk 227 271 644 453 659 664 0.500 0.500 329.500 332.000 − 102.500 − 61.000 aThis and the next column give the sum of the seats o f those p arties for w hich we find a positive d if fe rence w hen w e compare the e uclidean distance between their ideal point and the status quo and their ideal point and the IGC outcome, respectively bThis and the next column give the sum of the seats o f those p arties for w hich we were able to score p arty manifestos cThis and the next column list the number o f seats o f the respective chamber of parliament dThis and the next column give the ratification rule in parliament a s it a pplies to the constitutional treaty. In some countries the w eaker majority requ irement applies b ecause the constitutional treaty does not af fe ct the constitution In Luxembourg, the E uropean Parliament E lection took place the same day a s the election to the n ational p arliament. For this reason no European Parlia ment Election manifesto is available for one of the g overnmental p arties (the DP) a nd which is the reason why its score should b e regarded a s less valid. It a ctually is rather implausible that the position o f a party b elonging to the government coalition is that close to the status quo The manifesto of the ‘Partido P opular” is m issing for P ortugal. S ince this party h eld 1 4 seats in 2003 and since it is actually not a E uro-sceptic p arty, we will assume that is was expected a t that time that the Portuguese parliament w ould ratify the treaty For S lovakia, the manifesto of a splinter p arty (the L’U (Peoples Union)) is m issing that separated from the HZDS and h as a rather n ationalistic o rient ation. For that reason, we would a ssume that the rejection of the constitutional treaty w as expected to b e even more severe than this table would suggest
Table 6 Explaining gains in changed issues during IGC
Model 1b 2b 3b 4b 5b 6b 7b
variables (s.e.) (s.e.) (s.e.) (s.e.) (s.e.) (s.e.) (s.e.) Referendum 0.174 −0.608 −0.518 0.121 −0.405 −0.405 −0.425
(0.894) (1.124) (1.112) (1.391) (1.503) (1.546) (1.592)
Referendum −1.386 −0.204 −0.056 −0.184
× parl. pro EU-const. (1.775) (2.177) (2.282) (2.371) Referendum −16.203 −13.463 −14.700 −27.921 −27.921 −28.770 × voters’ preferences (17.773) (17.542) (17.807) (22.699) (23.355) (24.133) Voters’ preferences −4.917 −6.552 −5.985 −5.985 −5.985 −5.136 (9.832) (10.471) (10.611) (10.645) (10.953) (11.474) Referendum × voters’ preferences 27.094 25.783 25.783
× parl. pro EU-const. (28.699) (29.785) (30.657)
Parl. pro EU-const. 1.385 1.931 1.931 1.931 2.059 (0.858) (1.115) (1.119) (1.151) (1.228) IE −0.837 −0.837 (2.488) (2.561) IT −0.946 (2.373) Constant 0.938 0.809 0.150 −0.145 −0.145 −0.145 −0.124 (0.536) (0.592) (0.782) (0.876) (0.879) (0.905) (0.933) rmse 2.145 2.132 2.030 2.053 2.059 2.119 2.181 n 25 25 23 23 23 23 23
dependent on having a skeptical electorate. In the absence thereof scheduling a referendum may be even counterproductive. This strong contingent effect of the voters’ preferences remains even when we control for the fact whether the parliament was expected to ratify the EU-constitution according to the respective domestic requirements (model 3). This later dichotomous variable should, however, again modify the effects of the other two variables. This is accounted for in models 4 and 5. Interestingly enough these additional interaction effects change in part the overall picture. While the effect of the voters’ preferences is still as expected negative, this effect is almost completely reduced in countries where the parliament was in favor of the EU-constitution. Finally, hypothesis 2 would suggest that the two countries having held the EU-presidency during the final phases of the IGC would obtain additional gains. The results reported in the last column hardly support this implication. Both for Ireland which presided over the final negotiations and Italy having led the EU at the beginning of the IGC we find negative coefficients.
While the results discussed so far provided some support for the hypothe-sized effect of voter preferences and an announced referendum, we did not control so far for the effect of the overall preference configuration. To do so, we analyze exactly the same set of issues, namely those changed during the IGC, but estimate the effect of voter preferences and institutions for each of the issues separately and controlling for the number of countries which won due to the proposed change. Hence, instead of having 25 observations we have six times as many, namely the number of issues changed at the IGC times the number of member countries. Our dependent variable is the gain realized
during the IGC, while the independent variables remain the same with one exception. For each issue we calculated the number of member states winning from the changes adopted in the IGC. Given that the dependent variable only takes on four different values and because of the clear lack of independence between observations, we estimated our model as an ordered probit model and calculated clustered standard errors per member state.40
The results reported in Table7 first confirm the insights of the previous analyses. Model 2 clearly shows the less skeptical voters become, the lower are the gains in countries having scheduled a referendum before the end of the IGC. This statistically significant effect is reduced if we also allow for an effect of the voters’ preferences in countries having not scheduled a referendum. But quite clearly, the substantive difference remains. In model 4 we introduce as control variable the number of countries having gained on the particular issue during the IGC. Not surprisingly, we find a strong and significant effect, but more interestingly, none of the other estimated coefficients is affected by the introduction of this new control variable. Adding the other variables also employed in Table 6 hardly changes the general conclusions.41 The only notable insight is the effect of voters’ preferences is positive and statistically significant in countries where parliaments were expected to be in favor of the constitution and a referendum was scheduled. In the models in which this interaction appears (models 7–9 in Table7), the interaction effect between referendums and voter preferences also becomes statistically significant and strongly negative. This suggests the conclusion that the effect of voter preferences was especially strong if parliament was expected to be against the EU constitution and a referendum was scheduled. Concerning our second hypothesis we find stronger results that go against our expectations, however. For Ireland we find even a significant negative effect, while the effect is also negative for Italy but not statistically significant.
On a more abstract level the results reported in Table7suggest that even though the preference configuration as measured by the number of winners is an important predictor for gains, it fails to affect the general thrust of our results. Hence, in the remaining analyses we refrain from controlling for this important independent variable, since it is most likely orthogonal to all our other independent variables (as in the analysis reported in Table7).
Hence, we turn to another control that might prove important, namely the saliency of the issues considered. While Fig.2suggested much less support for our hypotheses when the dependent variable is the gains made in the vital issues, the results reported in Table6alter this picture a bit. The first model obviously replicates the negative result discussed above, but once we take
40This obviously only controls for the lacking independence in the error structure and not in the
possibly misspecified theoretical model (a point often forgotten by scholars employing clustered standard errors). Ideally, we would also allow for issue specific effects, but given that the number of winners only varies across issues, this is not possible.
41Again, given that we fail to have information on the position of the political parties in two
Table 7 Explaining gains per issue during IGC M o d e l 1 b 2 b3 b4 b5 b6 b7 b8 b9 b variables (s.e.) (s.e.) (s.e.) (s.e.) (s.e.) (s.e.) (s.e.) (s.e.) (s.e.) Referendum 0.092 − 0.183 − 0.145 − 0.149 − 0.131 0.018 − 0.122 − 0.122 − 0.128 (0.206) (0.227) (0.217) (0.222) (0.197) (0.274) (0.250) (0.250) (0.250) Voters’ preferences − 1.462 − 1.494 − 1.991 − 1.871 − 1.878 − 1.880 − 1.650 (2.474) (2.525) (2.733) (2.709) (2.719) (2.722) (2.795) Referendum − 6.425 − 4.970 − 5.022 − 4.326 − 4.614 − 8.160 − 8.168 − 8.407 × voters’ preferences (2.460) (3.458) (3.554) (3.349) (3.551) (3.876) (3.880) (3.953) Winners 0.039 0.035 0.035 0.035 0.035 0.036 (0.011) (0.012) (0.012) (0.012) (0.012) (0.012) Parl. p ro EU-const. 0.348 0.477 0.479 0.479 0.515 (0.219) (0.338) (0.340) (0.340) (0.369) Referendum − 0.324 − 0.013 0.048 0.013 × parl. p ro EU-const. (0.384) (0.353) (0.349) (0.375) Referendum × voters’ preferences 7.196 6.648 6.655 × parl. p ro EU-const. (2.864) (2.803) (2.808) IE − 0.352 − 0.352 (0.026) (0.026) IT − 0.262 (0.283) Cut 1 − 1.048 − 1.064 − 1.027 − 0.449 − 0.371 − 0.306 − 0.310 − 0.310 − 0.315 (0.164) (0.167) (0.155) (0.277) (0.309) (0.321) (0.322) (0.322) (0.325) Cut 2 − 0.325 − 0.329 − 0.291 0.329 0.431 0.500 0.502 0.503 0.499 (0.163) (0.164) (0.147) (0.278) (0.299) (0.310) (0.312) (0.312) (0.314) Cut 3 0.899 0.913 0.953 1.606 1.722 1.795 1.804 1.807 1.805 (0.148) (0.150) (0.139) (0.288) (0.317) (0.341) (0.345) (0.345) (0.346) log likelihood − 192.783 − 190.581 − 190.319 − 187.377 − 170.097 − 169.736 − 169.054 − 168.823 − 168.674 n 150 150 150 150 150 138 138 138 138 Legend: To control for country heterogeneity the standard errors were clustered
Table 8 Explaining gains in changed vital issues during IGC M o d e l 1 b2 b3 b 4 b 5 b 6 b 7 b variables (s.e.) (s.e.) (s.e.) (s.e.) (s.e.) (s.e.) (s.e.) Referendum − 0.128 − 0.212 − 0.120 − 0.027 − 0.160 − 0.160 − 0.158 (0.404) (0.463) (0.488) (0.620) (0.682) (0.704) (0.729) Referendum − 0.203 0.548 0.113 0.128 × parl. p ro EU-const. (0.791) (0.508) (1.040) (1.086) Voters’ preferences − 9.460 − 10.481 − 10.398 − 10.398 − 10.398 − 10.504 (4.055) (4.594) (4.730) (4.833) (4.991) (5.255) Referendum 1.780 3.175 2.994 − 0.367 − 0.367 − 0.261 × voters’ preferences (7.330) (7.697) (7.937) (10.305) (10.641) (11.054) Referendum × voters’ preferences 6.887 6.755 6.755 × parl. p ro EU-const. (13.030) (13.571) (14.042) Parl. p ro EU-const. 0.468 0.548 0.098 0.548 0.532 (0.377) (0.497) (0.988) (0.525) (0.562) IE − 0.084 − 0.084 (1.134) (1.173) IT 0.118 (1.087) Constant − 0.094 − 0.341 − 0.625 − 0.668 − 0.668 − 0.668 − 0.671 (0.243) (0.244) (0.343) (0.391) (0.399) (0.412) (0.427) rmse 0.971 0.879 0.891 0.915 0.935 0.965 0.999 n 25 25 23 23 23 23 23
Table 9 Explaining overall gains (Draft-IGC) M o d e l 1 b2 b3 b4 b5 b6 b7 b variables (s.e.) (s.e.) (s.e.) (s.e.) (s.e.) (s.e.) (s.e.) Referendum 0.004 0.005 0.006 0.002 0.003 0.003 0.003 (0.003) (0.004) (0.004) (0.005) (0.005) (0.006) (0.004) Referendum 0.009 0.006 0.006 0.003 × parl. p ro EU-const. (0.006) (0.008) (0.008) (0.007) Referendum 0.014 0.019 0.027 0.052 0.052 0.034 × voters’ preferences (0.059) (0.063) (0.062) (0.080) (0.083) (0.066) Voters’ preferences 0 .017 0.011 0.008 0.008 0.008 0.026 (0.033) (0.038) (0.037) (0.038) (0.039) (0.032) Referendum × voters’ preferences − 0.053 − 0.052 − 0.052 × parl. p ro EU-const. (0.102) (0.106) (0.084) Parl. p ro EU-const. − 0.001 − 0.004 − 0.004 − 0.004 − 0.001 (0.003) (0.004) (0.004) (0.004) (0.003) IE 0.000 0.000 (0.009) (0.007) IT − 0.020 (0.007) Constant 0.007 0.007 0.006 0.008 0.008 0.008 0.008 (0.002) (0.002) (0.003) (0.003) (0.003) (0.003) (0.003) rmse 0.007 0.007 0.007 0.007 0.007 0.008 0.006 n 25 23 23 23 23 23 23
Table 1 0 Explaining overall gains (Status quo-IGC) M o d e l 1 b2 b3 b4 b5 b6 b7 b variables (s.e.) (s.e.) (s.e.) (s.e.) (s.e.) (s.e.) (s.e.) Referendum − 0.007 − 0.015 − 0.017 0.008 0.001 0.001 0.001 (0.013) (0.017) (0.019) (0.021) (0.023) (0.024) (0.024) Referendum − 0.055 − 0.038 − 0.035 − 0.029 × parl. p ro EU-const. (0.027) (0.034) (0.035) (0.035) Voters’ preferences − 0.042 − 0.073 − 0.050 − 0.050 − 0.050 − 0.085 (0.150) (0.176) (0.164) (0.165) (0.168) (0.170) Referendum − 0.171 − 0.146 − 0.195 − 0.382 − 0.382 − 0.347 × voters’ preferences (0.271) (0.296) (0.274) (0.314) (0.359) (0.358) Referendum × voters’ preferences 0.383 0.350 0.350 × parl. p ro EU-const. (0.444) (0.458) (0.455) Parl. p ro EU-const. − 0.007 0.014 0.014 0.014 0.009 (0.014) (0.017) (0.017) (0.018) (0.018) IE − 0.021 − 0.021 (0.038) (0.038) IT 0.038 (0.035) Constant 0.060 0.059 0.064 0.051 0.052 0.052 0.051 (0.008) (0.009) (0.014) (0.016) (0.014) (0.014) (0.014) rmse 0.032 0.032 0.034 0.032 0.032 0.033 0.032 n 25 25 23 23 23 23 23
into consideration the voters’ preferences and the parliamentary ratification constraints, most of the estimated coefficients have the expected signs. We find again that having skeptical voters allowed countries with referendums to realize gains. When looking for an indication whether the presidency allows for additional gains, we find again hardly conclusive results. On vital issues Ireland on average lost out while Italy, surprisingly seemed to have gained a bit, but these effects are statistically not significant.
Turning now to the analyses using the information from the spatial analysis, the results become weaker. If we look at the overall gains realized during the IGC (Table9), we fail to find the expected effect for voters’ preferences, even when controlling for parliamentary ratification. Also the results for this later variable are hardly informative, as are those for the effect of the EU-presidency. While finding a positive coefficient for Ireland and a negative one for Italy, these are correspondingly very small, even though the later achieves statistical significance. These rather disappointing results are likely to find an explanation in Fig.1, which suggests that in the spatial representation the draft constitution and the IGC outcome are almost indistinguishable. Given this, measures based on movements from the former to the latter are likely to be quite noisy measures of the success in the final negotiations.
Finally, we present in Table 10the results for the overall gains over the whole negotiation phase comprising also the Laeken convention. Here the pattern of estimated coefficients is much more in line with our theoretical implications. Again, we find the anticipated effects of voter preferences in countries having scheduled referendums, some of which even almost achieve statistical significance. The effect is slightly strengthened in countries having supportive parliaments, but this effect is minute.
6 Conclusion
Compared to any previous treaty modifications in the EU, the “Treaty Establishing a Constitution for Europe” involved to a much larger extent actors beyond the iron-circle of governmental and supranational representa-tives. Already during the drafting phase societal interest were actively sought to be associated, as they were in many member countries in the preference formation stage (Hug and König2006a). Hence, it can only partly surprise that many governments of member states decided to consult their citizens in the ratification stage. As discussed in this article almost all these referendums were either constitutionally required or announced before the IGC negotiations concluded in Brussels in June 2004. Most theoretical work on ratification processes would suggest that these referendums erected additional ratification hurdles and thus may have benefited member states during the negotiations.
In this article, we first discussed the theoretical underpinnings for this contention, which suggested that hypotheses may be formulated on the effect of such referendums, but that these are contingent effects. In addition, the implications of the theoretical models also set the bar at a very high level when it comes to the quality and wealth of information necessary to test these implications. Thanks to the painstaking data-gathering effort undertaken in
the DOSEI-project we were able in this article to present rather rich empirical evidence supporting many of the implications of the theoretical models.
More precisely, we find that referendums may have led to negotiation gains, provided, first of all, that the referendum is scheduled in a country with skeptical voters. In the absence of Euro-skeptic voters, calling a referendum hardly has the hoped for effect. This result appears strongest for the issues changed during the IGC. While similar patters of gains and losses as a function of referendums and voter preferences also appear over the whole negotiation process, the effects are weaker. Second, the effect of referendums and voter preferences is also affected by whether the EU-constitution was likely to cross the bar of parliamentary ratification.
While these results give much credence to the theoretical models discussed above, two major issues are still unresolved. First of all, given that most of the referendums scheduled on the EU-constitution were not required, we need to understand why these were triggered. Was it the idea that a referendum could be used as a bargaining chip, or were there other considerations as Closa (2005) suggests.
Second, given that already two referendums have failed on the EU-constitution, namely in France and the Netherlands, the question arises whether these countries will have the possibility to reap additional gains in renegotiations. In previous “ratification accidents” the “renegotiations” resulted in rather negligible changes if at all, but the countries concerned were obviously not part of the founding members of the EU. Thus, even though the present article has offered evidence in support of the theoretical implications on referendums, there still are a series of questions that await answers in future research.
Appendix
Table11reports the descriptive statistics for the variables used in the regres-sion analyses, while Table12list the topics covered in the questions used in the factor analysis reported in the main text including the factor loadings of
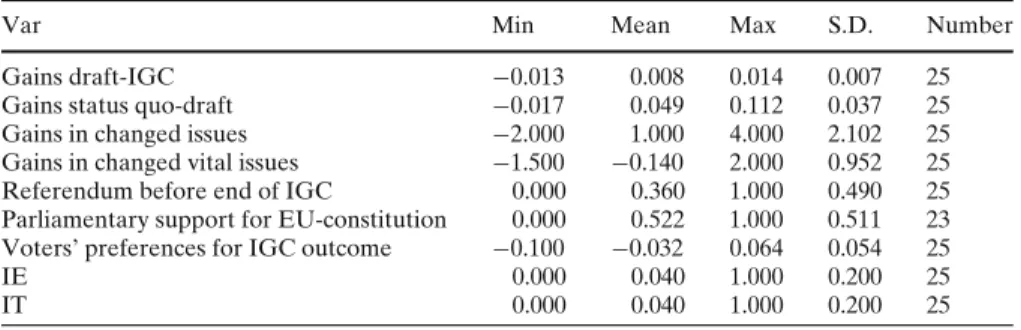
Table 11 Descriptive statistics
Var Min Mean Max S.D. Number
Gains draft-IGC −0.013 0.008 0.014 0.007 25
Gains status quo-draft −0.017 0.049 0.112 0.037 25 Gains in changed issues −2.000 1.000 4.000 2.102 25 Gains in changed vital issues −1.500 −0.140 2.000 0.952 25 Referendum before end of IGC 0.000 0.360 1.000 0.490 25 Parliamentary support for EU-constitution 0.000 0.522 1.000 0.511 23 Voters’ preferences for IGC outcome −0.100 −0.032 0.064 0.054 25
IE 0.000 0.040 1.000 0.200 25
Table 1 2 Issues of the DOSEI questionnaire a nd factor loadings Question λ1 λ2 λ3 (s.e.) (s.e.) (s.e.) 1. CHARTER O F F UNDAMENTAL RIGHTS 2 .098 0.040 − 0.030 (0.012) (0.019) (0.019) 2. SUBSIDIARITY − 1.217 − 0.026 − 0.028 (0.007) (0.014) (0.014) 3. RELIGIOUS REFERENCE IN T HE PREAMBLE OF THE C ONSTITUTION: 0.303 0.016 0.005 (0.005) (0.009) (0.009) 4. RIGHT TO WITHDRAW FROM THE U NION 0.488 0.031 0.040 (0.006) (0.017) (0.016) 5.1 O BJECTIVES: M arket e conomy 2.031 0.040 − 0.016 (0.011) (0.018) (0.018) 5.2 O BJECTIVES: E mployment 1.853 0.040 − 0.005 (0.009) (0.013) (0.013) 5.3 O BJECTIVES: H igh level of competitiveness 1 .598 0.028 0.039 (0.010) (0.023) (0.024) 6. PRESIDENCY EUROPEAN COUNCIL (TERM) 0.942 0.057 − 0.015 (0.007) (0.017) (0.017) 7. ELECTION O F T HE PRESIDENT E UROPEAN C OUNCIL − 0.661 − 0.023 − 0.046 (0.007) (0.018) (0.018) 8. QUALIFIED MAJORITY THRESHOLD 0 .611 0.082 − 0.017 (0.007) (0.020) (0.020) 9. COMPOSITION COMMISSION − 0.809 0.078 0.059 (0.009) (0.030) (0.030) 10. APPOINTMENT / ELECTION O F T HE COMMISSION PRESIDENT − 1.041 − 0.028 − 0.048 (0.007) (0.013) (0.013) 11. APPOINTMENT O F C OMMISSIONERS − 0.157 0.074 0.011 (0.007) (0.021) (0.021) 12. EXTERNAL R EPRESENTATION OF THE U NION 2.068 0.060 − 0.032 (0.011) (0.018) (0.018) 13.A A PPOINTMENT O F T HE EU FOREIGN M INISTER 1 .452 0.051 − 0.017 (0.009) (0.025) (0.025)
13.B A PPROVAL OF EU FOREIGN M INISTER B Y E P − 0.499 − 0.022 − 0.036 (0.006) (0.016) (0.016) 14. JURISDICTION 1.408 0.039 − 0.051 (0.009) (0.021) (0.021) 15.2 R IGHT OF INITIATIVE OF LEGISLATIVE ACTS: E UROPEAN P ARLIAMENT. − 1.327 − 0.043 − 0.038 (0.008) (0.022) (0.022) 15.3 R IGHT OF INITIATIVE OF LEGISLATIVE ACTS: C OUNCIL. − 1.398 0.000 0.029 (0.008) (0.013) (0.013) 15.5 R IGHT OF INITIATIVE OF LEGISLATIVE ACTS: CITIZENS. − 0.657 0.064 0.038 (0.007) (0.020) (0.021) 16. ENHANCED COOPERATION: S COPE 2.018 0.124 0.042 (0.012) (0.039) (0.040) 17.1 D ELEGATION OF COMPETENCIES: A griculture 1.288 0.020 0.025 (0.007) (0.015) (0.015) 17.3 D ELEGATION OF COMPETENCIES: A rea o f freedom, security a nd justice 0 .529 0.081 0.004 (0.008) (0.026) (0.026) 17.4 D ELEGATION OF COMPETENCIES: F oreign policy − 0.022 0.065 − 0.007 (0.008) (0.029) (0.029) 17.6 D ELEGATION OF COMPETENCIES: T ax harmonization − 0.763 0.049 − 0.071 (0.008) (0.026) (0.026) 17.8 D ELEGATION OF COMPETENCIES: Social policy − 0.757 0.062 − 0.058 (0.007) (0.022) (0.022) 17.9 D ELEGATION OF COMPETENCIES: Health − 0.406 0.031 − 0.027 (0.006) (0.013) (0.013) 17.11 DELEGATION OF COMPETENCIES: E ducation − 1.061 0.024 − 0.025 (0.007) (0.015) (0.015) 17.12 DELEGATION OF COMPETENCIES: R esearch, technological development a nd space 0 .051 0.046 − 0.020 (0.007) (0.021) (0.021) 18.A2 INVOLVEMENT O F T HE PARLIAMENT: S tructural a nd Cohesion Policies 1 .651 − 0.013 − 0.037 (0.008) (0.012) (0.012)
Table 1 2 Continued Question λ1 λ2 λ3 (s.e.) (s.e.) (s.e.) 18.A3 INVOLVEMENT O F T HE PARLIAMENT: A rea o f F reedom, S ecurity a nd Justice 0 .367 0.048 0.016 (0.006) (0.019) (0.019) 18.A5 INVOLVEMENT O F T HE PARLIAMENT: T ax harmonization − 0.774 0.112 − 0.048 (0.009) (0.032) (0.032) 18.A6 INVOLVEMENT O F T HE PARLIAMENT: M onetary Policy (for the Euro-States) 0.770 0.067 − 0.060 (0.008) (0.024) (0.024) 18.A7 INVOLVEMENT O F T HE PARLIAMENT: E conomic Policy 0 .662 0.056 − 0.051 (0.007) (0.023) (0.023) 18.A8 INVOLVEMENT O F T HE PARLIAMENT: E mployment P olicy 1 .617 0.049 − 0.025 (0.009) (0.021) (0.021) 18.A9 INVOLVEMENT O F T HE PARLIAMENT: Social P olicy 0 .634 0.055 0.036 (0.007) (0.022) (0.022) 18.A10 INVOLVEMENT O F T HE PARLIAMENT: Social S ecurity R ights − 0.389 0.100 − 0.085 (0.009) (0.038) (0.038) 18.A11 INVOLVEMENT O F T HE PARLIAMENT: C ommon F oreign Policy − 0.540 0.096 − 0.014 (0.007) (0.025) (0.026) 18.A12 INVOLVEMENT O F T HE PARLIAMENT: Defense Policy − 1.598 0.115 − 0.028 (0.011) (0.032) (0.032) 18.B1 COUNCIL VOTING RULE: A griculture 0.887 − 0.010 − 0.024 (0.007) (0.015) (0.015) 18.B2 COUNCIL VOTING RULE: S tructural a nd Cohesion Policies 2 .018 − 0.026 − 0.030 (0.010) (0.020) (0.020) 18.B3 COUNCIL VOTING RULE: A rea o f F reedom, S ecurity a nd Justice 0 .312 0.024 0.010 (0.006) (0.015) (0.015) 18.B4 COUNCIL VOTING RULE: Internal M arket 1 .540 − 0.005 − 0.062 (0.009) (0.017) (0.018) 18.B5 COUNCIL VOTING RULE: T ax harmonization − 0.845 0.120 − 0.099 (0.010) (0.038) (0.038) 18.B6 COUNCIL VOTING RULE: M onetary Policy (for the Euro-States) 0.213 − 0.002 − 0.125 (0.009) (0.037) (0.037)
18.B7 COUNCIL VOTING RULE: E conomic Policy 0 .262 − 0.006 − 0.131 (0.010) (0.038) (0.039) 18.B8 COUNCIL VOTING RULE: E mployment P olicy 0 .638 0.021 − 0.111 (0.009) (0.030) (0.031) 18.B9 COUNCIL VOTING RULE: Social P olicy 0 .699 0.018 − 0.018 (0.006) (0.012) (0.012) 18.B10 C OUNCIL VOTING RULE: Social S ecurity R ights − 0.406 0.066 − 0.126 (0.009) (0.034) (0.034) 18.B11 C OUNCIL VOTING RULE: C ommon F oreign Policy − 1.728 0.023 − 0.106 (0.011) (0.029) (0.029) 18.B12 C OUNCIL VOTING RULE: Defense Policy − 1.755 0.021 − 0.117 (0.011) (0.029) (0.029) 19. INVOLVEMENT O F T HE PARLIAMENT IN THE A DOPTION OF THE B UDGET 0 .374 0.019 0.006 (0.005) (0.009) (0.009) 20. STABILITY A ND GROWTH PACT − 0.329 − 0.015 − 0.020 (0.006) (0.012) (0.012) 21. STABILITY A ND GROWTH PACT 0.301 0.020 − 0.016 (0.005) (0.011) (0.011) 22. COMMON S ECURITY AND D EFENSE POLICY 0.562 0.147 0.017 (0.011) (0.047) (0.047) 23. MANAGEMENT SYSTEM FOR E XTERNAL B ORDERS (SCOPE OF UNION A CTION) 0.904 0.038 − 0.002 (0.006) (0.014) (0.014) 24. MIGRATION AND A SYLUM P OLICY: S COPE OF UNION A CTION 0 .883 0.084 0.036 (0.008) (0.030) (0.030) aMeasure o f item d if fi culty” Q uinn ( 2004 ) bLoadings on the fi rst Dimension cLoadings on the second Dimension