ASSESSING MATERIALS RISK IN PURCHASED ELECTRONIC COMPONENTS DURING PRODUCT DESIGN
by
Jennifer A. Rigoni
B.S. Industrial and Systems Engineering, University of Southern California, 1996 Submitted to the Sloan School of Management and the
Department of Mechanical Engineering
In Partial Fulfillment of the Requirements for the Degrees of Master of Science in Management and
Master of Science in Mechanical Engineering
In conjunction with the Leaders for Manufacturing Program at the Massachusetts Institute of Technology
May 2002
© Massachusetts Institute of Technology, 2002. All rights reserved.
Signature of Author
MIT Sloan School of Management Department of Mechanical Engineering May 7, 2002 Certified by
Dr. Daniel E. Whitne, Thesis Advisor Sr. Research Scientist, MIT Center for Technology, Policy, and Industrial Development Certified by
Dr. Sara L. Beckman, Thesis Advisor Sr. Lecturer, Management of Technology, Univ.-of-Califoria Berkeley Haas School of Business Certified by
Dr. Donald B'ifo'se1nfidd, Thesis Advisor A Sr. Lecturer,, Aj;TSl1i School of Management Accepted by
Margaret C. Andrews Director of Master's Program, M j2 .an School of Management Accepted by
Dr. Ain Sonin Chair, Committe oIT Department of Mechanical Engineering
ASSESSING MATERIALS RISK IN PURCHASED ELECTRONIC COMPONENTS DURING PRODUCT DESIGN
by
Jennifer A. Rigoni
Submitted to the Sloan School of Management and the Department of Mechanical Engineering
In Partial Fulfillment of the Requirements for the Degrees of Master of Science in Management and
Master of Science in Mechanical Engineering
ABSTRACT
In the electronics industry, Design for Supply Chain principles are employed in an attempt to reduce the impact of component obsolescence. When a supplier discontinues a component, the costs to the customer are high. The customer can choose to redesign the product(s) the
component is used in, or can purchase all of the components the customer projects needing to manufacture and support the product(s) for the remainder of its(their) lifetime (called a lifetime buy).
The goal of this thesis is to develop a risk analysis methodology and supporting tools to help design engineers reduce the use of parts at high risk for obsolescence in new products. This approach was developed in conjunction with the Design Chain Solutions Group at Agilent Technologies' Santa Clara, California site.
An algorithmically determined risk metric was developed to communicate the level of risk incurred by a printed circuit board design. A proof-of-concept level risk analysis application was also developed to compute the risk metric and display risk information to design engineers. The effectiveness of the risk metric and risk analysis application was tested in a pilot program.
Expected impacts of a successful materials risk analysis program at the design engineer level include a reduction in cost of sales, reduction in the time to market for new products, and
reduction in inventory holding costs. Thesis Advisors:
Daniel E. Whitney, Sr. Research Scientist, MIT Center for Technology, Policy, and Industrial Development
Sara L. Beckman, Sr. Lecturer, Management of Technology, Haas School of Business, University of California, Berkeley
ACKNOWLEDGEMENTS
I wish to gratefully acknowledge the support of the Leaders For Manufacturing program, a
partnership between MIT and major U.S. manufacturing companies, who sponsored this research.
I wish to thank a host of people at Agilent Technologies' DCS group and Sonoma County EPSG group who provided time, expertise, and general support for this research. In particular I
want to thank Pete Woodhouse, my project supervisor, for keeping my work on track and ensuring I had everything I needed to be successful. I also want to thank Ted Lancaster, the project sponsor, for understanding the importance of the project and finding funds when they were urgently needed. I want to give a special thank you to Mike Young, who dedicated an enormous amount of time to program the pilot application at the last minute when all other contingencies had been exhausted. There are many more people who were critical to the project success, and I want to mention a few of them: the pilot designers Gary Dooley, Uriel Fojas, Ben Starkey and Aaron Patton. Roy Helgevold and Mike Powers who were always willing to help, and also ensured we had third party data for the pilot program. Lastly, I appreciated the expertise and advice of Bill Walker, who is Agilent's guru of everything Supply Chain.
I also wish to thank my thesis advisors, Dan Whitney and Sara Beckman for their guidance
and insights. The depth of their knowledge and experience ensured the quality of both the project and the thesis.
Lastly, I want to thank my husband Tony for his support and love through this very trying time. Thank you, dear, for helping me reach for the stars.
I wish to dedicate this thesis to my parents, Dean and Jeannette Fish, who have made deep
TABLE OF CONTENTS A B ST RA C T ... 3 A C K N O W LED G EM E N TS ... 4 TA B LE O F C O N TEN TS ... 5 1 BA C K G RO U N D ... 7 1.1 COM PANY ... 7
1.1.1 D ivisions and Products... 8
1.1.2 Structure... 10
1 .1 .3 C u ltu r e ... 1 2 1.1.4 Econom ic Clim ate ... 14
1.2 INTERNSHIP PROJECT ... 15
1.3 PROBLEM STATEM ENT ... 16
1.3.1 Proposed Solution... 18
1.4 CONCLUSION... 18
2 PR O BLEM D ESC R IPT IO N ... 19
2.1 PROBLEM STATEM ENT ... 19
2.2 M AGNITUDE A SSESSMENT ... 20
2.3 O PTIONS FOR D ISCONTINUED COMPONENTS... 21
2.3.1 D rop-in Replacem ent ... 21
2.3.2 Lifetim e Buy ... 22
2.3.3 Total Redesign ... 22
2.3.4 Bridge Buy ... 22
2.3.5 Sum m ary ... 23
2.4 OBSOLESCENCE MANAGEMENT OUTSIDE AGILENT ... 23
2.4.1 GID EP... 23
2.4.2 Predictive O bsolescence ... 27
2.5 PRODUCT D ESIGN PROCESS ... 29
2.5.1 Sonom a County EPSG ... 29
2.5.2 D esign Phases... 30
2.6 PARTS SELECTION PROCESS... 32
2.6.1 Lab Stock Evolution ... 33
2.6.2 Part Preference D eterm ination... 34
2.6.3 Parts Selection M echanisms ... 34
2.6.4 Leveraging ... 35
2.7 M ATERIAL LIST ANALYSIS REVIEW ... 36
2.7.1 D esign Engineer Survey Results... 39
2.8 D ECISION SUPPORT SYSTEM S ... 40
2.9.2 N ext G eneration Preference Codes ... 42
2.10 PROBLEM D EFINITION... 43
2.10.1 Expected Impacts ... 43
2.10.2 Risk Scoring M ethodology and Risk M etric... 44
2.11 SUMMARY... 44
3 RISK METRIC AND ALGORITHM DETERMINATION... 45
3.1 RISK M ETRIC IMPORTANCE... 45
3.2 CURRENT A PPROACHES TO RISK A SSESSM ENT ... 46
3.3 D ETERM INISTIC RISK SCORE... 47
3.4 PROBABILISTIC RISK SCORE ... 52
4 PILO T ... 55 4.1 A PPLICATION D EVELOPMENT ... 55 4.1.1 Process... 56 4 .1 .2 R e s u lt... 5 8 4.1.3 Lessons Learned ... 60 4.2 PILOT EXECUTION... 60 4.2.1 Pilot Participants... 61 4.2.2 D esired Outcom e ... 61 4.2.3 Lessons Learned... 63
4.3 PILOT RESULTS AND ANALYSIS ... 63
4.3.1 Third Party D ata... 65
4.3.2 Risk M etric... 66
4.3.3 Cost Savings... 67
5 IM PLEM EN TATIO N ... 70
5.1 TOTAL COST OF O WNERSHIP AS RISK A SSESSMENT ... 70
5.2 SYSTEM FUNCTIONALITY ... 75
5.3 SUGGESTED A LTERNATE COMPONENTS... 76
5.4 SOFTW ARE PLATFORM ... 77
5.5 CHALLENGES AND BARRIERS... 81
5.6 LESSONS LEARNED ... 82
5.6.1 D riving Change from a Corporate Group ... 83
5.6.2 Centralized IT in a D ecentralized Company ... 83
5.6.3 Project Challenges in Tight Econom ic Tim es... 85
5.6.4 Alignm ent of M etrics and Incentives... 86
5.6.5 New System Valuation... 87
1 BACKGROUND
This thesis is centered about an internship project performed with Agilent Technologies
during the summer and fall of 2001. The internship focused on the new product development
process, and specifically on the assessment of the components chosen by design engineers for
their products. The organizational home for the internship was a corporate organization, Design
Chain Solutions (DCS), but the target users of the work were the engineers in the product
divisions.
This chapter provides some background on the importance of new products to Agilent, the
organizational and cultural environment in which the project was performed, and the economic
situation in which Agilent found itself at the time of the work. The internship project, problem
statement, project parameters, and the project goals are also introduced.
1.1 COMPANY
Agilent's businesses date back to the beginnings of the Hewlett-Packard (HP) Company,
which was founded in 1939. HP's first products were the ancestors of the test and measurement
equipment that now make up Agilent's largest division. In 1999, HP decided to spin off some of
its core businesses into an independent company. This independent company became what is
Ws ch 2,19 99 Nove
HP announces creation of Agiler
two independent companies an ind
July 28, 1999 Agilent's name is introduced
Figure 1. Agilent's Road to Independence'
rnber 1, 1999
t starts operating as ependent company
1.1.1 Divisions and Products
Agilent is divided into three primary divisions: Test and Measurement, Semiconductor Products, and Chemical Analysis and Life Sciences. For each of these divisions, the rapid introduction of innovative new technologies and products has historically played a critical role in HP/Agilent's strategy.
'Figure taken from Agilent Profile Slides, Agilent Technologies, Inc., 2001
June 2, 2000 Agilent becomes fully independent Novem!rber 181, 1999 Agilent's IPO takes place row
General Counsel John Scruggs ProduICts and Life Sciences
Craig Nordlund Bill Sullivan Chris van InUen
I I R 's Organization
Jean1Haloran M s nt
Sales, M and Mv CuIstOmer SuIpport
Larrn Holmberg Electronic Products
CTet a M cations tni SOtLetions ,and
Bill Hahn Byron
Anderson-CTO
-Tom Saponas
Figure 2:- Agilent's Organization
1. 1. 1.1 Test and Measurement
The Test and Measurement division is the largest division, generating 65% of revenue. Test and Measurement has three subdivisions or groups: Automated Test, Communications Solutions, and Electronic Products and Solutions Group (EPSG). Agilent considers the core businesses of Test and Measurement to be communications test equipment, electronics test equipment, automated test equipment, and services. Opportunities for future development include optical
broadband, data networking and wireless test equipment as well as broadband network
monitoring and network management software. The semiconductor test group is working to
The internship project, while designed to address all of Agilent's businesses, focused on EPSG. EPSG designs and manufactures electronic instruments such as Spectrum Analyzers and Component Test Devices.
1.1.1.1.1 Semiconductor Products
The Semiconductor Products division is the next largest in Agilent, accounting for 24% of revenue. Core businesses of this division include fiber optic communications, high-speed networking, RF/microwave devices, imaging devices, infrared components, ASICs (Application
Specific Integrated Circuits) and optoelectronics. Some of the areas the Semiconductor Products division is currently developing are gigabit networking, cellular chipsets and wireless appliances.
1.1.1.1.2 Chemical Analysis and Life Sciences
While currently the smallest division in Agilent, contributing only 11% of revenue, the Chemical Analysis and Life Sciences division is probably the most exciting. This division is Agilent's emerging market investment, and is projected to grow astronomically in the coming years. The Chemical Analysis and Life Sciences division plays in the genetic solutions space, aiding drug discovery and diagnostics work. The core businesses are gas chromatographs, liquid chromatographs, mass spectrometers and services and supplies. Areas for opportunity include bioinstrumentation and microfluidics.
1.1.2 Structure
Agilent, as would be expected, retained much of the structure and culture of HP after the spin-off. A highly decentralized organization was the result. One of the motivations for having
a decentralized organization is to increase the speed of innovation and decision-making, resulting in a fast-moving and flexible organization. A common disadvantage of decentralized
organizations is lack of shared learning and best practices across divisions. Agilent is representative of decentralized organizations on both fronts.
Sharply contrasting with my previous experience at Intel, Agilent's decision-making structure seems to be somewhat of a "free market" model. While Intel urges teams to make use of the "disagree and commit" policy, a decision at Agilent will remain unmade until all decision makers agree. Another sharp contrast is Agilent's lack of cross-functional management
committees that are endowed with top-down decision-making authority. The decentralized structure lends itself to an adoption-oriented model of implementation. For example, at Intel I would have developed the Early Materials Risk Analysis (EMRA) tool, and tested it in a group designated by a Steering Committee. I would then return to the Steering Committee to present my results, and with their buy-in, would begin an implementation and training program in which the users had no choice but to use the tool. The Steering Committee would expect to see
frequent reports on the metrics, therefore requiring a certain frequency of tool use. Conversely, at Agilent I worked at the lower levels of the organizational chart, using influencing skills to garner support for my project. I reported my findings and progress to Design Chain Solutions (DCS) management, but they were not empowered to dictate the participation of a pilot group or the usage of the EMRA tool.
During interviews in an effort to generate project support and a list of requirements for the EMRA tool, interviewees stated repeatedly "if the tool doesn't meet X requirement, no one will
use it". This supports the thesis that Agilent is a free market model. If a user, or an entire group of users, doesn't want to adopt the EMRA tool, they simply won't. The only reason they will use it is if they find it to be useful to their business. Decentralization and lack of cross-functional management committees allows each division to make its own decision about which tools to use. Convincing groups to use a tool requires demonstrating the usefulness of the tool to that
particular group, and customizing it to suit their needs.
There are, of course, pros and cons of the free market model. On the downside, anyone encouraging use of a new tool will need to put a huge amount of time and effort into convincing each and every group of its benefits. A lot of support will be required to provide customization required to encourage usage. And, of course not every group will end up adopting the system, so getting any kind of standardized tool to be used Agilent-wide is next to impossible. On the positive side, each group is empowered to do what's best for that group. A decision not to use a given tool may very well be the right decision for that group. We just need to beware of local optimization when global optimization may yield a larger overall benefit. Another positive aspect is that people who have a choice about adoption will tend to be more committed to the program. If they use the tool or support its use, it is because they truly believe it to be a valuable tool.
1.1.3 Culture
Agilent's documented values are: 1. Innovation and contribution 2. Trust, respect and teamwork
3. Uncompromising integrity 4. Speed
5. Focus
6. Accountability
The first in the list, innovation, is a take-away from HP culture. The HP slogan is "Invent". The Agilent slogan is "Innovating the HP way". Clearly there is a very strong focus on and respect for the creative innovation process at Agilent. Since the internship goal was to introduce operational focus during the innovation process, this first value played a big role in the project and learning.
Another observation of Agilent culture came during the discovery process - figuring out how to get things done. It quickly became clear that at Agilent, you get things done through people. The social contact and reliance on one's personal network to be successful is probably one of the reasons people love working there and tend to stay at Agilent for their entire careers.
Since the project was on a tight timeline and I was completely unfamiliar with the landscape, I required a lot of help, especially initially. My project mentors helped get me in touch with key players. I met with these people individually, to get their thoughts on my project and to begin to build relationships. They, in turn, gave me names of other people who had particular expertise or access to resources I would need to continue the project. I was very impressed with the knowledge and friendliness of everyone I met with. I truly enjoyed my experience at Agilent, primarily because of the great people I was privileged to work with.
However, someone objectively observing the situation may be concerned with the abundance of tacit knowledge within the company, especially given the recent and forthcoming employee cutbacks.
1.1.4 Economic Climate
At the time of the internship, several measures were being undertaken to mitigate the impact of the severe economic downturn. In March of 2001 a company-wide 10% pay cut was
implemented, resulting in a $280 million annual savings. While the pay cut was unpopular, employees seemed willing to sacrifice a little bit personally for the better good of the company -to avoid layoffs. This offers strong evidence of the people-centric Agilent culture. "This was a matter of saving employees," says Stacy Yu, 25, who handles marketing for fiber-optic products. "It sounds hokey, but it's like a family. Everyone knows that we have to chip in to make sure that everyone else is okay."2
Another measure instituted was a push within the R&D ranks to get new products out the door. According to Agilent CEO Ned Bamholt, "We really have accelerated some of our most important R&D programs, because we know our secret weapon in downturns like this are new products. Even if our customers are in tough shape, if you can come up with a product that can save them money or help them grow their revenue, they are willing to look."3
2 Daniel Roth, "How to cut pay, lay off 8,000 people, and still have workers who love you", Fortune, 4 Feb 2002,
62-68
Despite these efforts, severe discretionary cost cutting, and the sale of Agilent's Healthcare Division to Philips Electronics for $1.7 billion, sales were plunging and Agilent was running out of cash. Ned Barnholt and the other Agilent executives came to realize that cuts in the workforce were the only remaining option.
The first round of layoffs, 9% of the workforce or 4000 employees, was announced in August, 2001 and was complete by mid-September. Barnholt and the management teams executed the layoffs with the utmost respect to employees. Barnholt himself announced the cuts over the company PA system before announcing to Wall Street. He wanted the employees to hear it straight from him before they read it in the news. In the address, he explained the rationale for the cuts and how the number of layoffs was determined. "This is the toughest decision of my career," he said, sounding fatigued. "But we've run out of alternatives."
The second round of layoffs, another 4000 employees, was announced on November and was completed by the end of January 2002. Even with significant workforce reductions, Agilent employees, including the ones losing their jobs, did not seem to resent the company. They seemed to understand that the cuts were an absolute last resort, and that they were necessary casualties of a depressed economy.
1.2 INTERNSHIP PROJECT
The project sponsors, managers in Agilent's corporate Design Chain Solutions (DCS) group, worked with the LFM administration for several months to develop the Early Materials Risk
Analysis (EMRA) project. Being in corporate group provided a different vantage point of the organization than that of a particular division.
DCS was formed to provide organization-wide focus on supply chain initiatives at the product design level. The mission of DCS' parent organization is: Through enterprise process leadership and world-class hosted services, Enterprise Supply Chain Services (ESCS) delivers investment flexibility to achieve financial goals, a segmented total customer experience and compliance with regulatory requirements together with our business partners to Agilent, customers, suppliers and partners.
DCS' Mission is: Provide Agilent Business Units with the competitive advantage to develop and deliver its products and services by creating and sustaining:
" The central product generation system
" Processes and tools that decrease time-to-volume and lower cost of sales " Linking the design environment into order fulfillment processes
" Turning critical information into design expertise4
Both the ESCS and DCS organizations were formed from similar groups within HP.
1.3 PROBLEM STATEMENT
The impetus for the internship project came from a costly problem identified in EPSG, specifically an obsolescence risk with board-mounted commodity components. Although the
result of the work was to be applicable company-wide, the scope of the internship was thereby focused on EPSG.
Each of the EPSG instrument designs consists of several printed circuit boards, with board-mounted electronic components. Teams of electrical design engineers in this group divide the work up by board, with each engineer developing 1-2 boards per project.
There are some existing tools and methods for assessing a new design's material risk in EPSG. These methods are manual, cumbersome, have a slow feedback time, and occur late in the product development cycle. Imperfections in current materials risk analysis methods allow
inclusion of sub optimal components in new designs. Once these designs reach production, the manufacturing organization has to deal with component problems such as obsolescence, lengthy lead times, or disruptions in supply. Historically the manufacturing organizations have
addressed the problems by purchasing and holding in inventory all of the projected parts requirements for the lifetime of a product, qualifying a replacement component, holding a large
amount of safety stock for a long lead time item, or counteracting parts quality problems in assembly.
The goal of the internship was to develop a risk analysis methodology that can be applied by design engineers early in the design cycle to assess the materials risk of their designs. The effectiveness of the approach designed was to be tested in a proof-of-concept pilot program.
1.3.1 Proposed Solution
Before the internship officially began, it was clear that the project sponsors had a mental model of the results of the project. They envisioned an automated Bill of Materials (BOM) grading tool that would replace or supplement the existing risk analysis methods and inform the design engineers of risky components included in their designs. This new tool would provide real-time risk analysis to designers, and could be used very early in the product design cycle.
1.4 CONCLUSION
The internship was undertaken during a difficult time for Agilent, making it difficult to get financial and human resources for parts of the project. However, cost savings and reduction of time to volume are crucial to the organization. Consequently, the project was supported at high levels of the organization, and ultimately was successful.
2 PROBLEM DESCRIPTION
This chapter describes the specific problems that the internship project was initiated to address. It describes how the materials selection and risk analysis processes presently work, including which groups are involved and when in the new product development cycle these processes occur. Additionally, the information technology tools that currently support the materials selection decisions and risk analysis processes are described. Next, the problems with the current system are investigated, with focus on sub optimal outcomes such as lengthening time to volume and obsolete inventory, and poor processes such as decisions being made late in the process and evaluation output being unusable. The work undertaken by the DCS group to remedy the problems is discussed.
2.1 PROBLEM STATEMENT
The problems that initiated the internship project were twofold. First, problems with the current materials risk analysis process were becoming increasingly apparent. Risk analysis was being performed late in the design cycle, when design changes were difficult to make. Also, the
turnaround time for risk analysis was much too long, delaying the feedback time to designers.
The second problem was a more immediate and urgent component obsolescence problem, caused when a manufacturer decides to discontinue a part currently included on a manufactured instrument. Component obsolescence was, and continues to be, very costly to Agilent, and has contributed to very large raw materials inventories.
Evidence of both of these problems, as well as an assessment of the magnitude of the problems is presented in the next sections.
The sponsors of the project saw that improving the materials risk analysis methodology could both improve the process and mitigate the component obsolescence problem. The Early Materials Risk Analysis (EMRA) internship project resulted.
2.2 MAGNITUDE ASSESSMENT
Since the economic downturn, many companies including Agilent found themselves with huge amounts of inventory on their hands. Production was fully ramped up when customers initially began canceling orders. Finished goods inventory and work in process (WIP) began rapidly piling up. The information lag between the order entry process and raw materials purchasing meant that raw materials inventories were building as well.
When times were good and Agilent could sell everything they made, emphasis was on output, not on inventory control. Consequently, a few bad inventory management techniques crept in and remained unnoticed during the boom economy. However, very shortly after the downturn it was very clear that Agilent had an inventory problem, and several task forces were initiated to identify and resolve it.
A first step was to identify what kinds of goods were in inventory. The results of the study indicated that a surprisingly large portion of all inventories were lifetime buy (LTB) parts. A
description and discussion of LTB components is found in the following section. The exact valuation of the LTB inventory is confidential, but it was sufficiently sizable to command attention at the very highest levels of the organization. The inventory holding costs incurred from LTBs are significant. 60-70% of the total LTB inventory was owned by EPSG. Given the magnitude of the problem, especially the size of EPSG's contribution to it, it is easy to see why the problem was receiving so much attention.
2.3 OPTIONS FOR DISCONTINUED COMPONENTS
When Agilent becomes aware that a part has been discontinued, a discontinuation notice is issued by corporate procurement. Then each division using the part must assess their options: (a)
find a drop-in replacement part, if one exists, (b) do a lifetime buy, (c) do a total redesign to qualify a new part, or (d) do a bridge buy which is a combination of (b) and (c).
2.3.1 Drop-in Replacement
If another part exists that has the same form, fit and function of the discontinued part, it can be substituted directly into the manufacturing line. Administrative costs, estimated at several thousand dollars, are still incurred to process the discontinuance, notify customers of the change,
etc. In addition, a new part number must be set up in the systems, inventory systems initiated, and manufacturing processes adjusted if necessary. The drop-in replacement is the least costly option, but still has significant cost and resource impacts.
2.3.2 Lifetime Buy
When a drop-in replacement part is not available, performing a LTB is the next least painful solution, and for this reason is selected often. A LTB consists of estimating the total divisional demand for the discontinued part over the entire life of the products it is used in, and then purchasing that amount of the part before the manufacturer actually shuts down the line. Demand estimation is, to say the least, an inexact science. Underestimating this demand could be disastrous, as a shortage would force a redesign very late in the product's lifecycle when the cost of the redesign would not be recovered. Overestimating the demand results only in
additional inventory, and hence is the preferred side to err on. As previously discussed, the inventory holding costs incurred from LTBs are significant, and have recently received a lot of attention from Agilent management.
2.3.3 Total Redesign
Sometimes a LTB is not a viable option, either due to the prohibitive expected costs, or the inability for a supplier to deliver the amount of inventory required for a LTB. In these cases, a major redesign is required. Potential replacement parts must be thoroughly investigated, tested, and qualified. The time and materials costs that go into a major redesign can easily cost 10-20 times more than a drop-in replacement.
2.3.4 Bridge Buy
A bridge buy occurs when the decision is to perform a redesign, but the expected duration of the redesign effort exceeds the current inventory stock for the discontinued part. So, a mini-LTB is ordered to supply the manufacturing line while the redesign efforts are underway.
2.3.5 Summary
Clearly none of these options are without cost, and some of them have a high impact on Agilent's cost structure. Finding a way to minimize component discontinuances would be very valuable.
2.4 OBSOLESCENCE MANAGEMENT OUTSIDE AGILENT
Component obsolescence is not isolated to Agilent - it is a significant global problem for corporations and government organizations. The problem is of such magnitude for the US military and its contractors that a joint organization, the Government-Industry Data Exchange Program (GIDEP), was formed to address it.
Additionally, a couple of companies have undertaken predictive obsolescence initiatives. The goal of these initiatives is to assess the likelihood of component discontinuance over a given timeframe, or to predict the time at which a component will be discontinued.
2.4.1 GIDEP5
GIDEP is fully managed and funded by the U.S. Government. It provides an automated mechanism for the military and industry to share critical design and manufacturing information. Subscribers find information in six primary categories: (1) engineering data on parts,
components, materials and processes, (2) failure experience data as a result of ALERTs, Problem Advisories, etc., (3) metrology data such as calibration procedures and technical manuals, (4) product information data including product discontinuance notices, product change notices (PCNs), and Diminishing Manufacturing Sources and Material Shortages (DMSMS), (5)
reliability and maintainability data on failure rates and replacement data, and (6) urgent data request, which allows subscribers to query the GIDEP community for urgent problem resolution assistance.
GIDEP subscribers, and DMSMS subscribers in particular, are all facing similar problems with component obsolescence. They meet annually to discuss the year's progress, share best-known methods, and set goals for the future. Presentations from the conferences generally have three common themes. One is the need for avoiding designing in components that are known to be "bad" (the goal of the EMRA project). Another is the need to reduce the impact of
component obsolescence, realizing that it is an inevitability given the comparative lifecycles of products vs. components. And the last is the need for a way to predict during design when a component is likely to be discontinued, a.k.a. predictive obsolescence.
In December of 2000, the Department of Defense adopted the DMSMS management practices, which prescribe the following eight-step proactive approach to managing component obsolescence6:
1. Before introducing a new product, verify the obsolescence status of all designed-in components as early as possible in the design process.
5 Information via the official GIDEP website at http://www.gidep.corona.navy.mil/datainf/faq.htm
2. Avoid designing-in sole source components and be sure to look beyond a single vendor's line card when evaluating options.
3. Select packaging adopted by multiple manufacturers, drop-in equivalents are the easiest alternative to redesigns when faced with an obsolete component.
4. When testing a board, include potential drop-in replacement components from different manufacturers and sources in the testing process to pre-qualify potential alternates. 5. New technology is always subject to revisions; consider this risk and weigh it carefully
against the relative value of the new capabilities offered by such technology.
6. Assess the risk of a given component going obsolete in the future by studying how many manufacturers are picking up and dropping that technology or packaging.
7. Establish a method for tracking products and their components and regularly verify the obsolescence status of all components for all projects throughout the product lifecycle. 8. When using 5-volt devices, consider using a voltage regulator (or providing alternate
power sources near high risk components) that can adapt to the different current requirements of manufacturers' components.
One of the methodologies employed to address the component obsolescence problem by large government agencies and contractors, as well as large companies, is a partnership of sorts with suppliers. A well-designed partnership can ensure that a supplier knows the criticality of, and expected demand lifetime for, a component in their portfolio. It can ensure that suppliers notify key customers when they are considering discontinuing a product. It can also ensure suppliers collaborate with customers to replace discontinued components with components that are easy drop-in replacements. HP has recently experimented with a "portfolio" technique of
contracting with suppliers. "Under the portfolio model, HP enters into a structured contract with suppliers. Anticipating future component pricing trends and evaluating what its longer-term requirements will be, HP agrees to buy a set amount over a period of time. The OEM assumes the risk for that volume, regardless of changes in market conditions or fluctuations in supply or demand. In return, suppliers will likely provide better pricing, know up front what HP's commitment will be over an extended period, and be able to plan resources accordingly.7" Agilent, due to its relatively low volumes and high mix of products, does not have sufficient power with its suppliers to form this kind of partnership. Figure 3 demonstrates alternative supplier strategies based on degree of risk and amount spent for each supplier. Agilent's supplier strategy is shown in the lower right hand quadrant of the matrix; clearly this is not an optimal place to be. $ Spent HI with Supplier LO LO HI
Risk Associated with Supplier
Figure 3: Agilent's Supplier Strategy
7 Jennifer Baljko Shah, "HP Focuses On Procurement Risk-Sharing ", 29 October 2001, EBN, 52
Corporate Partnership Contract
BAD - supplier has all Commodity power (Agilent here too
Mat'Is much due to low volumes)
2.4.2 Predictive Obsolescence
There are at least two firms that are attempting to predict when a component will be
discontinued. Both are targeted at the early design phase, in an attempt to inform of the expected remaining lifetime of a component under consideration for new design.
i2, as part of their extensive software suite, offers customers a subscription to their
component database. One of the fields maintained for certain categories of components is Years to End of Life (YTEOL). YTEOL can be < 1 year, 1-4 years, 4-8 years, or > 8 years. i2
considers the YTEOL algorithm to be a very valuable piece of intellectual property, and hence did not disclose the detailed formula. They did list the primary attributes that are included in the calculations:
* Information directly from suppliers - when the supplier anticipates discontinuing the part * Sales volumes
* Manufacturer-specific history - conditions under which they tend to discontinue parts * Adoption rate
" Agencies' technical roadmaps " i2's own technical roadmap
" PCN (part change notice) alerts " Agencies' market trend analysis
The company obtains and maintains much of this information from suppliers via telephone and e-mail, coordinated through a large call center in India. i2 was unable to provide validation to indicate the historical accuracy of the YTEOL metric.
Many companies are concerned about the legal ramifications of offering such a metric, because if potential customers do not purchase a component because of its short YTEOL, that
directly affects the manufacturer's bottom line. If the manufacturer believes the prediction to be unfair, they may take legal action.
The second company that has taken an approach to predictive obsolescence is R. Morley Inc. (RMI). RMI is a consulting firm specializing in leading edge manufacturing technologies. InvisiTech, an RMI affiliate has proposed using the theory of Loosely Coupled Sets (LCS) to attempt to predict component obsolescence.
LCS, roughly defined, describes the relationship between the number of measurements and the accuracy of those measurements. Calculated accuracy of the result increases linearly as one
increases the accuracy of any one of the measurements. However, calculated accuracy of the result increases exponentially as one increases the number of measures. The key is that as the number of measurements increases, the necessary accuracy of those measurements can decrease
significantly and still maintain the desired calculation accuracy. Putting it into predictive obsolescence terminology, instead of requiring a very accurate component lifecycle metric, one could theoretically use several less-accurate measures such as volume, number of customers, and sales margin and obtain the same, or better, level of predictive accuracy.
RMI proposed a development effort for LCS as applied to predictive obsolescence to a software company and several industry partners. The partners would provide the necessary funding for the project in exchange for a limited-term exclusive license for the fruits of the project. However, as the economy and the proposed partners' profits continued to deteriorate, the project was, and remains, tabled.
RMI is only one of the organizations working on predictive obsolescence initiatives, but the LCS approach is unique to RMI. Thus far, i2 is the only company to market a predictive
obsolescence metric.
2.5 PRODUCT DESIGN PROCESS
This section first describes who is involved in making materials selection decisions, and the computer support systems they make use of. Next, the new product development process is introduced, with emphasis on when in the process materials decisions are made.
2.5.1 Sonoma County EPSG
The project scope was confined to a focus on the Electronic Products and Solutions Group (EPSG) division in Sonoma County, California. Therefore, most of the descriptions of current process below refer to this specific group. The functions in the Sonoma County EPSG group that played a role in the EMRA project are: (1) R&D Engineers across three Product Generation Units (PGUs) - Signal Sources, Spectrum Analyzers, and Component Test, (2) divisional
Materials Engineers who support the PGUs and are generally assigned by commodity, (3) divisional procurement group, (4) NPI planners, who manage materials, new part setups, and potential manufacturing issues on the design teams, and (5) an Order Fulfillment (OF) site that manufactures many of the instruments designed at the PGUs.
R&D electrical design engineers primarily design in one of two Computer Aided Design (CAD) programs - Mentor or Electrical Engineering Design Program (EEDP). Mentor is a widely used sophisticated commercial CAD program. EEDP was designed in-house many years ago, and has survived several attempts to phase it out. It appears that EEDP is still used because it supports some mechanical geometries and properties that Mentor does not, and some designers simply have not learned Mentor and are more comfortable and faster at using EEDP.
2.5.2 Design Phases
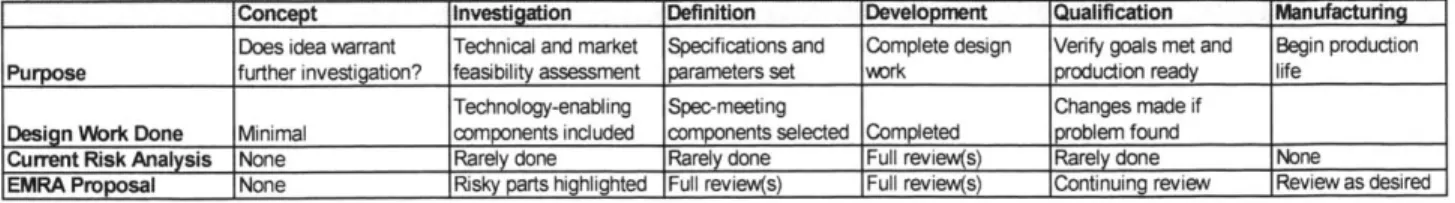
EPSG has a well-defined Product Lifecycle Process to "provide a common 'roadmap' of expectations across organizations" and "provide a standardized model for product development efforts around which improvements may be identified". After each phase, a checkpoint review is held with PGU management to ensure that all phase deliverables have been met before moving into the next phase. The length of each phase varies significantly by product, but the entire product development cycle is generally on the order of one to two years. The table in Figure 4 summarizes the new product development process and the role of materials risk analysis in each. Note that the proposed EMRA process will have materials risk assessment done much earlier in the product development process than it is currently done, and once started will happen on an ongoing basis throughout development.
Concept Investigation Definition Development Qualification Manufactudng Does idea warrant Technical and market Specifications and Complete design Verify goals met and Begin production Purpose further investigation? feasibility assessment parameters set work production ready life
Technology-enabling Spec-meeting Changes made if
Design Work Done Minimal components included components selected Completed problem found
Current Risk Analysis None Rarely done Rarely done Full review(s) Rarely done None
EMRA Proposal None Risky parts highlighted Full review(s) Full review(s) Continuing review Review as desired
Figure 4: New Product Development Process
2.5.2.1 Concept
The purpose of the Concept phase is to determine whether or not the potential product is worthy of further investigation. Usually there is little to no design work done in this phase, since the goal is simply to determine if the idea has merit.
2.5.2.2 Investigation
The purpose of the Investigation phase is to determine feasibility of the product idea, both from a market and a technical standpoint. Technical feasibility can only be effectively assessed if some degree of design work has been done. Design engineers verified in interviews that a good portion of the initial design work is completed as part of the investigation phase, although it is generally only a couple of months long. This is a very "fun" time for designers, since they are fully utilizing their extensive creative and problem solving skills. The focus of the Investigation phase is technology - designing a new capability or making a substantial performance
enhancement. An effective materials risk analysis methodology will give designers a tool to avoid using risky materials during this critical phase that will not detract their focus from the technology.
2.5.2.3 Definition
The purpose of the Definition phase is to assess the development and testing requirements for each of the boards in the instrument. The product specifications and technological
parameters are defined during this phase.
2.5.2.4 Development
The purpose of the Development phase is to design the product according to the
specifications set in the Definition phase. This is the phase in which the design work is the most intensive, when prototypes are created and tested, when designs are refined. Currently, most materials risk analysis and changes to components are made during the Development phase.
2.5.2.5 Qualification
The purpose of the Qualification phase is to verify that the specifications and goals set in the Definition phase have been met, and to confirm that manufacturing and the supply chain are ready to support production.
2.5.2.6 Manufacturing
There are several sub-phases of the manufacturing process, but in essence the product begins its production life. Once the product passes the Qualification checkpoint, production engineers become responsible for the product design. If a component is discontinued, production engineers are responsible for any redesigns required.
2.6 PARTS SELECTION PROCESS
The last section described when, in the larger product development process, materials selection takes place. This section describes how it occurs, both historically and presently. The
current parts selection process for new designs makes use of Agilent preference codes (described below) and standardized part search mechanisms. Throughout the years, EPSG materials
engineering has provided design engineers with many tools to allow effective parts selection.
2.6.1 Lab Stock Evolution
Twenty years ago, a large depository of components called Lab Stock was maintained at each development site. When a designer needed a component, he or she went to Lab Stock, got a component and plugged it into his or her board. If he wanted to utilize a component that was not kept in Lab Stock, he had to fill out several forms and wait for the part to be ordered. Given the pain of this process compared to the ease of grabbing something out of Lab Stock, all incentives were aligned to ensure designers used the Lab Stock as much as possible. Therefore, to ensure the maximal use of preferred parts in new designs, materials engineering and procurement simply needed to limit the Lab Stock to preferred parts.
As technology developed, designers made increasing use of computers to complete their designs, rather than physically building breadboard models. By the time the first prototype was developed, many of the components had already been selected electronically. Control over use of preferred parts began to diminish. To combat this trend, materials engineering and
procurement developed some tools to assist the designers in making the right choices while designing electronically.
2.6.2 Part Preference Determination
Agilent preference code is the existing system through which components are rated, and that rating is communicated company-wide. The preference code is determined by the Materials Engineering organization at the enterprise level and the division level. Preference codes are 1, 2, 3, or 4, in descending order of preference. Code 1 parts are considered to be "recommended for new design", while Code 4s are not to be used. Some Code 3s and 4s also have a secondary alphanumeric coding to indicate why the part is coded this way. For example, a Code 4X is a part that has been discontinued by the supplier. In addition, sometimes a # or a ? are used to indicate a changing or unknown preference code. These are intended to throw a "red flag" for the designers. A sampling of preference codes that may be encountered and their associated meanings are shown in Figure 5.
Code Interpretation
1 Recommended for new design
2 Recommended for new design, but less ideal than Code 1 3 Not recommended for new design, but OK if no other option
3A Sole source
4 Not recommended for new design
4X Part has been discontinued by the supplier
# Preference code is changing
7 Preference code is unknown (may be new part)
Figure 5: Sample Preference Codes
2.6.3 Parts Selection Mechanisms
Each year, an internally generated Parts Selection Guide (PSG), with a listing of the parts that are "recommended for new design" is published in hard copy and soft copy. Given the ease of grabbing a PSG off the shelf and finding a part, this remains a popular method of parts
selection. This practice is somewhat concerning, because part preference can change quickly
-more quickly than the PSG is updated.
The latest and greatest parts selection tool in EPSG is the internally developed CAD Data Store (CDS). CDS permits part searches on parameters, partial part number, etc. When search results are displayed, they are displayed in order of Agilent preference code. Therefore, a designer selecting the first part in the list is necessarily selecting the "best" part. CDS also has the capability to drag and drop the component geometry directly into Mentor. CDS is clearly superior to the hardcopy PSG, but not all designers have yet converted to using it.
2.6.4 Leveraging
"Leveraging" or "reuse" is another common, and highly encouraged, practice among the design community. This refers to the practice of utilizing a board, or portion of a board, from a previous design in a new design. Leveraging speeds up the product development cycle because designers can begin their project with a portion of the design already complete. It also improves manufacturing flexibility since more products make use of some of the same components.
A common misconception among the design community regarding leveraging is that
leveraged boards, since they went through the Materials List Analysis Review process (described below) and were approved at some point, do not have materials issues. In fact, it is quite the opposite. It is highly likely that some of the components were discontinued in the intervening time between when the leveraged board was designed and the new board was designed.
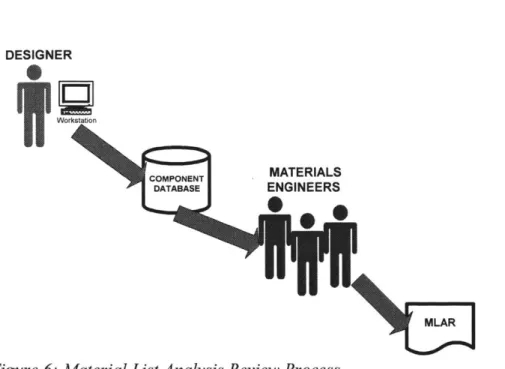
2.7 MATERIAL LIST ANALYSIS REVIEW
The Material List Analysis Review (MLAR) is the existing system for assessing the
materials risk of new designs before they are sent to Order Fulfillment. The process begins when a designer uploads his material list file to an automated system, usually at the encouragement of his NPI planner. As discussed in the previous section, this occurs most frequently during the
Development Phase, and occasionally during the Investigation or Definition Phases.
The system runs a query of the Materials Specification Master (MSM) database, and outputs a very long, complex, difficult-to-interpret pipe-delimited ASCII text file. The file lists all of the parts in the design (usually hundreds of parts), in order of preference code. Information included in the file is Agilent part number, preference code, reference designator (location on the board), part description, part performance parameters, and category code. Since all of the information is in text, with little formatting, it is not easy to read. In addition, the Code 3 and 4 parts are listed at the bottom of the file, so one must scroll all the way to the bottom to get to the risky parts. In general, the MLAR output is not user-friendly.
The next step in the MLAR process is for divisional Materials Engineers to follow up on the Code 3 and Code 4 parts, and find recommended replacements for them. Once they have
determined which part to recommend as a replacement, they will fill this information into the "notes" section in the MSM database. When all Materials Engineers are finished making their recommendations, the MLAR report is returned to the designer. This process typically takes
that was originally generated, but with the recommended replacement notes added to the Code 3 and Code 4 parts.
DESIGNER
Workstation
COMPONENT MATERIALS
DATABASE ENGINEERS
MLAR
Figure 6: Material List Analysis Review Process
According to designer interviews and a pre-pilot survey, the MLAR is run 1-2 times per board, most frequently during the development phase.
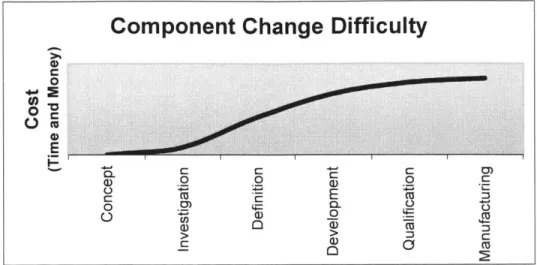
Figure 7 demonstrates a general framework for understanding the increased relative costs of making changes later in the design cycle. In this particular case, discovering a component problem later in the design cycle causes more pain to make the change than if it were discovered right up front. This diagram makes the case for the sub optimality of the existing materials risk analysis process, because it is undertaken so late in the development process.
Figure 7: Relative costs of making component changes late in the product development cycle
In summary, the current MLAR process is sub optimal on several levels, most notably the lack of usability and the delay time between submission of the materials list and completion of the report. The impact of being difficult to read and interpret is that designers dislike having to sift through the file to get to the relevant information. This may lead to avoidance of the process altogether, resulting in the current situation where designers often wait to run the process until they are urged to do so by their NPI planner.
The impact of the two-week cycle time is more significant. The designers are often on a very tight time schedule, and in the space of two weeks they can be on to a new project phase, with new goals. They will have further developed the design, adding other components that are sometimes dependent on, or complementary to, a part that is discovered to be risky. Going back to replace a risky part at best is frustrating, since the designer must essentially return to the parts selection process that he thought he had completed. Worse, an entire chain of components must
Component Change Difficulty
0
0!0
M 40
0a a)0 .
be changed out to eliminate the risky part, costing the designer precious time and potentially impacting the time to volume. In the most costly scenario, a new prototype must be built and tested to verify that the new, non-risky part(s) will perform as desired. In this case, significant direct cost is incurred to build and test the new prototype, and the schedule will likely be impacted as well. It is not surprising, then, to find that sometimes designers choose not to change out a risky part when it is discovered too late in the process. By making this choice, the designer trades off the cost of a redesign or lifetime buy in favor of schedule.
2.7.1 Design Engineer Survey Results
Both of these problems were very clearly happening at Agilent, as was verified after conducting a survey prior to designing and testing the new materials risk analysis tool. Two of the questions gauged the frequency with which the designers discover risky parts from the MLAR process. Responses indicated that they almost always find that they have inadvertently selected a risky part. Not surprisingly, they even more frequently find that a leveraged part of their design makes use of risky parts.
Probably the most poignant discovery from the pre-pilot survey was the fact that the designers do not always change out risky parts with the recommended replacement parts.
Subsequent interviews indicated that often the reason is that the discovery is made too late in the process and the pain/cost level for making the change is assessed to be too high (refer again to Figure 7). This is a clear indication that the current process leaves significant room for
2.8 DECISION SUPPORT SYSTEMS
This section describes the information systems that support the materials decisions. Although not officially part of the original problem statement, Agilent is undertaking a major revolution of their data/decision support systems. A transition to an Enterprise Resource Planning (ERP) platform complete with a Product Data Management (PDM) module is
underway, with phased company-wide implementation beginning in the summer of 2002. Figure 8 demonstrates the decision structure of the current system. The integrity of decision support systems such as the internal component database are critical to the players' abilities to make decisions that positively affect Agilent's business.
Agilent's internal component database is called the MSM, for Materials Specification Master. The MSM is an Informix database that has one original instance and several local instances at most Agilent sites. It houses several fields of data for each of Agilent's parts, active and inactive, including part number, cost, leadtime, and preference code. The MSM is rarely accessed directly by engineers - instead, interfaces such as the CAD software, CAD Data Store or the MLAR process query the database and return relevant MSM data. Although the MSM has served Agilent well for many years, it has significant limitations, especially in the data structure. A proposal to replace the MSM is expected in the next year or so.
The "Decision Support Systems" referenced in the Figure include the MSM database, the ERP system and the PDM system.
Figure 8: Agilent's Decision Support System Structure
2.9 COMPLEMENTARY PROJECTS
The Design Chain Solutions group has several other Design for Supply Chain (DfSC) projects currently underway. Materials Lifecycle Risk Analysis and Next Generation Preference Codes are two that are closely connected to the Early Materials Risk Analysis project.
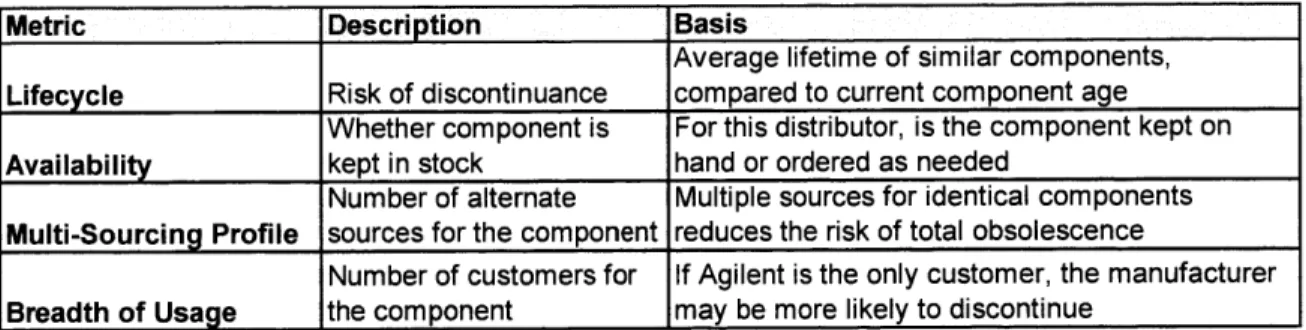
2.9.1 Materials Lifecycle Risk Analysis
This project is an effort to assess the need for, test, and implement component risk
assessment information purchased from a third party. Typical third party risk attributes include Lifecycle (where a part is in its lifespan), Availability (is the part kept in stock or not), Sourcing (sole-sourced vs. multi-sourced), and Breadth of Usage (how many customers are purchasing the
part). Although the Agilent preference code is intended to be the sole assessment of materials risk, there may still be a need for third party data.
First, a third party may have information on a component that is not available in the MSM. This could help decide on selection of a new part. Next, the MSM has hundreds of thousands of components. It is unreasonable to expect that Materials Engineers can keep all of the preference codes up to date at all times. A key benefit of a third party database is expedited processing of Product Change Notices (PCNs) and adjustment of the risk ratings. Lastly, the third party systems provide more information to the viewer. While Agilent preference code indicates essentially "recommended for new design" or "not recommended for new design", third party data indicates why that part is preferred or not preferred. Agilent currently has trial subscriptions to a third party database, and is assessing the viability of the information.
2.9.2 Next Generation Preference Codes
Closely related to both the Materials Lifecycle Risk Analysis and the Early Materials Risk Analysis is the Next Generation Preference Code project. The goal is to assess the possibility of creating an algorithm to dynamically determine the preference codes. This scenario would likely make use of a third party data source as input to the algorithm. The preference codes may be dynamically updated to the MSM, or may require approval of Materials Engineering or others before being updated.
2.10 PROBLEM DEFINITION
The magnitude and complexity of the project could easily occupy a lone intern for several years. In order to keep the scope under control, the project mentors limited the scope and dictated specific project tasks. These tasks were to (1) assess the requirements for a Bill of Materials grading tool, (2) execute a proof-of-concept level pilot program to test the viability of such a tool, and (3) make recommendations regarding the implementation of the tool. The scope was limited to board-mounted commodity components, and the focus group defined as the EPSG
Sonoma County division.
It would be important to design the tool so that it could, and would, be used earlier in the design cycle than the MLAR process is employed.
2.10.1 Expected Impacts
Impacts of having materials risk information early in the design cycle include a reduction in cost of sales due to a reduction in lifetime buys and redesigns. Another expected impact is a reduction in the time to market for new products due to a reduction of design cycle iterations. Yet another is reduction in inventory holding costs due to selection of lower leadtime
components. Lastly, and least measurable, is an improvement in design engineer effectiveness. Effectiveness will be improved when the designers spend less time on parts selection and redesign activities, and more time on the value-added creative design process. This improved effectiveness may result in increased competitiveness (technological capability and/or
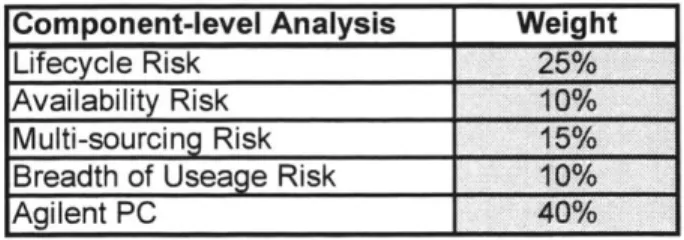
2.10.2 Risk Scoring Methodology and Risk Metric
A key goal of the internship was to determine how to score or grade a Bill of Materials (BOM) or materials list. The vision was to design a single metric that would communicate the risk level of a new design. A successful risk metric would communicate the overall materials risk to a designer, indicating how much materials improvement was required for his design. It would also communicate to management the level of materials risk being incurred by new designs.
2.11 SUMMARY
The challenge for the internship was thus set. The goal was to find a way to both streamline the process of component selection and evaluation during product development, and make the process more effective in identifying and eliminating high-risk parts. The next chapter reviews the approach taken during the internship to resolve the problems and improve the process.
The problem resolution approach was to first determine a risk metric(s) to measure the materials risk incurred by a particular design. Next, an automated application was developed, which took as input a material list and then output the risk score for the design. Finally, a small group of design engineers tested the application and the risk metrics in a pilot program.
3 RISK METRIC AND ALGORITHM DETERMINATION
3.1 RISK METRIC IMPORTANCE
To directly address the component obsolescence and lifetime buy inventory problems, the designers would need to be informed of risky components included in their designs and then replace them with less risky components. Developing an overall risk metric or risk score to assess the status of the board would not directly resolve the problems or improve the current process. However, a risk metric would serve several peripheral purposes, namely to measure materials risk and to provide an incentive for designers to use the EMRA tool.
First, the risk metric would provide a way to measure reduction in materials risk over time. At the project level, the risk score should improve over the product -development cycle so that by the time the product is qualified for manufacturing the materials risk is as low as feasible.
Additionally, risk scores should improve as designers become more accustomed to using the EMRA tool and designs that made use of the tool are leveraged (so that problems with leveraged designs occur only due to changes in component risk status instead of an accumulation of prior mistakes). In the absence of a risk metric, it would be difficult to demonstrate improvement in materials risk due to the EMRA tool.
An effective risk metric will also provide critical incentive for designers to use the risk analysis system. A risk metric can easily be reported and tracked through the management chain. Without a risk metric it would be difficult for project managers and designers to be