Publisher’s version / Version de l'éditeur:
Journal of Applied Polymer Science, 100, 4, pp. 2582-2591, 2006-01-01
READ THESE TERMS AND CONDITIONS CAREFULLY BEFORE USING THIS WEBSITE. https://nrc-publications.canada.ca/eng/copyright
Vous avez des questions? Nous pouvons vous aider. Pour communiquer directement avec un auteur, consultez la
première page de la revue dans laquelle son article a été publié afin de trouver ses coordonnées. Si vous n’arrivez pas à les repérer, communiquez avec nous à PublicationsArchive-ArchivesPublications@nrc-cnrc.gc.ca.
Questions? Contact the NRC Publications Archive team at
PublicationsArchive-ArchivesPublications@nrc-cnrc.gc.ca. If you wish to email the authors directly, please see the first page of the publication for their contact information.
Archives des publications du CNRC
This publication could be one of several versions: author’s original, accepted manuscript or the publisher’s version. / La version de cette publication peut être l’une des suivantes : la version prépublication de l’auteur, la version acceptée du manuscrit ou la version de l’éditeur.
For the publisher’s version, please access the DOI link below./ Pour consulter la version de l’éditeur, utilisez le lien DOI ci-dessous.
https://doi.org/10.1002/app.22744
Access and use of this website and the material on it are subject to the Terms and Conditions set forth at
In Situ Visualization of Drop Deformation, Erosion, and Breakup in High
Viscosity Ratio Polymeric Systems Under High Shearing Stress
Conditions
Mighri, Frej; Huneault, Michel A.
https://publications-cnrc.canada.ca/fra/droits
L’accès à ce site Web et l’utilisation de son contenu sont assujettis aux conditions présentées dans le site
LISEZ CES CONDITIONS ATTENTIVEMENT AVANT D’UTILISER CE SITE WEB.
NRC Publications Record / Notice d'Archives des publications de CNRC:
https://nrc-publications.canada.ca/eng/view/object/?id=30102174-cf7a-44e3-b76d-ae78e0aae419 https://publications-cnrc.canada.ca/fra/voir/objet/?id=30102174-cf7a-44e3-b76d-ae78e0aae419In Situ Visualization of Drop Deformation, Erosion, and
Breakup in High Viscosity Ratio Polymeric Systems under
High Shearing Stress Conditions
Frej Mighri,1,3Michel A. Huneault,2,3
1Department of Chemical Engineering, Laval University, Sainte-Foy, Quebec G1K 7P4, Canada 2Industrial Materials Institute, National Research Council Canada, 75 de Mortagne, Boucherville, Quebec J4B 6Y4, Canada
3Center for Applied Research on Polymers and Composites (CREPEC), C.P. 6079, Stn. Centre-Ville, Montreal, Quebec H3C 3A7, Canada
Received 14 June 2005; accepted 21 July 2005 DOI 10.1002/app.22744
Published online 2 February 2006 in Wiley InterScience (www.interscience.wiley.com).
ABSTRACT: In this paper, deformation and breakup un-der simple shear of single molten polymer drops in a poly-mer matrix were investigated. Flow visualization was car-ried out in a Couette-Flow apparatus under relatively high shear rates and temperatures up to 230°C. Drop/Matrix combinations were composed of polystyrene drops of 0.5– 0.6 mm in diameter in polyethylene matrix, and ethylene– propylene copolymer drops of approximately the same size in polypropylene matrix. The deformation and breakup pro-cesses were studied under steady state and time-dependent shearing conditions. Either for steady state or time-depen-dant shearing conditions, drop elasticity generated at rela-tively high shear rates helped the drops to align
perpendic-ular to the flow direction, i.e., parallel to vorticity axis. Also, the most striking non-Newtonian effects for the high viscos-ity ratio systems were the surface erosion and the drop splitting mechanisms. The particles eroded off the main droplet surface were very fine, in the range of 10 –50 m, and led to a significant reduction in main drop size before its final breakup.© 2006 Wiley Periodicals, Inc. J Appl Polym Sci 100: 2582–2591, 2006
Key words:shearing flow visualization; high viscosity ratio; drop deformation; drop breakup; dispersion by surface ero-sion mechanism
INTRODUCTION
Controlling the dispersion during the blending oper-ation is of key importance in the polymer processing field to improve the properties of existing materials. Much effort in the investigation of blend rheology and the mixing of high viscosity materials has focused on the prediction of droplet deformation and breakup.
To get a better control over blend morphology de-velopment, a fundamental understanding of polymer drop deformation, breakup, and orientation processes under a well controlled-flow field is necessary. The mechanism of drop deformation and breakup in vis-coelastic systems differs from that of Newtonian sys-tems. One of the key factors tied to the Newtonian drop deformation is the ratio of viscous to interfacial forces known as the Capillary number, Ca, which is defined as
Ca ⫽ m␥˙ D/2⌫ (1)
where is the matrix viscosity, ␥˙ is the shear rate, D is drop initial diameter, and ⌫ is interfacial tension. The
continuous drop deformation is expected to occur if the capillary number is greater than a critical capillary number value, Cac. This critical value is a strong
func-tion of the viscosity ratio, k, defined as the ratio of the dispersed phase viscosity to that of the matrix phase. Several papers1– 6review the role of the viscosity ratio
on Newtonian drop deformation.
The critical capillary number, Cac, for
non-Newto-nian drops is usually greater than that of Newtonon-Newto-nian drops. Apart from its correlation with the viscosity ratio, Cacis additionally influenced by drop elasticity.
Mighri et al.7,8 investigated the deformation of vis-coelastic drops in visvis-coelastic matrices for different viscosity and elasticity ratios. Their study indicates that the drop elasticity tends to decrease drop deform-ability, and matrix elasticity has the opposite effect, i.e., increases its deformability. Bartram et al.9studied
the dispersion in viscoelastic systems with zero and low interfacial tension using counter-rotating cylin-ders of a Couette apparatus. Their study was limited to relatively low viscosity model fluid systems and shear rates varying from 0.1 to approximately 5 s⫺1. For systems having a viscosity ratio of 3.3 (polyacryl-amide solution, PAA, suspended in a less viscous polyacrylamide matrix), the authors showed that PAA drops were extended vertically along the vorticity axis
Correspondence to: F. Mighri (frej.mighri@gch.ulaval.ca).
Journal of Applied Polymer Science, Vol. 100, 2582–2591 (2006) © 2006 Wiley Periodicals, Inc.
into a cylindrical shape when shear rate was in-creased. Unfortunately, they did not give any defini-tive explanations concerning the vorticity alignment, but they supposed that polyacrylamide elasticity could have an effect. Elmendorp and Maalcke10
stud-ied the contribution of elasticity on drop deformation and breakup in Newtonian and viscoelastic matrices. They found that the deformation of a viscoelastic drop in a Newtonian matrix decreases with increasing drop elasticity. In contrast, Newtonian drops are less stable in a viscoelastic matrix and drop deformability in-creases with increasing matrix elasticity. Using nylon 66 resins and PS as the matrix phase and ethylene– propylene rubbers (EPR) as the droplet phase, Wu11
found that the steady-state capillary number for these viscoelastic blends is generally about ten times larger than that for Newtonian blends at the same viscosity ratio. Milliken and Leal12studied the behavior of
vis-coelastic drops in a Newtonian matrix under two-dimensional elongational flow. They found that vis-coelastic drops with viscosity ratios k ⱕ 1 have a significantly smaller deformation and critical capillary number than Newtonian drops. However, for vis-coelastic drops with viscosity ratios k ⬎ 1, the defor-mation is similar to that of Newtonian drops. In par-ticular, they found that low viscosity viscoelastic drops do not display the highly deformed steady drop shapes, characteristic of low viscosity Newtonian drops. Sundararaj et al.13 visualized polypropylene
(PP) drop and sheet deformation and breakup inside a PS matrix subjected to steady-state shear between transparent parallel plates. They showed that during shearing, PP drops are first stretched out into sheets then broken into cylinders via different mechanisms, such as hole formation, growth, and coalescence to give ligaments oriented parallel and perpendicular to the flow direction. Using a transparent parallel plate setup, Levitt et al.14 investigated the deformation of
PP drops of different viscosity and elasticity sheared in a PS matrix at a constant rate of 1 s⫺1. For low viscosity ratio systems, they observed a remarkable widening of PP drops parallel to vorticity direction. The authors attributed this widening to the normal stresses exerted by the matrix on the less elastic drop. An analytical relation was established between the second normal stress differences of the drop and ma-trix phases and the degree of drop widening.
Hobbie and Migler15 observed the morphology of
polystyrene (PS) drops in a polyethylene (PE) ma-trix under flow along a transparent slit die installed at the end of a twin-screw extruder. Different PS/PE systems with viscosity ratio up to 240 were studied. The authors observed a variety of droplet shapes as a function of shear rate and viscosity ratio. For strong shear and viscosity ratio of 22, PS droplets were extended normal to the flow direction. The authors assumed that this behavior is related to the difference between drop and matrix elasticity.
Mi-gler16also observed the same behavior for
viscoelas-tic (Boger) fluid droplets deformed in PDMS matrix under shear. The corresponding viscosity ratio was about 0.6, whereas the droplet phase was much more elastic than the matrix phase. Mighri and Hu-neault17 investigated the role played by the
vis-coelastic behavior of drop/matrix phases on the dispersion mechanisms using model viscoelastic systems. The most interesting finding was that the elongation of droplets parallel to the vorticity axis and the elongation dynamics were directly related to the buildup of the normal forces inside these drops.
In the current experimental study, we investigated the dispersion in molten polymer systems under steady state and time-dependent shearing conditions. Particular focus was on the kinetics of drop deforma-tion, orientadeforma-tion, and break-up in moderate to high viscosity ratio PS/PE and EPR/PP systems. The vis-cous and elastic stresses encountered in these systems are several orders of magnitude higher than in model solutions. It is therefore of primary interest to deter-mine whether similar breakup mechanisms observed in low viscosity systems are present in polymer melts. The effect of the shear rate, the viscosity ratio, the interfacial tension, and the temperature on drop de-formability and breakup were studied.
EXPERIMENTAL Materials
The investigated systems were polystyrene (PS) drops in polyethylene (PE) matrices, and ethylene–pro-pylene rubber (EPR) drops in a polyproethylene–pro-pylene (PP) matrix. All polymer grade names and suppliers are given in Table I. The matrix polymers (PE-1, PE-2, and PP) were of commercial grades obtained in pellet form. The PS polymers were received in the form of spheres and only those of 0.5– 0.6 mm in diameter were selected. For EPR, spherical particles were pre-pared by heating ground (random shape) particles in silicone oil bath at 150°C. Interfacial tension forced the recovery to an approximately spherical shape within 30 min of heating.
Figure 1(a) shows the complex viscosity, *, at 200°C of the different polymers measured using a Rheometric Scientific ARES rheometer in a plate–plate geometry, as a function of the oscillation frequency. All PS/PE and EPR/PP systems have high viscosity ratio over a wide range of shear rate. PS/PE systems with PE-1 as the matrix have a viscosity ratio varying from 4 (at 100 s⫺1) to around 170 (at 0.01 s⫺1). Those with PE-2 as the matrix have a viscosity ratio varying from 1.7 (at 100 s⫺1) to around 80 at (0.01 s⫺1). Highest viscosity ratios at high shear rates were obtained with EPR/PP systems. Even at shear rates up to 100 s⫺1, EPR/PP systems have viscosity ratio higher than 9.
Figure 1(b) shows the loss tangent (tan ␦ ⫽ G⬙/G⬘) of the different polymers as a function of oscillation frequency. Perfectly viscous polymers have tan ␦ ⫽ ⬁, while elastic solids would have tan ␦ ⫽ 0. The figure shows that the PS and EPR drop materials are more elastic than the corresponding PE and PP matrix ma-terials (i.e., tan ␦ of PS and EPR are higher than those of PE and PP, respectively), especially at low fre-quency. The elasticity of all drop and matrix polymers increases with increasing frequency and at the same time the difference between drop and matrix elasticity becomes smaller. Only the EPR/PP system shows a small increase between drop and matrix elasticity for frequencies higher than 10 rad/s. The interfacial ten-sion coefficient, ⌫, for PS/PE at 220°C is around 5 mN/m11, while that of EPR/PP systems is reported
between 0.5 and 1.0 mN/m depending on ethylene content in EPR.18
Setup and procedure
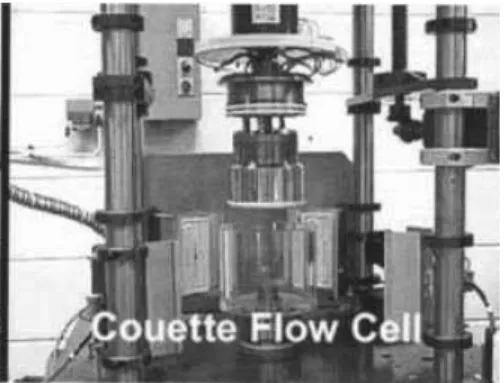
The experimental setup used in this study consists of two counter-rotating concentric cylinders (Fig. 2). The outer transparent cylinder is made of quartz and heated by an infrared heating system, whereas the inner cylinder is made of steel and heated uniformly by means of six cartridge heaters. The outer cylinder has an internal diameter of 117 mm, whereas the inner cylinder has an external diameter of 109 mm. The Couette 4-mm-wide annular gap has a height of 50 mm. More details on the setup are given elsewhere.17
The inner to outer cylinder diameter ratio is 0.93 and the 4 mm gap between the cylinders is considered as a narrow gap, compared to many commercial devices, which employ cylinder diameter ratio down to 0.9. The advantage of this narrow gap is that experiments can be made at high shear rates and without the secondary flow present in parallel plates and cone and plate geometries. Flow stability limit is then increased to high Taylor number.19 The problem of end effects
has also been taken into account in the cell design or during gap filling with polymer. In the bottom of the Couette gap, sealing is achieved with the use of a
lubrified Teflon ring, which rotates with the inner cylinder. This ring occupies half of the gap thickness and is in contact with a shoulder machined in the Quartz outer cylinder. Then, drag problems are min-imized since the bottom of the inner cylinder is not in contact with the matrix polymer and polymer shear-ing is mainly generated by the vertical 50 mm height of cylinder surfaces. To avoid end problems at the upper section of the Couette cell, such as drag on the top end of the inner cylinder, the gap is filled with matrix polymer up to the start of the conical section shown in Figure 2. The amount of polymer-free sur-face is also minimized. At the beginning of each test, the Couette cell was first preheated up to 130 or 160°C for PE or PP matrix phase, respectively. The gap was then filled with pellets of the major phase in which some dried spheres of drop phase were inserted. Small amount of stabilizer (Irganox B-225, from Ciba chem-icals) was also added to avoid material degradation during shearing at high temperature. Polymer drying was done under vacuum at 80°C for 10 h before ex-periments. After filling the gap with polymer, air be-tween the PE or PP pellets and in the rest of the gap chamber was removed using a vacuum pump allow-ing the steel lid to automatically close the chamber. The temperatures of the inner and outer cylinders were then increased to the desired testing tempera-ture, which took around 5 min of heating. During this period, the polymer is sheared at low shear rate (␥˙ ⱕ0.5 s⫺1) for temperature uniformity. For steady-state experiments, an additional thermal stabilization pe-riod of 5 min was used prior to shearing to ensure that thermal homogeneity is reached in both the matrix and drop phases.
All observations presented in this paper were made close to the gap center and the mid-portion of the transparent cell to minimize the wall and end effects. Rotating the inner and outer cylinders in opposite directions kept the droplet positioned in the field of view field of the camera. The average shear rate, ␥˙, was calculated according to the following equations by assuming a power law fluid20:
TABLE 1
List of Polymers Used in this Study
Drop/Matrix Phase
Mw
(kg/mol) Commercial name Supplier
Matrix
PE-1 – DMDA-8920 Petromont, Canada
PE-2 – DMDB-8907 Petromont, Canada
PP – SM-6100 Montell, Canada
Drop
PS-1 210 Scott C-21 Styrochem, Canada
P5–2 240 Scott C-24 Styrochem, Canada
PS-3 310 Scott C-31 Styrochem, Canada
EPR 361 – Mitsubishi Chemicals, Japan
␥˙i⫽
冉
2 nRiRo冊冉
Ri⫺2冉
1⫺n n冊
Ri⫺2/n⫺Ro⫺2/n冊
⍀共t兲 (2) ␥˙o⫽␥˙i冉
Ri Ro冊
2冉
1⫺nn冊
␥˙ ⫽␥˙i⫹␥˙o 2where n is the power-law index in the high frequency range, the subscripts “i” and “o” designate the inner and outer cylinders, respectively; R is the radius of the cylinders; ⍀(t) ⫽ ⍀o(t) ⫺ ⍀i(t) is the relative rate of
rotation of the solid boundaries of the outer and inner cylinders. The average shear rate, ␥˙, was taken as the average value between ␥˙iand ␥˙o␥˙o
冉
␥˙ ⫽␥˙i ⫹ ␥˙o
2
冊
. It is evident from eq. (2) that the difference between theshear rates at the surfaces of the inner and outer cylinders increases with increase in the ratio between the inner and outer cylinder diameters or with increas-ing the departure from Newtonian flow. The values of
n for PE and PP, used in calculating the average shear
rate ␥˙, were 0.8 and 0.3, respectively. They were ob-tained by fitting the viscosity data presented in Figure 1 with Carreau–Yasuda model.21
Experimental results and analysis Steady-state drop deformation under subcritical shearing conditions
We will first present in this section steady-state drop deformations at shear rates below that required for extensive deformation and breakup of the droplets. Different combinations of PS and PE were used to cover a wide range of viscosity ratio. The initial PS drop diameters for all the systems studied was be-tween 0.5– 0.6 mm. For each shear rate, temperature was maintained constant at 195°C and PS drops were sheared for more than 3 min to reach steady state deformation. Typical PS drop images at steady state for the three systems 1/PE-2, 2/PE-2, and PS-3/PE-1 are shown in Figure 3 for different shear rates. These three systems have viscosity ratios, k, at a ref-erence shear rate of 10 s⫺1of 4.4, 5.4, and 17, respec-tively. The images were taken parallel to the shearing direction. The first image for each system shows that PS drops were slightly deformed at low shear rates into a spheroidal shape oriented in the flow direction. This deformation is lower for the highest viscosity ratio PS-3/PE-1 system, as expected. The second im-age for each system shows that further increase in the shear rate induced the PS drop retraction along flow direction and elongation perpendicular to this direc-tion, thus shifting the orientation axis of the drop by 90°. This phenomenon was previously observed with viscoelastic model fluid systems and was related to drop elasticity.17 Since the normal stresses generated
inside the drop during shearing are a function of the square of the shear rate, there has to be a point where they become higher than the shear stresses, which are
only a linear function of shear rate. These normal stresses, which act as an extra-stress along streamlines inside the PS drop cause strangulation of the droplet and force it to orient parallel to the vorticity axis, similarly to the rod climbing effect observed by Bird et al.22The last images for the three systems PS-1/PE-2,
PS-2/PE-2, and PS-3/PE-1 correspond to drop breakup at constant shear rates of 5.5, 8.2, and 13.7 s⫺1, respectively. These images show that PS drops were elongated and broken parallel to the vorticity axis, as already observed for viscoelastic model fluid systems. The critical shear rate required for drop breakup in-creased with the viscosity ratio of the system. Quan-titative results on drop steady state aspect ratio, ᐉ, for two systems of different viscosity ratio, PS-2/PE-1 and PS-2/PE-2 (k at 10 s⫺1⫽ 13.4 and 5.4, respectively) are shown in Figure 4, as a function of the shear rate. The aspect ratio is the ratio of the drop length along the flow direction to its initial diameter. Based on the definition of ᐉ, an aspect ratio smaller than unity means that drop is oriented parallel to vorticity axis. The aspect ratio first increases for the two PS/PE systems at low deformation rates, reaching a maxi-mum value at a given shear rate, specific for each system. At that point, maximum deformation in the flow direction, due to shearing forces, is attained. The maximum drop aspect ratio is smaller for the high viscosity ratio PS-2/PE-1 system. This is an expected result since the viscous shearing forces at low defor-mation rates are the dominant forces. Further shear
Figure 2 Experimental Couette Setup.
Figure 3 Series of images on PS drop deformation at steady state for three PS/PE systems of different viscosity ratio.
rate increase results in a decrease of the aspect ratio, which is more rapid for the low viscosity ratio PS-2/ PE-2 system. For the same shear rate, the shearing stress transferred by PE-2 matrix at PS-2 drop surface is higher than that transferred by the less viscous PE-1 matrix. Higher normal stress is then generated inside the PS-2 matrix leading to higher elongation parallel to vorticiy axis.
To understand this phenomenon, we have chosen the PS-2/PE-1 system and calculated the forces acting on the viscoelastic PS-2 drop at the corresponding specific capillary number of 133, as shown in Figure 5(a). The corresponding shear rate is 6 s⫺1 and the shearing stress transferred by the PE-1 matrix at the drop interface at this shear rate is
⫽ PE⫺1⫻ ␥˙ ⫽ 417 Pa s*6s⫺1 ⬇ 2.5 kPa (3)
With assuming the tangential stress continuity across PS-2/PE-1 interface between the estimated shear rate inside the PS-2 drop is approximately 0.1 s⫺1and the corresponding elastic modulus, G⬘, is 1.3 kPa, as shown in Figure 1(b). At this low shear rate, the first normal stress difference, N1, can be approximated to
the double of G⬘ (i.e., N1 ⫽ 2.6 kPa). As it can be
observed, the shearing stress of 2.5 kPa transferred by PE-1 matrix to the drop surface at the specific capillary number of 133, induced a normal stress inside the drop of the same order of magnitude than the shearing stress itself. This normal stress causes strangulation of the droplet and forces it to orient parallel to the vor-ticity axis. The diamond-like shape of the drop, ob-served during deformation, could be due to this sec-ondary flow along the vorticity axis. The interfacial
tension, which is the driving force for spherical shape recovery was not sufficient to oppose the drop elastic forces. It should be mentioned that this diamond-like shape was not observed for the viscoelastic model fluid systems previously studied.17 In that work, Boger fluid (elastic) drops conserved their curved sur-face for all the shear rates studied but the interfacial tension coefficient for these systems (⌫ ⫽ 15 mN/m) was three times higher than that in the PS/PE systems and the corresponding first normal stress differences,
N1, were at least 17 times less than the N1
approxi-mated values for PS. The latter were approxiapproxi-mated at low shear rates to the double of the storage (elastic) modulus, G⬘.
Drop deformation and breakup
The following section concerns drop deformation and breakup for high viscosity ratio systems. In addition to PS/PE systems, we will investigate the EPR/PP sys-tem. The latter was chosen because it is one of the lowest interfacial tension polymer pair among immis-cible polymer blends and because of its commercial significance as EPR is one of the most widely used impact modifier for polypropylene. The intent was to determine if interfacial tension plays an important role in the dispersion of high viscosity ratio systems.
Molten polymer systems with interfacial tension, PS/PE
To investigate the kinetics of drop deformation and breakup, the PS-2/PE-2 system was sheared at 195°C under time-dependant shearing conditions. Shear rate
was increased continuously from 0.1 up to 16 s⫺1over a period of 550 s. The viscosity ratio of the PS-2/PE-2 system (evaluated at constant stress) decreases from around 22 to 4 for shear rates varying from 0.1 to 16 s⫺1. Figure 5 presents images in increasing shear rate order. Values below each image correspond to the shear rate and the viscosity ratio at the corresponding shearing condition. All images were taken perpendic-ular to the flow/vorticity plan shown at the bottom-left side of the figure. Image 1 shows the initial PS-2 drop slightly deformed at very low shear rate at the beginning of the shearing test. Image 2 shows that, at low shear rates of 5 s⫺1, PS-2 drop was elongated into a spheroid along flow direction. Images 3–5 were
taken at short time intervals at around 8 s⫺1to show the droplet rotation. Under these conditions, the vis-cosity ratio is about 6.3. Although Newtonian drop breakup in Newtonian matrix is not possible under simple shear flow when viscosity ratio higher than 4, as established in the literature, Figure 5 shows that PS drops can still be broken through an erosion of their surface. Clouds of very small ribbons and sheets were developed around the drop and a waist was formed parallel to the flow direction (images 4 and 5). As the shear rate increased, the PS-2 drop elongated slightly perpendicular to the flow direction and became irreg-ular in shape. A high number of small droplets con-tinued to be detached from the elongated mother
Figure 5 Series of drop images showing PS drop deformation and breakup sequence under different shearing conditions.
drop, particularly from the top, as shown in image 6, which corresponds to a shear rate of 9.7 s⫺1. Images 7–12 show elongated structures after approximately 450 s of shearing. The orientation in the vorticity di-rection reduces the particle-projected diameter in the shearing direction, thus decreasing the stresses acting on the dispersed phase to the point where little or no surface erosion can be observed. As the longitudinal deformation continued, a waist was formed along the drop surface and thinned progressively, leading to a series of breakups into two or more discrete cylindri-cal daughter droplets. These daughter droplets showed similar buckling and vertical deformation into cylinders under shear leading to further breakups, thus resulting in a large number of very small cylin-drical droplets, vertically oriented, which eventually became too small for observation.
Recently,23a detailed work on the kinetics of drop
deformation and breakup was done on PC drops dis-persed in PE matrix using the same Couette setup. A series of tests at constant shear rate with stepwise increase of temperature were carried out. Because of the high glass transition of the PC, when compared with the melting point of the PE matrix, it was possible to run tests while the PC is still solid and then decrease the viscosity ratio by increasing the test temperature. Surface erosion was also observed in this system when the viscosity ratio was decreased below 10. Therefore the erosion phenomenon is not limited to PS/PE and can probably apply to a large number of high viscosity ratio polymer systems.
Molten polymer system with low interfacial tension, EPR/PP
The shear rate history used to generate EPR particle deformation and breakup is shown in Figure 6(a). EPR drop was first sheared at 2 s⫺1during 500 s. The shear rate was then gradually increased up to around 38 s⫺1 over a period of 300 s and then rapidly decreased down to around 14 s⫺1 and maintained at this shear rate for an additional 400 s. After this, the shear rate was gradually increased to around 46 s⫺1and rapidly decreased again to the starting shear rate of around 2 s⫺1. The intent of this particular shear history was to visualize the instantaneous and retarded response of the deformed EPR drop to shear variation. Numbers along the shear rate curve refer to the corresponding images shown in Figure 6(b). Image 1 of Figure 6(b) shows that the initial EPR particle was not completely spherical but slightly deformed in the initial low shear flow, since no interfacial tension forces recovery. At this flow condition (␥˙ ⫽ 2 s⫺1), the EPR/PP viscosity ratio is higher than 10, as shown by the viscosity curves in Figure 1(a). Elastic forces generated inside the EPR drop at this shear rate were probably not sufficient to induce drop elongation along the vorticity axis through normal force buildup. When increasing
the shear rate up to around 26 s⫺1, instability was observed near the bottom of the drop, as seen in image 2. Unfortunately, due to experimental difficulties, it was not possible to maintain the drop in the field of view of the camera to track the development of this instability when the shear rate was rapidly decreased from 38 to 14 s⫺1 and maintained at this shear rate during for around 400 s. Image 3 shows the EPR drop shape at the shear rate level 3. The drop was highly elongated parallel to the vorticity axis and had non-uniform shape with some thin threads at the mid-portion of the elongated drop undergoing helicoidally rotation. These thin threads continue to be longer and thinner as long as the shear rate was continuously increased up to 46 s (images 4 and 5) or maintained at this shear rate (images 6 and 7). Images 6 and 7 show that the elongated EPR drop was broken in two inde-pendent smaller droplets that still connected with very thin elastic thread. The sudden decrease of the shear rate from 46 s⫺1to the initial shear rate of 2 s⫺1 was not enough to break the fiber by capillary insta-bility. The two linked portions of the initial drop con-tinued to be separated but the fiber was much more retracted than at high shear rate. The EPR pictures shown here are very similar to those obtained by Mighri and Huneault17 for a PDMS/PDMS system
having a viscosity ratio of 20. EPR in PP system is around three orders of magnitude more viscous than this PDMS system. The viscosity ratio at the visualiza-tion shear rates varies from 8 –13 and the interfacial tension coefficient between EPR and PP is small (0.5– 1.0 mN/m). This suggests that the basic deformation and breakup concepts that have been developed over the years from data on Newtonian systems are not very useful here. For Newtonian systems, drop breakup is the consequence of interfacial instability development on an elongated droplet during or after flow. In the current case, little or no interfacial tension is present but particles can still be broken, even for high viscosity ratio blends. When shear rate was de-creased, or after cessation of flow, no spherical shape recovery was observed, even after a relatively long time because of the low interfacial tension.
Analysis
Most studies have focused on drop deformation and breakup at low shear rates, and in most cases for systems with low to moderate viscosity ratio. Drop deformation and breakup mechanisms in these cases depend generally on shearing forces, interfacial forces, and viscosity ratio. For high viscosity ratio systems subjected to a very strong stress field, drop breakup mechanism is completely different. The erosion mech-anism observed for PS/PE in this study was not re-stricted to one specific system. It was observed for all the systems studied but does not necessarily occur over the whole viscosity ratio. It is interesting to note
that erosion was not observed in our previous work17
with low viscosity model fluid systems in which nor-mal forces were strong. It is believed that viscous stress level in these model fluid systems was not high enough, compared with the cohesive forces, to obtain erosion. However, for the high viscosity ratio PS/PE, and EPR/PP systems studied in this work, stresses at the drop/matrix interface could attain sufficient levels to tear off small domains around the drop surface. Moreover, the shear rate inside the drop is not
uni-form, due to the circulation of the molten polymer inside the drop, and is maximal at the drop/matrix interface. It progressively decreases as one moves from the drop surface to the center of the drop, and hence the viscosity of the surface layer of the drop is lower (shear thinning). This causes the drop to have a high viscosity core and a lower viscosity surface, al-lowing the surface layers to be stripped off. In this light, the relevant issue is not merely the dependence of viscosity ratio on shear rate, but also the absolute
Figure 6 (a) Shear rate history for EPR-1/PP system, and (b) a series of drop images showing EPR-1 drop deformation and breakup sequence.
amount of shear thinning, specifically in drop phase. As shown in Figure 1, the three PS used in this study has a high shear thinning behavior, compared with the PE. When the local stretching stress exceeds the strength of the drop material, these domains brake up by tensile failure and then detached from the rest of the drop into very small droplets finely distributed in the melted matrix. For the particles oriented perpen-dicular to the flow direction, such those observed for PS/PE and EPR/PP systems, the drop splitting can also occurs when the ends of these highly elongated structures get in slightly different velocity planes. At that point, the relative velocity difference between the particle ends forces it to be torn apart.
CONCLUSIONS
In this study, the dispersion in high viscosity ratio melted systems was studied. Particular focus was on the kinetics of drop deformation, orientation, and break-up in PS/PE and EPR/PP systems. In the sys-tems studied, drops can be deformed and broken to the micron-scale even when viscosity ratio is higher than 3.4, the critical value for Newtonian systems. At low shear rates, PS drop deformation occurred in a similar fashion to earlier observations on low viscosity viscoelatic solutions. PS drop deformation increased along flow direction with increasing shear rates up to a maximum deformation and then decreased above a critical shear rate, which depends on PS/PE viscosity ratio. At high shear rates, the most striking non-New-tonian effects were the surface erosion and the drop splitting mechanisms. The erosion of the drop phase occurred by the local stretching of small and thin domains on the surface caused their rupture from the rest of the drop by tensile failure. The drop splitting
occurred after the elongation of the droplet parallel to the vorticity axis because of elastic normal forces gen-erated along streamlines inside the drop. This splitting was related to a rocking motion that brings the end of the fluid fiber in different velocity layers, resulting in its quick tearing apart.
References
1. Taylor, G. I. Proc R Soc London Ser A 1932, 138, 41. 2. Taylor, G. I. Proc R Soc London Ser A 1934, 146, 501. 3. Cox, R. G. J Fluid Mech 1969, 37, 601.
4. Hinch, E. J.; Acrivos, A. J Fluid Mech 1980, 98, 305. 5. Grace, H. P. Chem Eng Commun 1982, 14, 225. 6. Rallison, J. M. Annu Rev Fluid Mech 1984, 16, 45. 7. Mighri, F.; Ajji, A.; Carreau, P. J Rheol 1997, 41, 1183. 8. Mighri, F.; Carreau, P. J.; Ajji, A. J Rheol 1998, 42, 1477. 9. Bartram, E.; Goldsmith, H. L.; Mason, S. G. Rheol Acta 1975, 14,
776.
10. Elmendorp, J. J.; Maalcke, R. J. Polym Eng Sci 1985, 25, 1041. 11. Wu, S. Polym Eng Sci 1987, 27, 335.
12. Milliken, W. J.; Leal, L. G. J Non-Newtonian Fluid Mech 1991, 40, 355.
13. Sundararaj, U.; Dori, Y.; Macosko, C. W. Polymer 1995, 36, 1957. 14. Levitt, L.; Macosko, C. W.; Pearson, S. D. Polym Eng Sci 1996, 36,
1647.
15. Hobbie, E. K.; Migler, K. B. Phys Rev Lett 1999, 82, 5393. 16. Migler, K. B. J Rheol 2000, 44, 277.
17. Mighri, F.; Huneault, M. A. J Rheol 2001, 45, 783.
18. Tsou, A. H.; Lyon, M. K. In ANTEC’2000 Proceedings of the 58th Annual Technical Conference, Orlando, FL, May 7–11, 2000, Vol. XLVI, p 1001. Society of Plastics Engineers, 2000. 19. Macosko, C. W. Rheology: Principles, Measurements, and
Ap-plications; VCH: New York, 1994; p 188.
20. Ferguson, J. F.; Kemblowski, Z. Applied Fluid Rheology; Elsevier Science: New York, 1991; p 94.
21. Yasuda, K.; Armstrong, R. C.; Cohen, C. E. Rheol Acta 1981, 20, 163.
22. Bird, R. B.; Armstrong, R. C.; Hassager, O. Dynamics of Polymer Liquids; Wiley: New York, 1987; Vol. 1, p 63.
23. Lin, B.; Sundararaj, U.; Mighri, F.; Huneault, M. A. Polym Eng Sci 2003, 43, 891.