Publisher’s version / Version de l'éditeur:
BMC Microbiology, 9, 25, 2009-02-02
READ THESE TERMS AND CONDITIONS CAREFULLY BEFORE USING THIS WEBSITE. https://nrc-publications.canada.ca/eng/copyright
Vous avez des questions? Nous pouvons vous aider. Pour communiquer directement avec un auteur, consultez la première page de la revue dans laquelle son article a été publié afin de trouver ses coordonnées. Si vous n’arrivez pas à les repérer, communiquez avec nous à PublicationsArchive-ArchivesPublications@nrc-cnrc.gc.ca.
Questions? Contact the NRC Publications Archive team at
PublicationsArchive-ArchivesPublications@nrc-cnrc.gc.ca. If you wish to email the authors directly, please see the first page of the publication for their contact information.
Archives des publications du CNRC
This publication could be one of several versions: author’s original, accepted manuscript or the publisher’s version. / La version de cette publication peut être l’une des suivantes : la version prépublication de l’auteur, la version acceptée du manuscrit ou la version de l’éditeur.
For the publisher’s version, please access the DOI link below./ Pour consulter la version de l’éditeur, utilisez le lien DOI ci-dessous.
https://doi.org/10.1186/1471-2180-9-25
Access and use of this website and the material on it are subject to the Terms and Conditions set forth at
A Candida albicans early stage biofilm detachment event in rich
medium
Sellam, Adnane; Al-Niemi, Thamir; McInnerney, Kathleen; Brumfield, Susan;
Nantel, André; Suci, Peter A.
https://publications-cnrc.canada.ca/fra/droits
L’accès à ce site Web et l’utilisation de son contenu sont assujettis aux conditions présentées dans le site LISEZ CES CONDITIONS ATTENTIVEMENT AVANT D’UTILISER CE SITE WEB.
NRC Publications Record / Notice d'Archives des publications de CNRC:
https://nrc-publications.canada.ca/eng/view/object/?id=7c6b4ff2-9ec5-413f-a3bc-8a96c8f1a91e https://publications-cnrc.canada.ca/fra/voir/objet/?id=7c6b4ff2-9ec5-413f-a3bc-8a96c8f1a91eOpen Access
Research article
A Candida albicans early stage biofilm detachment event in rich
medium
Adnane Sellam
†1, Thamir Al-Niemi
†2, Kathleen McInnerney
3,
Susan Brumfield
2, Andre Nantel
1and Peter A Suci*
4Address: 1Biotechnology Research Institute, National Research Council of Canada, Montreal, Quebec, Canada, 2Department of Plant Sciences and
Plant Pathology, Montana State University, Bozeman, MT 59717, USA, 3Genomics Core Facility, Department of Microbiology, Montana State
University, Bozeman, MT 59717, USA and 4Department of Microbiology and Center for Biofilm Engineering, Montana State University, Bozeman,
MT 59717, USA
Email: Adnane Sellam - adnane.sellam@cnrc-nrc.gc.ca; Thamir Al-Niemi - thamir@montana.edu;
Kathleen McInnerney - kmcinnerney@montana.edu; Susan Brumfield - uplsb@montana.edu; Andre Nantel - andre.nantel@cnrc-nrc.gc.ca; Peter A Suci* - peter_s@erc.montana.edu
* Corresponding author †Equal contributors
Abstract
Background: Dispersal from Candida albicans biofilms that colonize catheters is implicated as a
primary factor in the link between contaminated catheters and life threatening blood stream infections (BSI). Appropriate in vitro C. albicans biofilm models are needed to probe factors that induce detachment events.
Results: Using a flow through system to culture C. albicans biofilms we characterized a detachment
process which culminates in dissociation of an entire early stage biofilm from a silicone elastomer surface. We analyzed the transcriptome response at time points that bracketed an abrupt transition in which a strong adhesive association with the surface is weakened in the initial stages of the process, and also compared batch and biofilm cultures at relevant time points. K means analysis of the time course array data revealed categories of genes with similar patterns of expression that were associated with adhesion, biofilm formation and glycoprotein biosynthesis. Compared to batch cultures the biofilm showed a pattern of expression of metabolic genes that was similar to the C. albicans response to hypoxia. However, the loss of strong adhesion was not obviously influenced by either the availability of oxygen in the medium or at the silicone elastomer surface. The detachment phenotype of mutant strains in which selected genes were either deleted or overexpressed was characterized. The microarray data indicated that changes associated with the detachment process were complex and, consistent with this assessment, we were unable to demonstrate that transcriptional regulation of any single gene was essential for loss of the strong adhesive association.
Conclusion: The massive dispersal of the early stage biofilm from a biomaterial surface that we
observed is not orchestrated at the level of transcriptional regulation in an obvious manner, or is only regulated at this level by a small subpopulation of cells that mediate adhesion to the surface.
Published: 2 February 2009
BMC Microbiology 2009, 9:25 doi:10.1186/1471-2180-9-25
Received: 8 August 2008 Accepted: 2 February 2009
This article is available from: http://www.biomedcentral.com/1471-2180/9/25 © 2009 Sellam et al; licensee BioMed Central Ltd.
This is an Open Access article distributed under the terms of the Creative Commons Attribution License (http://creativecommons.org/licenses/by/2.0), which permits unrestricted use, distribution, and reproduction in any medium, provided the original work is properly cited.
Background
Members of the Candida genus are the principal etiologi-cal agents of nosocomial fungal infections, with C.
albi-cans being the most common species [1-3]. The overall
mortality rate for patients with candidemia is greater than 40% [4-6]. Catheters are considered to be a likely point of entry of C. albicans into the vascular system [7]. In support of this evaluation, a particularly high risk of invasive can-didiasis is associated with the use of urinary and vascular catheters, and ventricular assist devices [8]. The chances of acquiring a BSI resulting from colonization of an intravas-cular catheter by Candida species has been ranked high among pathogens involved in biomaterial centered infec-tions, second only to Staphylococcus aureus [9]. C. albicans colonizes various biomaterials and readily forms dense, complex biofilms under a variety of in vitro conditions [10]. C. albicans biofilms exhibiting similar architectural and morphological features form in vivo [11-13]. The implication is that dissemination from C. albicans bio-films colonizing biomaterials is frequently a major factor predisposing susceptible patients to life threatening BSI. Despite the evidence that dispersal of cells from C. albicans biofilms may be a critical step in biomaterial related cases of candidemia, few studies have characterized C. albicans biofilm detachment behavior. Daughter cells that are released from C. albicans biofilms cultured on cellulose acetate filters or cellulose fibers perfused with a continu-ous flow of medium have been collected either as a means to assess biofilm growth rate [14], or to determine if dis-persed cells retain the intrinsic (transient) phenotypic resistance to antimicrobials that is a hallmark of biofilms [15]. In the former study there is an implicit (untested) hypothesis that the detachment rate is constrained by the medium substrate loading rate, and not simply a direct (passive) response to the applied (mechanical) shear force. Expression of a GPI (glycosylphosphaditylinositol) anchored cell wall protein (Ywp1p) has been shown to decrease adhesion between biofilms composed of yeast forms and a polystyrene surface [16]. The implication is that Ywp1p may be the effective structural component in an active control network that induces biofilm detach-ment. A recent review has discussed cell dispersal from C.
albicans biofilms with respect to its possible induction by
farnesol, a quorum sensing agent that promotes forma-tion of the yeast form [17]. C. albicans biofilms formed from mutants in which genes coding for key adhesins under the positive control of the Bcr1p transcription fac-tor have been disrupted produce thin fragile biofilms [11,18]. Detachment of cells from biofilms formed from these mutant strains is significantly enhanced [19]. Evidence is accumulating that bacterial biofilms actively regulate dispersion processes using a variety of mecha-nisms [20-28]. The aim of the present study was to
deter-mine if we could find evidence indicating that C. albicans biofilm detachment from a biomaterial surface was actively regulated at the level of transcription. A clearly observable, reproducible transition between establish-ment of strong adhesion and loss of adhesion in a rela-tively copious early stage biofilm provided us with a simple tractable in vitro system for probing changes in the transcriptome associated with loss of adhesive bonds to a biomaterial. Since the phenomenon involved the entire biofilm population we could apply a relatively simple scheme for array analysis which consisted of a closed loop time course comparison. A comparison of biofilm and batch cultures provided us with an additional way to screen for genes that were specifically involved in the detachment process.
Results
The detachment process involves an early abrupt loss of strong adhesion
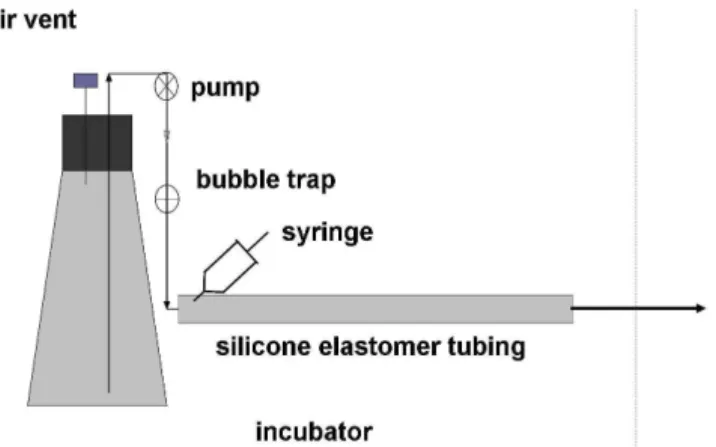
Biofilms were cultured in a tubular reactor similar to that used in a previous study [29] (Figure 1). Figure 2a shows stages of biofilm detachment that are evident from visual inspection of the silicone elastomer tubing in which the biofilms were cultured. Regions where the biofilm has been displaced from the tubing become visible by 2 h and continue to enlarge during the course of development. These regions of detachment are evident along the entire length of the tubing. Biofilms cultured for 6 h appear to have only minimal points of contact with the silicone elastomer. Typically, this tenuous association is com-pletely lost between 8 and 9 h, at which point the entire biofilm is displaced downstream by the flow.
As in other C. albicans biofilm studies [11,30-33], our inoculum was produced at 30°C in order to obtain a well defined dispersed population consisting entirely of yeast singlets and doublets, with no cell aggregates. This rela-tively large inoculum settles to the lower surface of the tubing during the 1 h incubation period. These cells, which still have the yeast morphology after the 1 h incu-bation period, are completely removed if the tubing is drained, leaving the lower tubing surface completely free of cells (data not shown). Contrary to our initial expecta-tion, when medium flow is initiated, most cells remain associated with the surface. We found less than 105 cells/ ml in aliquots collected immediately after initiation of flow until just before loss of the entire biofilm (five exper-iments). Cells that remain associated with the surface ger-minate and the biomass increases primarily by hyphal extension rather than increase in cell number (Figure 2c). (A batch culture in which the conditions of the inocula-tion are the same behaves similarly in this respect). Bio-films grown for 1 h have developed a multilayer, multicellular structure that remains associated with the tubing after it is subjected to the large shear forces exerted
at the interface by draining the tubing (Figs 2d and 2e), indicating that as cells germinate they rapidly develop rel-atively strong cell to cell (cohesive) and cell to surface (adhesive) bonds.
The relatively strong adhesive association with the surface that is established by 1 h is weakened considerably before visible regions of the biofilm lift off the tubing and this is accompanied by a change in biofilm morphology. The early time course of this loss of adhesion was followed using cryosectioning, scanning electron microscopy (SEM) and time lapse photography (Figure 3). Cryosec-tions of the biofilm indicated that there was a fairly abrupt transition in the structural organization of regions of the biofilm (particularly regions near the biofilm lateral edges) consisting of the appearance of hyphae extending into the surrounding medium between 60 and 90 min (Figure 3a). Characterization of the surface using SEM showed that the abrupt structural transition was coinci-dent with the loss of adhesion to the surface (Figure 3b). At 30 and 60 min a multilayer biofilm remained after draining the tubing while at later time points (90 and 120 min) most of the cells were displaced by draining. No cells could be found on the lower (previously colonized) sur-face after draining tubing containing a 3 h biofilm (data not shown). Time lapse photography of the top of the bio-film during the transition indicated that macroscopic detachment was first visible at the edges of the biofilm as wavy flaps (Figure 3c). At later times wrinkles appeared in the biofilm that, when viewed from the side, were evi-dently locations at which portions of the biofilm had been entirely displaced from the surface.
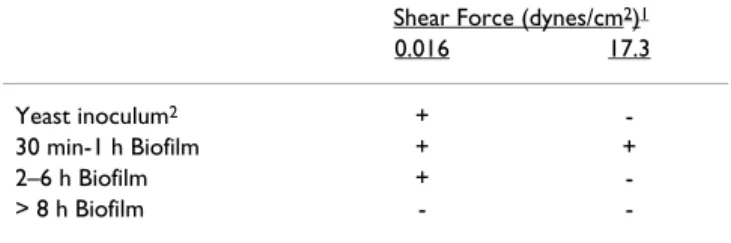
The structural reorganization observed at the 90 and 120 min time points becomes more pronounced as the bio-film develops. Sections of 3 h biobio-films were obtained transverse to the direction of flow (in the plane of the tub-ing cross-section) (Figure 4). The structure of the sections prepared using the Spurr's embedding method (Figure 4a) appeared quite similar to those prepared using cryosec-tioning, a histological technique that was designed to pre-serve the hydrated structure (Figure 4b). Both sectioning techniques indicated a structure in which hyphae extended from both sides of the detached biofilm into the surrounding medium. Despite their relative immaturity, the 3 h biofilms showed evidence of production of extra-cellular polymeric substance (EPS) as indicated by stain-ing with a monoclonal antibody against (1,3) β glucan (Figure 4c and 4d). A previous study indicated that (1,3) β glucan is a primary component of C. albicans EPS [34] Table 1 summarizes the hydrodynamic (shear) forces associated with displacement of the biofilm from the tub-ing at various stages of growth. (The approximate dimen-sions of the 3 h biofilm with respect to the tubing were indicated in Figure 2b). The yeast inoculum was not rinsed from the surface by the relatively low shear force (0.016 dyn cm-1) of the medium flow which is an indica-tion that this hydrodynamic force is quite gentle. How-ever, it was completely displaced from the surface by draining the tubing (data not shown). In contrast biofilms cultured for between 30 min and 1 h have established a sufficiently firm adhesion so that the biofilm can with-stand application of a substantial shear force (17.3 dynes/ cm2).
Initial biofilm adhesion is dependent on expression of BCR1 and ALS3 but not on HWP1
A simple hypothesis is that the loss of adhesion described above involves a temporal shift in expression of two adhesins (ALS3 and HWP1), regulated by the BCR1 tran-scription factor, that were shown play a prominent role in
C. albicans biofilm development [11,19,35]. In order to
pursue this idea we first determined if these genes were involved in establishment of the initial strong adhesive bond to the surface. Figure 5 shows that at 40 min the ref-erence (wild type) strain has established adhesion to the tubing surface while the bcr1/bcr1 and als3/als3 mutant biofilms are almost completely displaced from the surface by draining the tubing. BCR1 is a positive regulator of morphogenesis. However, the lack of establishment of adhesion of bcr1/bcr1 and als3/als3 strains was not entirely coupled to filamentation in a simple manner since a sub-stantial proportion of the bcr1/bcr1 and als3/als3 mutant cells germinated (20 and 70%) during the 40 min time interval. (The mean germ tube length of these cells was 14 +/- 12 and 10 +/- 7 μm, respectively). The results for the
hwp1/hwp1 mutant indicated that expression of this gene
Biofilm tubular reactor Figure 1
Biofilm tubular reactor. The reactor was inoculated by
drawing a cell suspension into the tube from the effluent end (arrow) using a sterile syringe inserted through the tubing wall just down stream from the bubble trap. The bubble trap also serves as a sterility barrier. The entire system was enclosed in an incubator for temperature control (broken line).
Biofilm detachment process Figure 2
Biofilm detachment process. a) Images of the biofilm in the tubing (side view) at various time points; regions where the
biofilm has been displaced from the lower surface are indicated by arrows; a similar pattern of detachment was observed in more than 100 experiments; the scale bar is 2 mm; b) Approximate dimensions of the 3 h biofilm with respect to the tubing cross section; c) Changes in germ tube and cell density versus time; Legend: B, biofilm, P, planktonic (batch) culture; (By 1 h 82% and 76% of the cells geminated in biofilm and planktonic cultures, respectively);d) The multilayer biofilm that remains on the surface after draining at times up until 1 h extends along the trough of the tubing and is visible; (Representative digital cam-era image of the underside of the tubing); e) SEM images of the 1 h biofilm that remains on the lower surface of the tubing after draining.
Time course of loss of adhesion and accompanying microscopic and macroscopic structural changes Figure 3
Time course of loss of adhesion and accompanying microscopic and macroscopic structural changes. a)
Cryo-sections of biofilms at different time points. Sections acquired at 30 and 60 min appear to conform to the curved surface of the tubing. Arrows indicate substratum side. The structure in which hyphae at the edges extend into the surrounding medium becomes apparent between 60 and 90 min. (Scale bars are all 50 μm). b) SEM images of the colonized (lower) surface of the tubing after the tubing was drained. Between 60 and 90 min there is a sharp transition in which most of the cells have lost their surface adhesion. (Scale bars are all 20 μm). c) Time course of gross structural changes during loss of adhesion. The biofilm is visible at 40 min. At 90 min the flanking sections detach as flaps (arrow); these flaps are more visible at later time points. At 135 min wrinkles begin to form (arrow) and become more prominent at later time points (185 min).
was not essential for establishment of firm adhesion, i.e., under our conditions and at this early stage in biofilm development. At 40 min the biofilm was multilayered and clearly attached. These results led us to characterize the detachment phenotype of a strain that overexpressed
ALS3 which is described below.
Comparison of the firmly and loosely attached biofilm suggests that glycosylation, vesicle trafficking and transport contribute to the adhesive phenotype
As shown in Figure (2d and 2e) a visible multilayered bio-film structure withstands the substantial shear force
applied by draining the tubing for biofilms cultured for 1 h. A portion of the 1 h biofilms is typically removed from the surface by this procedure. These two subpopulations are referred to as the 1 h firmly (1h F) and 1 h loosely (1h L) attached biofilm. We reasoned that comparing the tran-scriptional profiles of these two subpopulations might uncover genes that were subsequently differentially regu-lated to mediate detachment in our flow model. The com-parison of 1h F and 1h L biofilms revealed 22 upregulated and 3 repressed transcripts (see Additional file 1). Upreg-ulated genes fell into process ontological categories of vesicular trafficking, glycosylation and transport.
RT-Detached biofilm structure (3 h biofilms) Figure 4
Detached biofilm structure (3 h biofilms). All images were acquired using epi-fluorescence microscopy. a) Spurr's
embed-ded section; the fluorescence originates from the preparation technique; b) Cryosection stained with calcofluor white; c, d) Cryosections stained for (1,3) β glucan; c) Region at the edge of the biofilm; arrow indicates extracellular material that is stained; inset is the planktonic positive control (left: transmitted image right: epi-fluorescence image); d) region in the interior of the biofilm; arrows indicate stained material that appears as strands.
qPCR confirmed the changes in transcript levels of some genes enriched in glycosylation and vesicle trafficking functions that exhibited relatively small fold changes (Table 2). The distinct pattern of expression of these genes within the context of the time course analysis is discussed in the next section.
Time course analysis indicates detachment is associated with coordinated expression of mutually exclusive functional categories
In order to identify changes in the transcriptome that accompanied the abrupt detachment event we performed a closed loop time course analysis (Figure 6a). In such a comparison, each sample is compared to two or more other conditions thus allowing us to visually validate the changes in transcript abundance. We compared the tran-scriptome of 1h F and 1h L biofilms with biofilms that had spontaneously and progressively lost their adhesive bonds (3 and 6 h). The time course array analysis pro-duced 148 predicted ORFs that were differentially regu-lated (>= 1.5 fold change, P-value < 0.05) for at least one pair wise comparison (Figure 6b). (The complete list of genes that are significantly modulated in each comparison is presented in Additional file 1). Of the 148 differentially regulated genes, 98 have a known inferred function. There were also 34 genes that were significantly up or down reg-ulated in more than one pair wise condition (see Addi-tional file 1). Comparison with two previous studies [36,37] in which cells were transferred from 30°C to 37°C
Table 1: Hydrodynamics of biofilm displacement from the surface
Shear Force (dynes/cm2)1
0.016 17.3
Yeast inoculum2 +
-30 min-1 h Biofilm + +
2–6 h Biofilm +
-> 8 h Biofilm -
-1Computed as indicated in the Methods section 2 At the end of the 1 h inoculation period
+ biofilm remains attached - biofilm is removed
Influence of deletion of HWP1, BCR1 and ALS3 and on establishment of early firm adhesion Figure 5
Influence of deletion of HWP1, BCR1 and ALS3 and on establishment of early firm adhesion. Biofilms formed from
the strains indicated at the top of each column were harvested at 40 min and the tubing was drained. The top row are pictures of the underside of the tubing. Visible biofilm remained after draining the tubing for the reference strain (DAY286) and the
hwp1/hwp1 mutant, while no visible biofilm remained for the bcr1/bcr1 mutant. There was some residual biofilm left after
drain-ing the tubdrain-ing colonized by the als3/als3 mutant (before the ethanol rinse steps), but the adhesion to the surface was clearly much less than the reference strain. SEM images of the tubing in the second row indicated that multilayer biofilm remained on the surface of the tubing for the reference strain and the hpw1/hpw1 mutant, while very few cells could be found for the bcr1/
bcr1 and als3/als3 mutants. The most heavily colonized regions that were found are shown. (The ethanol dehydration removed
in YPD medium indicated that differentially regulated genes in the time course were not associated with this tem-perature shift.
K means analysis produced the most meaningful patterns in the time course array data (Figure 7). Since expression levels of all 148 genes for all conditions were included in this analysis, an implicit assumption in the interpretation is that differences in gene expression levels detected between 6 and 1 h and 6 and 3 h are a temporal extension of the differential expression pattern exhibited between 3 and 1 h. The hierarchical cluster analysis presented in Fig-ure 6 provides some support for this assumption since it indicates that differences in expression levels between 1 to 3 h and 1 and 6 h are relatively closely related. The outly-ing location of the 1hL/1hF condition can be interpreted as indicating that differential transcript expression between these two groups should be treated as a separate category. In support of this interpretation we were unable to correlate genes differentially regulated during the time course analysis to genes identified in the comparison of the 1 h firmly (1h F) and 1 h loosely (1h L) attached bio-films. The proximity of the 6 h/1hF and 6 h/1hL condi-tions indicates it is valid to regard these two categories as reflecting similar temporal trends in differential expres-sion.
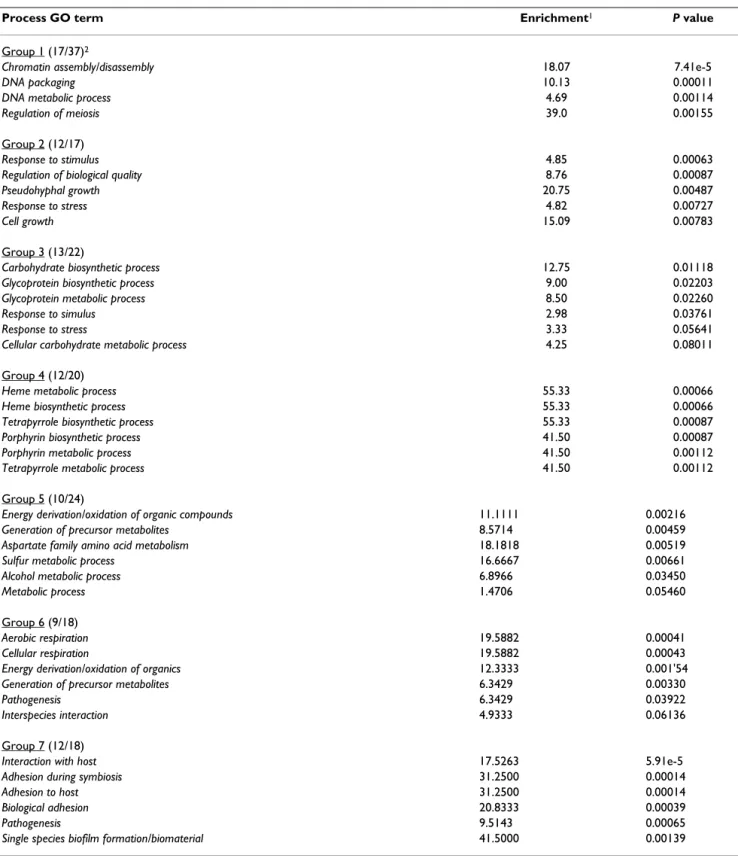
The seven groups of genes identified by K means analysis fell into distinct GO process categories summarized in
Table 3, which shows the four or five most significant cat-egories according to the P value. With a few exceptions, the GO process category assignments for each group were mutually exclusive which suggests that the patterns uncovered by the K means analysis were functionally meaningful. Categories related to carbohydrate biosyn-thetic processes (group 3) and interaction with the host, adhesion during symbiosis and adhesion to the host (group 7) have the most obvious possible functional rele-vance to the detachment phenomenon.
Comparison with batch cultures indicates differential regulation of genes associated with a response to hypoxia, amino acid biosynthesis and cell surface proteins
If inoculation conditions are made as identical as possi-ble, batch cultures are similar to the biofilm in terms of both cell morphology (Figure 2c) and aggregation behav-ior (Figure 8). Since cells in the batch cultures germinate and also exhibit cohesive (cell to cell) interactions we rea-soned that genes differentially regulated in the biofilm to batch comparison and the time course analysis might con-tain a subset of genes involved more specifically in the detachment process, rather than exclusively in morpho-genesis or cell to cell cohesion. It is conventional to com-pare biofilm and planktonic cultures in microarray analyses, where the planktonic culture(s) serves as a sort of reference [30,33,38]. We compared 1 h and 3 h biofilm and batch cultures to each other since these time points bracketed the abrupt transition in which strong adhesion was lost. We used the 1h F biofilm for this comparison since we were attempting to uncover genes involved in mediating adhesive interactions.
The categories of genes that were differentially regulated between the biofilm and batch cultures are summarized in Table 4. (The complete list of differentially regulated genes is given in Additional file 2). In general, genes cod-ing for proteins involved in glycolysis, fermentation and ergosterol synthesis were upregulated while genes associ-ated with oxidative phosphorylation and the TCA cycle were downregulated. This pattern of differential gene expression is very similar to that observed in comparisons of batch cultures grown under aerobic and relatively anaerobic conditions [39] and indicates that biofilm cells were responding to hypoxia (Figure 9). The batch compar-ison data were ordered with respect to the ratio of the fold changes at the 3 h and 1 h time points. There were 16 genes for which this ratio was greater than 1.5 or less than 0.66 and also appeared in the list of significantly regulated genes in the time course analysis. The 11 genes for which the ratio (3 h/1 h) was greater than 1.5 exhibited a pattern of expression that was fairly tightly clustered, similar to the group 4 pattern found by K means analysis (data not shown). Among these 11 genes were four which coded for proteins involved in response to stress: ASR1, CDR4, orf19.822 and AMS1.
Table 2: Genes up regulated in the 1hF/1hL comparison
Gene Orf Microarray1 RT Q-PCR2
Vesicular trafficking SSS1 orf19.6828.1 1.56 1.63 ± 0.01 ERV29 orf19.4579 1.60 3.73 ± 0.41 SEC22 orf19.479.2 1.44 2.24 ± 0.1 EMP24 orf19.6293 1.44 1.24 ± 0.1 CHS7 orf19.2444 1.44 1.65 ± 0.12 YOP1 orf19.2168.3 1.55 1.67 ± 0.15 Glycosylation PMT4 orf19.4109 1.63 ND3 DPM2 orf19.1203.1 1.61 2.33 ± 0.11 DPM3 orf19.4600.1 1.48 2.12 ± 0.2 WBP1 orf19.2298 1.44 4.75 ± 0.11 Transport ADP1 orf19.459 1.68 ND CTR1 orf19.3646 1.54 ND ADY2 orf19.1224 1.69 ND TNA1 orf19.2397 1.68 ND ALP1 orf19.2337 1.58 ND
1Average fold change 2Log
2 ratios. Each value is the mean ± standard deviation of two
independent experiments each with three replicates.
Time course analysis on DNA microarrays Figure 6
Time course analysis on DNA microarrays. A) Closed
loop scheme. B) Heat map and two-dimensional hierarchical clustering of the different transcriptional profiles. Upregu-lated and downreguUpregu-lated genes are colored in red or green respectively.
Categories of genes with similar expression patterns identi-fied by K means analysis
Figure 7
Categories of genes with similar expression patterns identified by K means analysis. The seven groups of
genes fall into distinct ontological process categories summa-rized in Table 3. Patterns of expression of genes chosen for further analysis (groups 3, 4 and 7) are indicated.
Table 3: Ontological categories associated with groups of genes identified by K means analysis of the time course array data
Process GO term Enrichment1 P value
Group 1 (17/37)2
Chromatin assembly/disassembly 18.07 7.41e-5
DNA packaging 10.13 0.00011
DNA metabolic process 4.69 0.00114
Regulation of meiosis 39.0 0.00155
Group 2 (12/17)
Response to stimulus 4.85 0.00063
Regulation of biological quality 8.76 0.00087
Pseudohyphal growth 20.75 0.00487
Response to stress 4.82 0.00727
Cell growth 15.09 0.00783
Group 3 (13/22)
Carbohydrate biosynthetic process 12.75 0.01118
Glycoprotein biosynthetic process 9.00 0.02203
Glycoprotein metabolic process 8.50 0.02260
Response to simulus 2.98 0.03761
Response to stress 3.33 0.05641
Cellular carbohydrate metabolic process 4.25 0.08011 Group 4 (12/20)
Heme metabolic process 55.33 0.00066
Heme biosynthetic process 55.33 0.00066
Tetrapyrrole biosynthetic process 55.33 0.00087
Porphyrin biosynthetic process 41.50 0.00087
Porphyrin metabolic process 41.50 0.00112
Tetrapyrrole metabolic process 41.50 0.00112 Group 5 (10/24)
Energy derivation/oxidation of organic compounds 11.1111 0.00216
Generation of precursor metabolites 8.5714 0.00459
Aspartate family amino acid metabolism 18.1818 0.00519
Sulfur metabolic process 16.6667 0.00661
Alcohol metabolic process 6.8966 0.03450
Metabolic process 1.4706 0.05460
Group 6 (9/18)
Aerobic respiration 19.5882 0.00041
Cellular respiration 19.5882 0.00043
Energy derivation/oxidation of organics 12.3333 0.001'54
Generation of precursor metabolites 6.3429 0.00330
Pathogenesis 6.3429 0.03922
Interspecies interaction 4.9333 0.06136
Group 7 (12/18)
Interaction with host 17.5263 5.91e-5
Adhesion during symbiosis 31.2500 0.00014
Adhesion to host 31.2500 0.00014
Biological adhesion 20.8333 0.00039
Pathogenesis 9.5143 0.00065
Single species biofilm formation/biomaterial 41.5000 0.00139
1 Ratio of the abundance in the differentially regulated gene set to the abundance in the set of genes contained in the gene ontology data base 2 Total number of classified genes/total number of genes in the group
Loss of strong adhesion is not influenced by oxygen availability at the interface or in the medium
The porous structure of silicone elastomers results in a high gas permeability [40]. (Silicone elastomer is 25 times as permeable to oxygen as natural rubber). Thus it is likely that oxygen penetration at the tubing surface might estab-lish a gradient of oxygen at the biofilm/surface interface.
The timing of the structural transition in which hyphae extending from the edges of the biofilm were first observed corresponds with the loss of adhesion (Figure 3) suggesting that the two phenomena might be related. We tested the hypothesis that availability of oxygen at the biofilm/surface interface was providing a stimulus to
Cell aggregate formation in batch cultures; we did not observe alignment of germ tubes extending into the surrounding medium at the edge of any of the cell aggregates
Figure 8
Cell aggregate formation in batch cultures; we did not observe alignment of germ tubes extending into the surrounding medium at the edge of any of the cell aggregates.
induce detachment by placing a gas tight glass sleeve around the biofilm reactor and filling the sleeve with nitrogen gas. Nitrogen was induced after 40 min of growth to allow time for the biofilm to establish firm adhesion to the surface. The presence of the nitrogen had a measurable effect on hyphal length which was reduced by 62% com-pared to the standard conditions (29 μm versus 47 μm, p value 1.4 e-6). However, there was no visible difference in the detachment phenotype at 3 h. We performed addi-tional experiments to see if we could perturb the detach-ment phenotype by availability of oxygen by either filling the glass sleeve with pure oxygen or saturating the medium with pure oxygen during biofilm development. Although there were subtle perturbations in the biofilm structure (data not shown) the detachment phenotype was not appreciably altered.
Mutant strain analysis suggests that transcriptional regulation of a single gene candidate is not responsible for mediating the loss of strong adhesion
Based on the array analysis presented above we chose seven genes (AMS1, PSA2, CWH8, PGA13, orf19.822,
AQY1, and ALS1) for further analysis. (A cwh8/cwh8
mutant could not be produced since it formed a trisomic suggesting that it is a lethal mutation). In addition to genes indicated by our array analysis, we chose two genes for further study based on their possible function in the detachment process as suggested by previous work (YWP1 and MKC1) [16,41]. We also constructed a strain express-ing ALS3 constitutively under the control of the ACT1 pro-moter based on its role in establishment of the initial firm adhesion of 1 h biofilms (ALS3 also exhibited down expression in the time course analysis that was just below the 1.5 fold change threshold).
The detachment phenotype of nine mutant strains was characterized using visual inspection (recorded with a dig-ital camera), cryosections of 3 h biofilms, and SEM of the surface after draining the tubing. With slight variations, all the mutant strains exhibited detachment phenotypes that were quite similar. Figure 10 presents a panel of results for six of the strains tested. In the top row are mutants exhib-iting detachment phenotypes that we consider essentially identical. The detachment phenotypes of the aqy1/aqy1 and ywp1/ywp1mutants and the orf19.822 double knock-out were very similar to those shown in the top row. The
Table 4: Summary of differentially regulated genes in the biofilm-batch comparison
Process GO Term Genes on microarray dataset Annotated Genes1 P value
1h-biofilm 3h-biofilm 1h-biofilm 3h-biofilm
Up regulated genes 130 127
Lipid metabolism 21 18
Ergosterol biosynthesis 11 9 28 1.82 E-10 6.67 E-08
Fatty acid metabolism 3 4 74 0.2 0.1
Other lipid metabolism 7 5 - -
-Glycolysis 13 7 16 5.74 E-18 1.75 E-07
Fermentation 3 2 16 0.01 0.07
Amino acid biosynthesis 11 5 205
Glutamate 5 1 13 2.37 E-05 0.27
Leucine 2 0 5 8.21 E-03
-Other 4 4 - -
-Transport 12 4
Glucose transport 5 0 21 3 E-04
-Oligopeptide transport 3 0 11 3 E-03
-Other 4 4 - -
-Cell wall 8 8 92 4.5 E-03 7.7 E-03
Protein refolding 0 5 14 - 9 E-05
Down regulated genes 71 95
Translation (cytosolic ribosome) 11 33 105
Large subunit 8 18 50 9.08 E-05 8.1 E-15
Small subunit 3 15 39 0.08 4.68 E-13
Tricarboxylic acid cycle 6 2 20 1.75 E-05 0.11
Amino acid biosynthesis 3 13
Glutamate 0 4 13 - 6.2 E-04
Leucine 0 2 5 9 E-03
Other 3 7 - -
-ATP synthesis 6 9 20 1.75 E-05 4.9 E-09
Respiratory chain 8 11 26 5.36 E-07 2.02 E-10
Stress response 4 5 - -
macroscopic appearance of the psa2/psa2 mutant was sim-ilar to the reference strain but the biofilm was too fragile to withstand the application of the OCT polymer to the surface so cryosections could not be obtained. In the bot-tom row are detachment phenotypes that exhibited slight variations. Cryosections of the pga13/pga13 mutant did not produce hyphae that were clearly aligned at both edges of the biofilm. We tentatively attribute this to dis-ruption of the structure during application of the OCT polymer since this biofilm had the appearance of being more fragile than that of the reference strain. In contrast, the mkc1/mkc1 mutant produced a biofilm in which align-ment of hyphae appeared to be more pronounced than in the reference strain. (The detachment phenotype of the CAI4 reference strain was the same as the BWP1 reference strain). The detachment phenotype of ACT1-ALS3 biofilm was the only one that differed appreciably from the refer-ence strain in terms of macroscopic appearance. Com-pared to the reference strain this mutant exhibited fewer regions of detachment that were relatively more displaced from the surface.
Discussion
Although circumstantial evidence strongly implicates that detachment from C. albicans biofilms plays a significant role in biomaterials centered infections, there is virtually nothing known about which types of detachment events might play a role, which conditions induce detachment, or the characteristics of the biofilms responsible for the dissemination. Our biofilm model is most relevant to detachment events that might occur from vascular cathe-ters which commonly transport a relatively rich nutrient broth (total parenteral nutrition) and are statistically among the most likely prosthetic devices to be associated with C. albicans BSI [8]. A comparison with previous results suggests that at this early stage the biofilm is at a critical stage where it can either loose its adhesive associa-tion with the silicone tubing or develop into a mature bio-film [29]. In order to have a tractable in vitro biobio-film model we used an inoculum density that is higher than that expected under any conceivable hospital conditions. However, it is quite plausible that microcolonies that develop from a much smaller inoculum might respond similarly to a constant supply of rich medium and undergo a similar process of global detachment very early in their development. It is also reasonable to expect that the primary colonizers would have previously experi-enced a lower temperature environment such as the skin or a hospital room.
From a medical point of view, we would like to know the interplay of factors (extrinsic and intrinsic) that trigger dif-ferent types of detachment events. The perception of bio-films as structured [10] differentiated [17] communities that may exhibit developmental stages that are actively
Common differentially regulated genes in 1 h and 3 h biofilm to batch comparison and C. albicans cells growing under hypoxic condition
Figure 9
Common differentially regulated genes in 1 h and 3 h biofilm to batch comparison and C. albicans cells growing under hypoxic condition.
programmed [42] suggests that explicit intrinsic (regula-tory) components might play a role. Two time course studies have provided a foundation for discovering points of active regulation of C. albicans biofilm developmental processes at the transcriptional level. Significant changes in the transcriptome accompany both the establishment of initial association with the surface [33] and precede the stage of pronounced increase in biomass [38]. This study is the first to address transcriptome changes that accom-pany a clearly observable biofilm detachment process. We have found that a transition in which a firm attachment to the surface is abruptly lost are coincident with changes in the transcriptome, and we have identified genes that are reasonable candidates for playing a role in this detach-ment. Furthermore, a subset of the genes that were differ-entially regulated during the transition is not associated with either hyphal extension, the most obvious morpho-logical change at the cellular level, or cell aggregation. The microarray data indicated that changes associated with the detachment process were complex and, even after using the array data as a guide for mutant strain construction, we were unable to demonstrate that transcriptional regu-lation of any single gene was essential for loss of strong adhesion.
The most direct evidence that biofilm developmental processes are actively controlled by biofilm-specific tran-scriptional regulatory networks has come from studies of
BCR1 dependent genes [11]. Bcr1p, a zinc finger domain
transcription factor under the positive control of Tec1p, a positive regulator of morphogenesis, activates a set of genes (ALS1, ALS3 and HWP1) that code for GPI anchored cell surface proteins that are required for normal biofilm formation. Of these, ALS3 and HWP1 appear to play the most prominent role in biofilm development [11,19,35], and evidence suggests that their differential expression could play a role in mediating detachment events [19]. We found that BCR1 was necessary for estab-lishment of adhesion of the C. albicans biofilm to the sili-cone elastomer surface and that ALS3 was necessary for establishment of firm adhesion, while HWP1 was not required. Although there was a slight trend of decreased expression of TEC1 in the time course analysis, there was no indication that BCR1 was differentially regulated dur-ing detachment and overexpression of ALS3 had only a modest effect on the detachment phenotype.
The time course analysis indicated that the detachment process coincided with differential regulation of a relative abundance of genes coding for plasma membrane pro-teins, cell surface proteins and cell wall propro-teins, with a modest enrichment in these categories (data not shown). These genes were scrutinized more closely for clues that would indicate changes in cell surface properties related to detachment. Genes involved in transport (ALP1, TNA1,
Detachment phenotypes of selected mutants Figure 10
Detachment phenotypes of selected mutants. All data
presented are for 3 h biofilms. The top row of panels in each set are digital camera images (top view, first row; side view, second row). The third row in each set are cryosections and the forth row are SEM images of the surface after draining the tubing. SEM images show the most densely colonized regions of the surface that could be found. The biofilm formed from the pga13/pga13 mutant was relatively fragile and this may have contributed to the altered structure of the cryosections. In terms of gross structure the most pro-nounced differences were seen in the ACT1-ALS3 construct which exhibited fewer regions of detachment that were rela-tively more displaced from the surface.
CTR1, GNP1, HGT1, HGT15, and DUR7) were highly
rep-resented indicating a shift in metabolism. There was no clear trend indicating that these transcripts were generally either increased or decreased during the time course. There was a general decrease in transcripts for genes involved in hyphal penetration (RAC1, PLB1) which is suggestive of a response to reject surface association. It would be reasonable to expect that induction of release from the surface would involve cell wall restructuring and two genes (SCW11, XYL2) are related to this function. Patterns of gene expression uncovered by K means analy-sis indicated that genes involved in similar biological processes were regulated together which provides some support for the hypothesis that the detachment process was associated with some form of coordinated transcrip-tional regulation. Genes involved in DNA packaging (HTB1, HTA1, HHF22, HHT2, and NHP6a) and host interaction (RAS1, SAP5, ALS1, and TEC1) were generally down regulated (groups 1 and 7, respectively), while genes involved in carbohydrate/glycoprotein (CWH8,
PSA2, and TPS3) biosynthetic processes and energy
deri-vation/generation of precursor metabolites (TPS2, MRF1, and ADH5) were generally up regulated (groups 3 and 5, respectively). Among group 1 there were a number of genes coding for histones that were found to be differen-tially regulated by the quorum sensing agents farnesol or tyrosol (HTA1, HHT2, and NHP6a), both of which have been shown to influence biofilm development [43,44]. There are a substantial number of genes whose expression levels have been shown previously to influence C. albicans biofilm formation. The BCR1 dependent genes were dis-cussed above. The one gene (YWP1) specifically linked to
C. albicans biofilm detachment [16] was notably absent
from the list of differential regulated genes in the time course analysis. This was not entirely unexpected since
YWP1 is expressed primarily in the yeast form. Another
gene that was notably absent from the list was EAP1. The
EAP1 gene has been shown to be required for strong
adhe-sion to polystyrene, which is similar to silicone elastomer in that it is relatively hydrophobic [45]. PRP22, a gene found to be upregulated upon binding of hyphae to poly-styrene [46], showed a trend of downregulation in our time course study. PRP22 is an RNA dependent ATP-ase, and thus probably involved in general metabolism so we did not consider this as a candidate for functional analy-sis.
A reasonable hypothesis is that detachment from a sili-cone elastomer surface is induced by a change in cell sur-face hydrophobicity (CSH). C. albicans has a variety of options for binding to host cells via specific interactions, while CSH provides a less specific means of binding to both host tissues and biomaterial surfaces [47].
Presuma-bly cell to cell cohesion within a biofilm could be main-tained by a subset of the more specific interactions, while loss of CSH would weaken adhesion to the hydrophobic silicone elastomer surface. Genes implicated in determin-ing CSH include CSH1 [48,49], MNN4 [50] and three genes that contain an eight cysteine domain that shows similarity to a class of fungal hydrophobins (CSA1,
PGA10 and RBT5) [32]. CSH1 was upregulated during the
time course of detachment, a result that is difficult to interpret since this would presumably enhance binding to the silicone elastomer surface. Neither MNN4 nor CSA1 (WAP1) were among the genes differentially regulated in either the time course analysis or the batch comparison.
PGA10 (RBT51), coding for a (putative) mannosylated
GPI anchored protein, was upregulated during the time course and RBT5, coding for a GPI-anchored cell wall pro-tein, was upregulated by factors of, respectively, 4.7 and 16.5 in the 1 and 3 h biofilm/batch culture comparisons, but did not appear as a significantly regulated gene in the time course analysis. (RBT5 was also one of the genes up regulated in response to hypoxia (5.5 fold change) in a previous study [39]).
We attempted to exploit the comparison between 1h F and 1h L biofilm subpopulations to identify additional genes that were involved in mediating adhesion with the idea that the pattern of expression of these genes during the time course might suggest genes involved in the detachment process. However, genes identified in this comparison were generally not ones that appeared in the time course analysis and, in fact, the genes in this compar-ison exhibited a pattern of expression that was relatively removed from the time point comparisons. This is shown both by the hierarchical clustering across the different comparisons (Figure 6), and principle components analy-sis (data not shown). Our interpretation is that genes identified in the comparison of 1h F and 1h L biofilm sub-populations, many of which fall into process categories of glycosylation, vesicle trafficking and transport, are candi-dates for mediating cohesive (cell to cell) interactions rather than adhesive (cell to surface) interactions. The batch cultures that we used for our biofilm/batch comparison were similar to biofilms in both morphogen-esis and cell aggregation behavior, and thus we antici-pated that this comparison might reveal genes associated with the biofilm-specific process of detachment. A sub-stantial proportion of the 201 genes that were differen-tially regulated in the biofilm/batch comparison were probably associated with a response to a relative state of hypoxia in the biofilm (Figure 9) [39]. However, expres-sion of 12 genes coding for cell surface proteins were not differentially regulated in the previous analysis of the C.
albicans response to hypoxia (ALS3, CDC19, FRE10, HEM13, HSP104, HYR1, orf19.822, PGA10, PGA52,
PGA7, PHR1, and SOD5). Of these 12 genes, the most
highly upregulated gene in the 3 h biofilm to batch com-parison was orf19.822, a gene coding for a soluble protein that is more abundant in C. albicans biofilms formed on silicone elastomer than in corresponding batch cultures [51]. A notable proportion (5 of 12) of the cell surface genes code for GPI anchored or putative GPI anchored cell wall proteins (PGA10, PGA52, PGA7 (CRW3, RBT6),
PGA10 (RBT51, RBT8), and HYR1).
The patterns of gene expression across the time course conditions uncovered by K means analysis, supplemented by the biofilm/batch comparison and the inferred func-tion suggested to us that AMS1, PSA2, CWH8, PGA13, orf19.822, AQY1, and ALS1 were candidates for playing a major role in the detachment process. Inferred functions of AMS1, PSA2, CWH8 and PGA13 indicated that these genes might play a role in restructuring the cell wall, thus possibly modifying the adhesive properties [52-54].
AMS1 and orf19.822 were among the genes identified as
unique to the biofilm process according to the batch com-parison. Orf19.822 codes for a protein that may contrib-ute to biofilm formation on silicone elastomer surfaces [51]. We speculated that Aqy1p [55] might be one compo-nent in a system enabling an orientational response to oxygen gradients, since hyphal orientation is regulated by calcium ion channels [56] and aquaporins are proposed to have a role in cell tropism by acting in concert with ion channels to regulate cell volume changes [57]. AQY1 was highly up regulated in the biofilm/batch comparison.
ALS1 was the major overexpressed gene in a detailed
microarray studies that compared biofilms and batch cul-tures grown under a variety of conditions [30]. ALS1 has been described as a down stream effector of morphogene-sis [58-60]. Down regulation of ALS1 was associated with detachment so a strain expressing ALS1 constitutively under the control of the ACT1 promoter was constructed. We also chose ALS3 for mutant analysis based on its apparent contribution to the establishment of firm adhe-sion of 1 h biofilms. In addition, we characterized the detachment behavior of mutants lacking expression of
MKC1, a mitogen activated kinase, shown previously to
be involved in surface sensing [41] and YWP1, a gene shown previously to be involved in detachment of yeast forms [16]. While the mutant strains pga13/pga13, mkc1/
mkc1 and ACT1-ALS3 exhibited slight modifications in
the detached biofilm phenotype, there was no strong indi-cation that any of the gene products encoded by our can-didate gene list was a primary determinant in mediating detachment.
It is possible that the detachment process we observed is not regulated at the level of transcription. Alternatively, the process could well be orchestrated by transcriptional regulation of a set of genes in a complex manner as is
evi-dent from the various interacting factors that have been shown to influence CSH [50,61-64]. An intriguing possi-bility is that the hyphae that extend from the edge of the detached biofilm might be phenotypically distinct from the hyphae in the interior and that this phenotypic differ-ence is conferred at the level of transcriptional regulation. There are also numerous possible points of post-transcrip-tional control [65]. The first step in testing this latter hypothesis would be to compare the transcriptome with the proteome, with a focus on cell wall proteins. The fairly abrupt, clearly discernable detachment process we have described would provide an ideal system for exploring these alternative, post-transcriptional mechanisms. The detachment processes in bacterial biofilms that show evidence of active regulation can be classified into those which are elicited by an external stimulus [23-25,66] and seeding dispersal, which occurs without applying an obvi-ous external stimulus [27,67,68]. In this respect the detachment process we have described is similar to seed-ing dispersal since there is no obvious change in nutrient loading (or hydrodynamic shear stress). Evidence has been obtained that seeding dispersal is initiated by a change in an internal microenvironment in the biofilm [67]. The batch comparison indicated that biofilm cells were experiencing a relative state of hypoxia, and there was some evidence that this response was amplified dur-ing the time course of detachment. However, we found no evidence that oxygen availability was a factor in the detachment process. One possibility is that the detach-ment phenomenon originates from a change in hyphal cell surface properties that is a generic part of germination under these conditions. The early stage biofilm we exam-ined did not exhibit the classic structure in which yeast are somehow sequestered at the base of the biofilm. It may be that these yeast are necessary for mediating the permanent adhesion to the surface, while hyphae provide an initial tenacious, but more transient anchor.
Conclusion
An early stage C. albicans biofilm inoculated from the yeast form onto a silicone elastomer surface and grown in rich medium under flow establishes both cohesive (cell-to-cell) and relatively strong adhesive (cell-to-surface) bonds. As cells germinate and hyphae grow by linear extension the adhesive bonds are progressively weakened over an 8 h period. This loss of adhesion is accompanied by a structural reorganization of hyphae along the perim-eter of the biofilm such that they become aligned in a direction perpendicular to the interfaces delineated by the biofilm-medium and biofilm-substratum boundaries. The most pronounced transition in both adhesion and structural reorganization occurs within the first 2 h of bio-film development.
A K means analysis of microarray time course data indi-cated that changes in the transcriptome that accompany the loss of adhesion fell into mutually exclusive func-tional categories. The most relevant categories were judged to be adhesion, biofilm formation and glycopro-tein biosynthesis. There was no obvious pattern to suggest that a single gene regulated the detachment process. Con-sistent with this finding, a functional analysis using mutant strains did not reveal any striking changes in the detachment phenotype upon deletion or overexpression of key genes.
At this point in our understanding of C. albicans biofilm detachment it is uncertain which in vitro biofilm models will be most relevant to understanding detachment proc-esses responsible for clinical cases of biomaterial centered infections. We propose that the biofilm model in our study will be useful for charactering aspects of early detachment events that may occur in catheters carrying a relatively rich medium such as vascular catheters deliver-ing total parenteral nutrition.
Methods
Strains and media
C. albicans strain SC5314 was used for microarray
analy-sis. Other strains used in this study are listed in Table 5. Stocks were stored in 10% glycerol at -80°C. A 1:1 dilu-tion of standard YPD (0.5% bacto yeast extract, 1% bacto peptone, 1% glucose) was used for culturing both bio-films and planktonic (broth) cultures. This was supple-mented with 1 mM L-arginine, 1 mM L-histidine and 0.5 mM uridine for culturing prototrophs. YPD was chosen for this study so comparisons with two other array studies could be made [36,37]. The carbon loading via glucose (55 mM) is similar to that used in other studies of C.
albi-cans biofilm formation on biomaterials [72-74]
Plasmid and C. albicans strain construction
Plasmid pFA-HIS1 was used as the template to prepare the HIS1-PCR cassette, and plasmid pFA-URA3 was used to prepare the URA3-PCR cassette as previously described [75]. They both have a common DNA backbone, allowing the same oligonucleotide pair to be used for the amplifi-cation of the two PCR cassettes. The oligonucleotides used in this work are listed and described (see Additional file 3). AMS1, PSA2, PGA13 and CWH8 genes were deleted in two steps. In the first step, one allele was replaced by homologous recombination with a PCR cassette contain-ing the HIS1 gene. The BWP17 strain was transformed with the PCR fragments, and the cells were plated onto YPD plates minus histidine. Genomic DNA of the positive colonies was analyzed by PCR for the proper integration site of the cassette. The second allele disruption was accomplished as for the first allele using the URA3-PCR cassette and the cells were plated onto YPD plates minus
uridine. The colonies were again analyzed by PCR to iden-tify the proper integration site. The complete deletion of candidate genes was confirmed by PCR using primers internal to the recombination sites amplifying ORF regions. Growth rate of mutant strains in liquid medium was similar to the wild type strain.
Biofilm cultures
Biofilms were cultured in a tubular reactor similar to that used in a previous study [29] (Figure 1). Biofilms were cul-tured in a 50 cm length of silicone elastomer tubing (Cole-Parmer, cat#96410-15) (5 mm ID, 10 mm OD), or, for one experiment, USP class VI medical grade silicone elastomer tubing of the same dimensions (P.E.P-plastics). Medium was pumped from a 2 L Erlemeyer flask using a peristaltic pump which was placed upstream of a flow break followed by the biofilm reactor. After sterilization by autoclaving the entire setup was placed in an incubator at 37°C. The inoculum was prepared as follows. 10 ml of broth was inoculated with a single colony from a YPD agar plate. Cultures were incubated on a shaker at 280 rpm and 30°C to an OD600 of 0.4–0.5. This was used to inoculate a fresh 10 ml broth culture at 0.05 OD600 which was grown overnight under the same conditions. From this culture 20 ml of cells at 108 cells/ml in phosphate buffered saline (PBS) (0.1 M, pH 7.0) was prepared. The tubular reactor was clamped downstream of the air trap and, using a 20 ml syringe, the reactor was filled by draw-ing the cell suspension into the tubdraw-ing from the effluent end. The inoculated reactor was incubated for 1 h at 37°C before starting the medium flow at 1 ml/min.
Planktonic cultures
Batch cultures were grown at 37°C on a shaker at 280 rpm. Preparation of the inoculum for planktonic cultures was the same as for biofilm cultures. The medium volume of batch cultures grown for different periods of time was adjusted so that the cells would be exposed to the same volume of medium as the biofilm for each time point. Accordingly, batch cultures were all inoculated with 1 × 10⁸ cells and cultured in final volumes of 30, 60, 90, 120 and 180 ml for the 30, 60, 90, 120 and 180 min time points, respectively. For 90, 120 and 180 min time points the initial medium volume was 60 ml, and 30 ml aliquots of medium were added at appropriate times.
Biofilm sectioning
Biofilms were sectioned using two methods. For embed-ding in Spurr's resin [76] biofilm samples were fixed in situ at 4°C in 3% gluteraldehyde in PBS. The fixed sam-ples were washed at room temperature for 10 min in 20, 50 and 100% ethanol solutions successively. Samples were incubated in a series of Spurr's: 1:2 Spurr's: propyl-ene oxide (overnight at 4°C); 1:1 Spurr's: propylpropyl-ene oxide (8–10 h at room temperature), 2:1 Spurr's: propylene
oxide (overnight at 4°C) and full strength Spurr's (6–8 h at room temperature). The Spurr's solution of the last incubation was replaced by a fresh one and samples were baked for 10–12 h in an oven at 70°C. After cooling to room temperature, the silicone tube was removed from each sample and the hardened Spurr's column containing the biofilm was sectioned using a Reichert OM-U2 ultra-microtome. Sections were mounted on slides and imaged using a Nikon Eclipse E600 in epi-fluorescence mode. Samples for cryosectioning were prepared by excising a section of the silicone elastomer tube used to grow the biofilm with a fresh razor blade without disturbing the biofilm. Excess medium in the tube was carefully removed using a 10 ml syringe and needle. The tubing was cut lengthwise and the upper half was removed. The biofilm on the lower half was covered carefully with a layer of OCT (optimum cutting temperature formulation, Tissue-Tek) and placed on dry ice until completely frozen. The tubing was carefully peeled away from the frozen biofilm by warming up the tube part briefly between fingers. The frozen biofilm sample was dipped vertically into the center of a cryosectioning cup filled with fresh OCT which
was placed on dry ice until it was completely frozen. Fro-zen samples were sectioned at -19°C using a Leica CM1850 cryostat. The 5 μm thick cryosections were mounted on Superfrost/Plus microscope slides (Fisher Scientific), washed gently with distilled water to remove the excess OCT and dried at room temperature. Cryosec-tions were imaged using a Nikon Eclipse E800 microscope interfaced to a Metaview 2.0 image acquisition system (Molecular Devices). Unstained sections were viewed in transmission using DIC optics. Sections stained with cal-cofluor (Fungi-Fluor™ stain, Polysciences, Inc) were viewed in epi-fluorescence mode.
Antibody labeling of (1,3) glucan in biofilm cryosections
The protocol for staining biofilm cryosections for (1,3) β glucan was a modification of a published protocol [77]. The primary monoclonal antibody (mAb) was from Bio-supplies Australia (produced in mice). The secondary anti-mouse antibody, conjugated to Alexa Fluor 488, was from Invitrogen (produced in rabbits). We used plank-tonic cells grown at 30°C and adhered to slides used for cryosectioning (Superfrost/Plus microscope slides, Fisher Scientific) as positive and negative controls. The negative
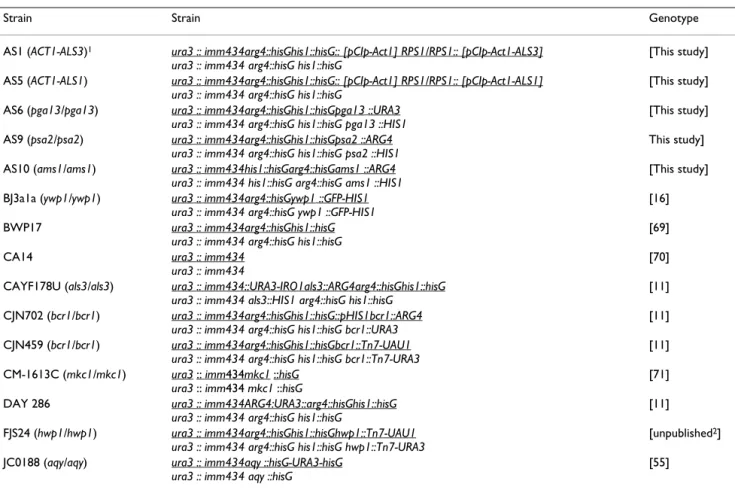
Table 5: Candida albicans strains used in the study
Strain Strain Genotype
AS1 (ACT1-ALS3)1 ura3 :: imm434arg4::hisGhis1::hisG:: [pCIp-Act1] RPS1/RPS1:: [pCIp-Act1-ALS3]
ura3 :: imm434 arg4::hisG his1::hisG
[This study] AS5 (ACT1-ALS1) ura3 :: imm434arg4::hisGhis1::hisG:: [pCIp-Act1] RPS1/RPS1:: [pCIp-Act1-ALS1]
ura3 :: imm434 arg4::hisG his1::hisG
[This study] AS6 (pga13/pga13) ura3 :: imm434arg4::hisGhis1::hisGpga13 ::URA3
ura3 :: imm434 arg4::hisG his1::hisG pga13 ::HIS1
[This study] AS9 (psa2/psa2) ura3 :: imm434arg4::hisGhis1::hisGpsa2 ::ARG4
ura3 :: imm434 arg4::hisG his1::hisG psa2 ::HIS1
This study] AS10 (ams1/ams1) ura3 :: imm434his1::hisGarg4::hisGams1 ::ARG4
ura3 :: imm434 his1::hisG arg4::hisG ams1 ::HIS1
[This study] BJ3a1a (ywp1/ywp1) ura3 :: imm434arg4::hisGywp1 ::GFP-HIS1
ura3 :: imm434 arg4::hisG ywp1 ::GFP-HIS1
[16] BWP17 ura3 :: imm434arg4::hisGhis1::hisG
ura3 :: imm434 arg4::hisG his1::hisG
[69] CA14 ura3 :: imm434
ura3 :: imm434
[70] CAYF178U (als3/als3) ura3 :: imm434::URA3-IRO1als3::ARG4arg4::hisGhis1::hisG
ura3 :: imm434 als3::HIS1 arg4::hisG his1::hisG
[11] CJN702 (bcr1/bcr1) ura3 :: imm434arg4::hisGhis1::hisG::pHIS1bcr1::ARG4
ura3 :: imm434 arg4::hisG his1::hisG bcr1::URA3
[11] CJN459 (bcr1/bcr1) ura3 :: imm434arg4::hisGhis1::hisGbcr1::Tn7-UAU1
ura3 :: imm434 arg4::hisG his1::hisG bcr1::Tn7-URA3
[11] CM-1613C (mkc1/mkc1) ura3 :: imm434mkc1 ::hisG
ura3 :: imm434 mkc1 ::hisG
[71] DAY 286 ura3 :: imm434ARG4:URA3::arg4::hisGhis1::hisG
ura3 :: imm434 arg4::hisG his1::hisG
[11] FJS24 (hwp1/hwp1) ura3 :: imm434arg4::hisGhis1::hisGhwp1::Tn7-UAU1
ura3 :: imm434 arg4::hisG his1::hisG hwp1::Tn7-URA3
[unpublished2]
JC0188 (aqy/aqy) ura3 :: imm434aqy ::hisG-URA3-hisG ura3 :: imm434 aqy ::hisG
[55]
1 Simple genotype description for the mutants used in the study. 2Constructed by Frank J Smith
control was omission of the primary antibody. In this case no fluorescence was detected under exposure conditions in which there was relatively bright fluorescence originat-ing from cells exposed to the primary antibody. In addi-tion, fluorescence was in every case associated with cells as confirmed by comparing images acquired using epi-fluo-rescence and transmission modes (data not shown). OCT was rinsed from the biofilm cryosections before antibody staining using Tween Tris Buffered Saline (TTBS), pH 7.6. This was followed by exposure to TTBS with 1% BSA (15 min), exposure to the primary mAb at 4 ug per ml in TTBS (1 h), three washes with TTBS (5 min each), exposure to the secondary Ab at a 1:100 dilution in TTBS (30 min) and a wash with TTBS 3 times (5 min each).
Digital camera images and movies
Digital camera images were acquired using an Olympus SP-350 8 Megapixels digital camera at the highest resolu-tion mode. Digital movies were recoded using a QX5 Computer Microscope (Digital Blue Inc.).
Cell counts and hyphal length
Both biofilms and planktonic cultures were exposed to 20 mg/ml pronase in Tris buffer (10 mM Tris/HCl, pH 8.0, 2 mM EDTA) for 60 min to disperse cell aggregates accord-ing to a previously published protocol. [78] (Cell aggre-gates could not be dispersed sufficiently for either counting or hyphal length measurement by vortexing alone). Cells were counted in a hemacytometer. Hyphal length was measured from images acquired of dispersed cells using the Nikon/Metaview system described above.
Field emission scanning electron microscopy (FESEM)
The tubing was first drained as described in the following section. A tube section was excised and cut lengthwise into two pieces. The bottom part, where the cells settle and form the biofilm, was immersed overnight in fixing buffer (1% paraformaldehyde, 2.5% gluteraldehyde in 0.1 M sodium cacodylate buffer, pH 7.2–7.4). The fixed samples were rinsed twice for 10 min in 0.1 M sodium cacodylate buffer and dehydrated twice for 5 min in 50%, 70%, 90% and 100% ethanol solutions. Samples were dried at room temperature. Samples were coated with a thin film of irid-ium, 15 s at 20 mA, in a Emitech sputter coater. Cells were viewed with a Supra 55VP FESEM (Zeiss) using the Inlens detector at 1 kV and 3 mm working distance.
RNA preparation
Biofilm samples were collected by first clamping and then removing the colonized section of the tubing. The liquid column was drained into a 50 ml polypropylene tube placed in an ice bath by moving the tubing to a vertical position and releasing the clamps. For 1 h biofilms the more firmly attached biofilm was then removed by rolling the tubing between the hands followed by flushing the
tube with 25 ml of ice-cold RNase-free water using a 50 ml syringe to achieve the highest pressure possible. This pro-cedure was accomplished in less than 3 min for each experiment. Cells from batch cultures were collected by pouring the contents of the culture flask into 50 ml poly-propylene tubes in an ice bath. Cells from biofilm or batch cultures were centrifuged at 4°C in 10–20 ml aliq-uots at 2500 × g for 3 min, washed with ice-cold RNase-free H2O and immediately flash-frozen in liquid N2 and stored at -80°C until use.
To release the RNA from cells, samples stored at -80°C were placed on ice and RNeasy buffer RLT was added to pellets at a ratio of 10:1 [vol/vol] buffer/pellet. The pellet was allowed to thaw in the buffer while vortexing briefly at high speed. The resuspended pellet was placed back on ice and divided into 1 ml aliquots in 2 ml screw cap microcentrifuge tubes containing 0.6 ml of 3 mm diame-ter acid-washed glass beads. Samples were homogenized 5 times, 1 min each, at 4200 RPM using the Mini-Bead-beater mill (Biospec Products Inc., Bartlesvile, OK, USA). Samples were placed on ice for 1 min after each homoge-nization step. After the homogehomoge-nization the Qiagen RNe-asy protocol was followed as recommended. Total RNA samples were eluted in RNase free H2O, flash-frozen in liquid N2, lyophilized and stored at -80°C until used for the different analyses.
Microarray experiments: cDNA labeling, hybridizations and data analysis
Four independent biological replicates were performed for each hybridization comparison. Labeling of the four biological replicate was performed using a dye-swap strat-egy that resulted in 2 experiments with Cy3/Cy5 and two experiments Cy5/Cy3 ratios. RNA quality and integrity were assessed using an Agilent 2100 Bioanalyzer. cDNA labeling and microarray production were performed as previously described by Nantel et al. [79]. Briefly, 20 μg of total RNA was reverse transcribed using oligo(dT)21 in the presence of Cy3 or Cy5-dCTP (Invitrogen) and Super-script III reverse tranSuper-scriptase (Invitrogen). Thereafter, template RNA was degraded by adding 2.5 units RNase H (USB) and 1 μg RNase A (Pharmacia) followed by incuba-tion for 15 min at 37°C. The labeled cDNAs were purified with QIAquick PCR Purification Kit (Qiagen). Prior to hybridization Cy3/Cy5-labeled cDNA was quantified using a NanoDrop ND-1000 UV-VIS spectrophotometer (NanoDrop) to confirm dye incorporation. Pre-hybridiza-tion and hybridizaPre-hybridiza-tion soluPre-hybridiza-tions consisted of DIG Easy Hyb solution (Roche Diagnostics, Mannheim, Germany) with 0.45% salmon sperm DNA and 0.45% yeast tRNA. Slides were washed once in 1.0% SSC, 0.2% SDS at 42°C for 10 min, twice in 0.1% SSC, 0.2% SDS at 42°C for 10 min, once in 0.1% SCC at 24°C for 5 min, followed by four rinses in 0.1% SSC. Chips were air dried before being