Publisher’s version / Version de l'éditeur:
Proceedings, 1, pp. 54-64, 2007-06-27
READ THESE TERMS AND CONDITIONS CAREFULLY BEFORE USING THIS WEBSITE.
https://nrc-publications.canada.ca/eng/copyright
Vous avez des questions? Nous pouvons vous aider. Pour communiquer directement avec un auteur, consultez la
première page de la revue dans laquelle son article a été publié afin de trouver ses coordonnées. Si vous n’arrivez pas à les repérer, communiquez avec nous à PublicationsArchive-ArchivesPublications@nrc-cnrc.gc.ca.
Questions? Contact the NRC Publications Archive team at
PublicationsArchive-ArchivesPublications@nrc-cnrc.gc.ca. If you wish to email the authors directly, please see the first page of the publication for their contact information.
NRC Publications Archive
Archives des publications du CNRC
This publication could be one of several versions: author’s original, accepted manuscript or the publisher’s version. / La version de cette publication peut être l’une des suivantes : la version prépublication de l’auteur, la version acceptée du manuscrit ou la version de l’éditeur.
Access and use of this website and the material on it are subject to the Terms and Conditions set forth at
Can Ice Barriers around Oil and Gas Drilling Structures Reduce System Cost?
Spencer, Paul; Masterson, Dan; Barker, Anne; Timco, Garry; Wright, B.
https://publications-cnrc.canada.ca/fra/droits
L’accès à ce site Web et l’utilisation de son contenu sont assujettis aux conditions présentées dans le site LISEZ CES CONDITIONS ATTENTIVEMENT AVANT D’UTILISER CE SITE WEB.
NRC Publications Record / Notice d'Archives des publications de CNRC:
https://nrc-publications.canada.ca/eng/view/object/?id=0b3b0357-bc84-4162-b718-acf041d684df https://publications-cnrc.canada.ca/fra/voir/objet/?id=0b3b0357-bc84-4162-b718-acf041d684df
54
Recent Development of Offshore Engineering in Cold Regions, Yue (ed.) POAC-07, Dalian, China, June 27-30, 2007.
@ 2007 Dalian University of Technology Press, Dalian, ISBN 978-7-5611-3631-7
CAN ICE BARRIERS AROUND OIL AND GAS DRILLING
STRUCTURES REDUCE SYSTEM COST?
Paul Spencer1, Dan Masterson1,2, Anne Barker3, Garry Timco3 and Brian Wright4
(1. Sandwell (Alberta) Ltd., Calgary, Alberta, Canada; 2. Now at Chevron Canada Resources, Calgary, Alberta, Canada;
3. National Research Council-Canadian Hydraulics Centre, Ottawa, Ontario, Canada; 4. B.Wright & Associates, Canmore, Alberta, Canada)
ABSTRACT
In the Canadian Beaufort Sea, the design ice load can often govern the cost of gravity based (GBS) oil or gas production structures. By installing suitable ice barriers around the structure, the design ice load for the GBS and hence its cost may be reduced. The cost of three candidate GBS were calculated as a function of design ice load and soil strength. Similarly the cost of the ice barrier was estimated as a function of barrier type, design ice load and soil strength. It was found that for some of the production structures on cohesive soils, the overall cost of the GBS plus the cost of the barrier was less than designing the GBS for the full ice load.
INTRODUCTION
For oil and gas production structures located in the Canadian Beaufort Sea, ice loading is usually the dominant driving force rather than the wave force or the seismic force. The overall structure cost is, in many cases, a function of the ice loading that the structure is designed to resist. Suitable ice barriers installed adjacent to such a structure, can reduce the magnitude of the design ice loading. The reduced ice loading may then result in changes to the structure design which may then result in reductions in the cost of a Gravity Based Structure (GBS). There is however a cost associated with the construction of the ice barriers. The paper addresses the following aspects: What is the likely reduction in the construction cost of a GBS from reducing the 100 year ice loading? What is the cost of an ice barrier that will result in a substantial
55
reduction in ice loading on the GBS? Are there combinations of ice barriers and GBS that will result in a net cost saving over the GBS alone?
GBS STRUCTURE OPTIMISATION
The design parameters chosen to reflect the general conditions for this geographical location are given in Table 1, in practice they will be site specific. The nominal design ice load used for this location is 10 MN/m. (e.g. Croasdale & Brown 2000)
Table 1 Environmental Parameters
Parameter Value/s
500 year seismic acceleration 0.08g (NRCan 2005)
100 significant wave height 6.0m (Caires 2005)
100 Year Ice Loading 0 to 10.0 MN/m
Soil Strength 25, 50, 100 kPa; 30deg (Barker & Timco 2004)
The candidate GBS structures listed in Table 2, represent a range of production scenarios for the Canadian Beaufort Sea. All structures were constructed from steel and had Dry storage, where the storage space is full of air when empty of product. Wet storage has the oil storage space full of sea water when empty of product.
Table 2 Representative GBS
Structure Water Depth Type Storage Deck
1 15m Caisson 0 barrels 80×80×20m, 30,000 t
2 30m Caisson 1,000,000 barrels 125×125×30m, 45,000 t
3 30m 4 legged 1,000,000 barrels 125×125×30m, 45,000 t
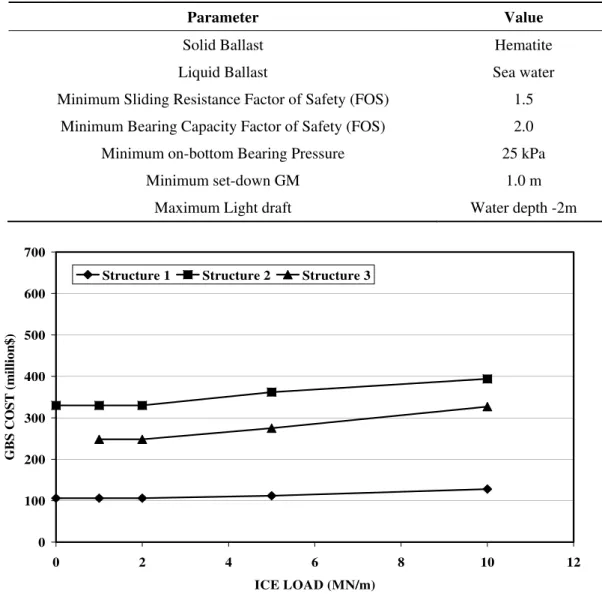
A custom computer program allowed for the conceptual design of minimum construction cost GBS taking into account the appropriate engineering constraints (Spencer et.al. 2005A and 2005B). The method used a grid-search algorithm where structural geometric variables and solid ballast volume were varied over a range of grid points and the lowest cost structure satisfying the various engineering constraints listed in Table 3 is retained. The resulting structure costs in US dollars as a function of ice load are presented in Fig.1, Fig.2 and Fig.3. Additional data are given in Spencer (2007).
Note, runs were not done for Structure 2 at 0 MN/m. Costs for the 25 kPa soil case are given in Table 4. Generally the optimization routine could not find a structure satisfying all the constraints and approximate solutions were generated (Spencer et.al.
56
2005A). In Fig. 3 for structures 1 and 2, a solution was not found at the higher ice load levels.
The GBS type-cohesive soil strength combinations that showed a strong dependence of cost on design ice load were selected for calculation of the barrier costs. The frictional soil case was not pursued as there was not a strong cost-ice-force relationship.
Table 3 GBS Optimization Routine Constraints
Parameter Value
Solid Ballast Hematite
Liquid Ballast Sea water
Minimum Sliding Resistance Factor of Safety (FOS) 1.5
Minimum Bearing Capacity Factor of Safety (FOS) 2.0
Minimum on-bottom Bearing Pressure 25 kPa
Minimum set-down GM 1.0 m
Maximum Light draft Water depth -2m
0 100 200 300 400 500 600 700 0 2 4 6 8 10 12 ICE LOAD (MN/m) G B S C O S T (m illi on $ )
Structure 1 Structure 2 Structure 3
57 0 100 200 300 400 500 600 700 0 2 4 6 8 10 12 ICE LOAD/ MN/m GBS COST (106$)
Structure 1 Structure 2 Structure 3
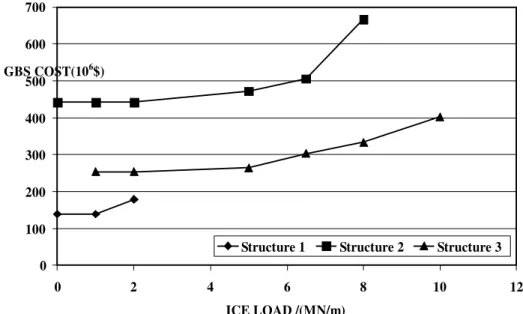
Fig. 2 BS Costs 100kPa Cohesive Soil Case
ICE BARRIER CONCEPT
As indicated in Fig. 2 and Fig. 3, the construction cost of the GBS is reduced by reducing the design ice load. Various types of Ice Barriers have been discussed in Barker & Timco (2005). The ice barrier concept used here is illustrated in Fig. 4 where the barriers would be offset from the GBS location. Depending on the ice drift direction at the site, not all four barriers may be required. In general, the barriers can be surface piercing or non-surface piercing. If they are surface piercing then they need to be designed for the same ice loading as the GBS. In that case rubble would be generated outside of the barriers. For a non-surface piercing barrier, the level ice sheet would float over the top of the barrier and rubble adjacent to the GBS. The barriers would then promote the retention of the ice rubble. The barriers would reduce the effective ice load on the GBS from thick ice features such as ridges or multi-year floes by the deeper parts of the keel interacting with the barrier. Three types of ice barrier configurations were considered, a “T” shaped barrier, a wedding cake shaped barrier and a pile augmented barrier shown in Fig. 5. The basic wedding cake configuration does not have the piles. The T shaped barrier was found to be less efficient in terms of material quantity than the basic wedding cake configuration and was not considered further.
58 0 100 200 300 400 500 600 700 0 2 4 6 8 10 12 ICE LOAD /(MN/m) GBS COST(106$)
Structure 1 Structure 2 Structure 3
Fig. 3 BS Costs 50kPa Cohesive Soil Case Table 4 BS Costs 25 kPa Cohesive Soil Case
Structure Cost (106$US) Comment
1 200 Approximate solution at 0.0MN/m
2 570 Approximate solution at 0.0MN/m
3 988 Solution at 1.0MN/m
GBS BARRIER
59
Fig. 5 Cross section of Underwater Barriers
BARRIER COSTS
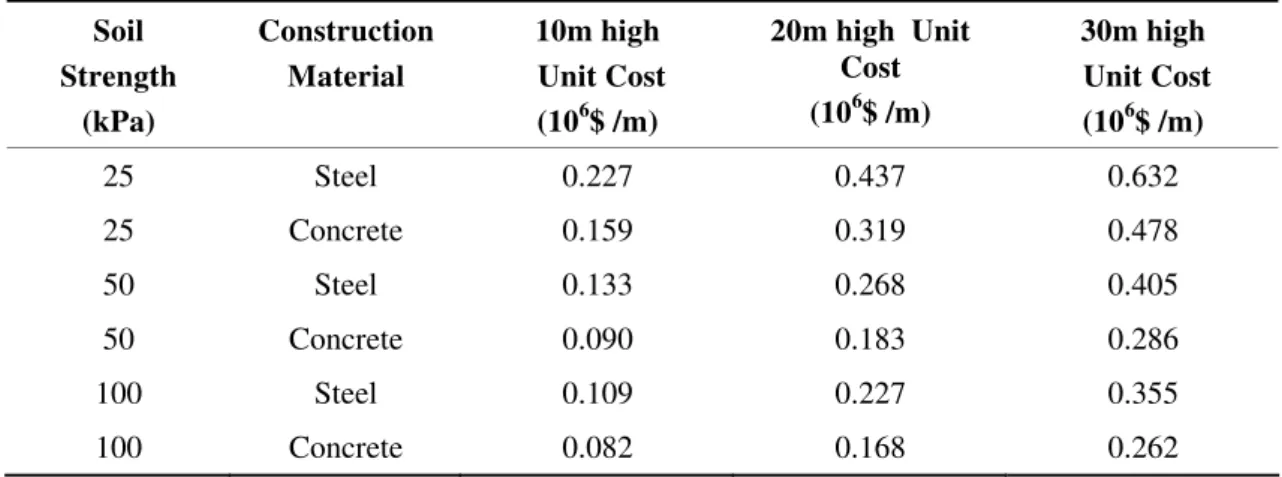
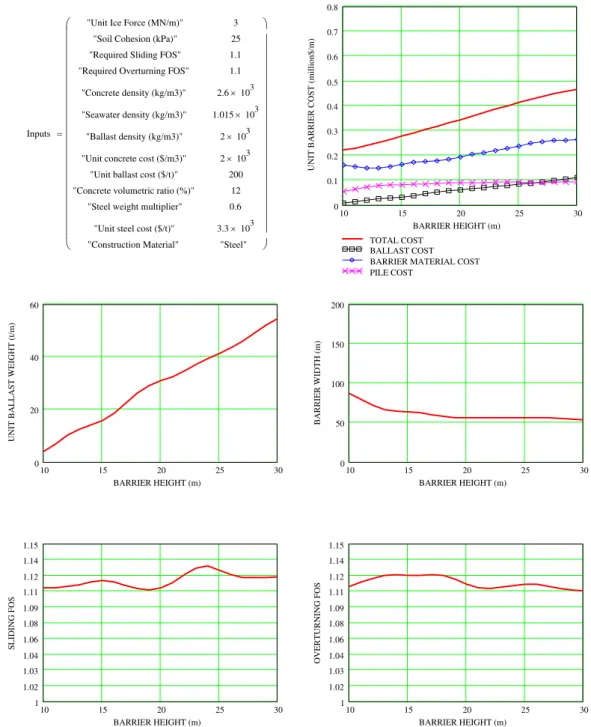
The costs for the basic wedding cake and pile augmented barrier were evaluated for a range of parameters; design ice force applied at the top of the barrier, height of the barrier, soil strength, steel or concrete construction material, solid ballast volume, spacing of piles and design factors of safety. A separate grid-search algorithm was used where the base width of the barrier, ballast volume and pile spacing were varied over a range of grid points and the lowest cost barrier satisfying the required sliding and overturning or bearing factor-of-safety (FOS) retained. The various inputs used in the algorithm are given in Fig. 6 along with an example of the calculated barrier cost and geometry. The piles are Spin Fin Piles (PN&D 2006) with nominal dimensions of 1.2m shaft diameter, a 2 m diameter fin 3 m long fin with an overall burial depth of 18m. A unit cost of $250,000 was used. The tension and lateral capacity of the Spin Fin Piles in cohesive soils used the methods given by CADOT (2001) and Poulos et al. (2001) respectively. As indicated in Fig. 6 lower concrete and steel volumes were used compared with that used in the design of the GBS (Spencer et al, 2005A). Also a lower FOS of 1.1 was evaluated as well as the usual factors for a GBS given in Table 3. Representative wedding cake barrier costs are provided in Table 5 and the Spin fin Pile augmented barrier in Table 6.
Table 5 Unit Cost of “Wedding Cake” Barrier 3.0 MN/m ice force and 1.1 FOS Soil Strength (kPa) Construction Material 10m high Unit Cost (106$ /m) 20m high Unit Cost (106$ /m) 30m high Unit Cost (106$ /m) 25 Steel 0.227 0.437 0.632 25 Concrete 0.159 0.319 0.478 50 Steel 0.133 0.268 0.405 50 Concrete 0.090 0.183 0.286 100 Steel 0.109 0.227 0.355 100 Concrete 0.082 0.168 0.262
60
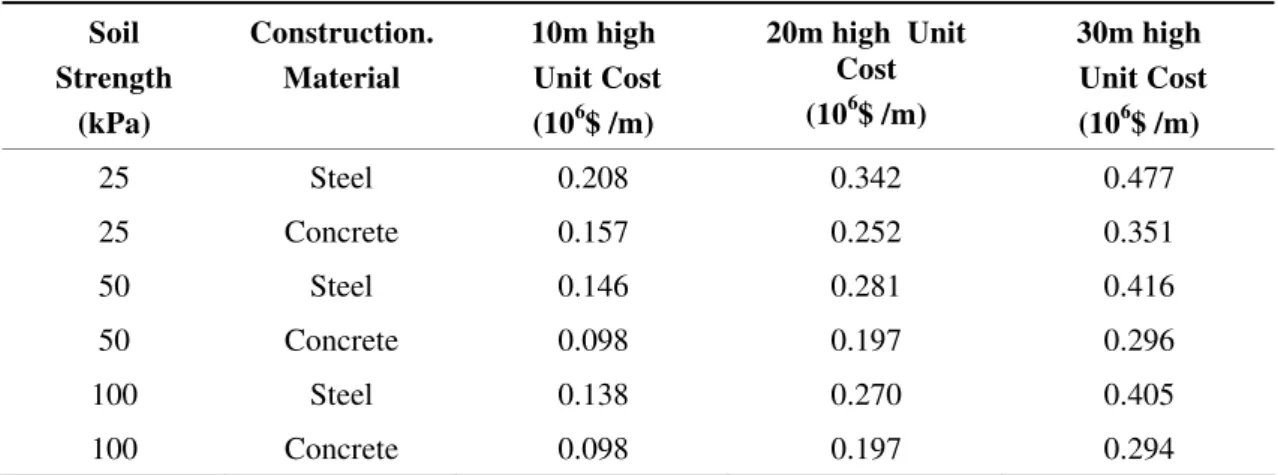
Table 6 Unit Cost of Pile augmented Barrier 3.0MN/m ice force and 1.1 FOS Soil Strength (kPa) Construction. Material 10m high Unit Cost (106$ /m) 20m high Unit Cost (106$ /m) 30m high Unit Cost (106$ /m) 25 Steel 0.208 0.342 0.477 25 Concrete 0.157 0.252 0.351 50 Steel 0.146 0.281 0.416 50 Concrete 0.098 0.197 0.296 100 Steel 0.138 0.270 0.405 100 Concrete 0.098 0.197 0.294
Additional runs were done to investigate the cost savings of the reduced FOS compared with those given in Table 3 (Spencer 2007). For the pile barrier, the higher FOS had a cost 33% higher than presented in Table 6. For the wedding cake barrier in Table 5 the cost depended on soil strength with the cost 33% higher at 25 kPa and 6% higher at 100 kPa. For both types of barriers, using concrete construction material was approximately 72% of the cost of using steel construction material.
From data in Tables 5 and 6 the pile augmented barrier has a cost advantage over the basic wedding cake for the 25 kPa soil case and the wedding cake has a cost advantage over the pile augmented barrier for the 50 and 100 kPa soil cases.
Additional calculations were done for the pile assisted barriers at higher load levels using concrete construction, a FOS of 1.1 and a 25 kPa soil strength. These data are given in Table 7.
Table 7 Unit Cost of Pile augmented Barrier at higher load levels Ice Load (MN/m) 10 m high Unit Cost (106$ /m) 20 m high Unit Cost (106$ /m) 30 m high Unit Cost (106$ /m) 5.0 0.258 0.370 0.497 7.5 0.387 0.511 0.660 DISCUSSION
We look for combinations of a barrier plus GBS that result in a cost saving relative to a GBS designed for an ice force of 10 MN/m. We shall assume that the total length of barrier is 400 m in the general locations indicated in Fig. 4. This is a conservative
61
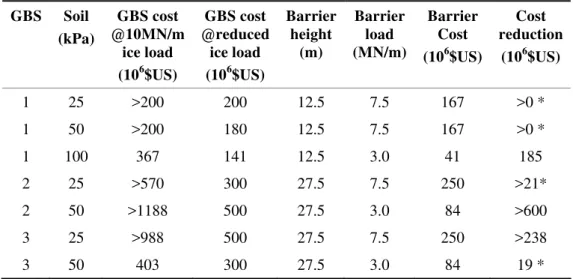
assumption as in most cases the ice drift would likely have a pronounced directionality and barriers on only 3 sides would be required. Table 8 lists the combinations where an ice barrier results in overall cost savings.
10 15 20 25 30 0 0.1 0.2 0.3 0.4 0.5 0.6 0.7 0.8 TOTAL COST BALLAST COST BARRIER MATERIAL COST PILE COST BARRIER HEIGHT (m) U N IT BA RRIER CO ST (million$/m) Inputs
"Unit Ice Force (MN/m)" "Soil Cohesion (kPa)" "Required Sliding FOS" "Required Overturning FOS"
"Concrete density (kg/m3)"
"Seawater density (kg/m3)"
"Ballast density (kg/m3)"
"Unit concrete cost ($/m3)" "Unit ballast cost ($/t)" "Concrete volumetric ratio (%)"
"Steel weight multiplier"
"Unit steel cost ($/t)" "Construction Material" 3 25 1.1 1.1 2.6×10³ 1.015×10³ 2×10³ 2×10³ 200 12 0.6 3.3×10³ "Steel" ⎛⎜ ⎜ ⎜ ⎜ ⎜ ⎜ ⎜ ⎜ ⎜ ⎜ ⎜ ⎜ ⎜ ⎜ ⎜ ⎜ ⎜ ⎜ ⎜⎝ ⎞⎟ ⎟ ⎟ ⎟ ⎟ ⎟ ⎟ ⎟ ⎟ ⎟ ⎟ ⎟ ⎟ ⎟ ⎟ ⎟ ⎟ ⎟ ⎟⎠ = 10 15 20 25 30 0 20 40 60 BARRIER HEIGHT (m) UNI T BAL L A ST WE IGHT ( t/m ) 10 15 20 25 30 0 50 100 150 200 BARRIER HEIGHT (m) BARRI ER WI DTH ( m ) 10 15 20 25 30 1 1.02 1.03 1.04 1.06 1.08 1.09 1.11 1.12 1.14 1.15 BARRIER HEIGHT (m) SL ID ING FOS 10 15 20 25 30 1 1.02 1.03 1.04 1.06 1.08 1.09 1.11 1.12 1.14 1.15 BARRIER HEIGHT (m) OVE RT URNI NG FOS
62
Table 8 Cost reducing GBS-Barrier Combinations GBS Soil (kPa) GBS cost @10MN/m ice load (106$US) GBS cost @reduced ice load (106$US) Barrier height (m) Barrier load (MN/m) Barrier Cost (106$US) Cost reduction (106$US) 1 25 >200 200 12.5 7.5 167 >0 * 1 50 >200 180 12.5 7.5 167 >0 * 1 100 367 141 12.5 3.0 41 185 2 25 >570 300 27.5 7.5 250 >21* 2 50 >1188 500 27.5 3.0 84 >600 3 25 >988 500 27.5 7.5 250 >238 3 50 403 300 27.5 3.0 84 19 *
Engineering judgment has been used in estimating the GBS cost at the reduced ice load level. Also the top of the ice barrier was set at 2.5m below sea level. The load capacity of the barrier was selected depending on the particular requirements, data from Fig. 2 and Fig.3 plus Table 4 were used in this assessment. Given the uncertainties involved in the cost estimates, items marked with a * in Table 8 have a cost advantage that is too small to be reliable. From Table 8 there are three combinations of GBS and soil strength that have advantages using the barrier concept. From the data presented in Fig. 1 for the 30deg frictional soil case no structures had a cost advantage from using the barrier concept. Thus the barrier concept would have most applicability in locations where there are weak cohesive soils. Note that for cohesive soils, the sliding resistance of a GBS is increased by increasing the seabed contact area. This usually results in a larger water-plane cross section structure that then results in a larger ice load etc. For a frictional soil the resistance is increased by increasing the structure weight on bottom. This can be achieved for example, by adding solid ballast, which may not result in an increased water-plane cross section. Weak cohesive soils have also been addressed in the Beaufort Sea by dredging the seabed to expose stronger layers at depth. The barrier concept should be considered as an additional GBS design option.
Any cost advantage for the ice barrier concept, is dependent on the particular soil conditions, the actual design ice load and the details of GBS that is required. Analysis on a case-by-case basis should be done.
CONCLUSIONS
In the Canadian Beaufort Sea the design ice force is usually larger than the wave force or the seismic force. For three typical production structures, the GBS cost as a
63
function of ice force suggested combinations of structure and soil strength where the GBS cost is a strong function of ice force. Three types of ice barriers were considered, a T shaped barrier, a wedding cake shaped barrier and a pile augmented wedding cake barrier and their cost was determined. The most cost effective barriers were the wedding cake barrier constructed from concrete at 50 kPa and 100 kPa soil strength. For the 25 kPa soil strength the pile augmented barrier from concrete was the most cost effective. For the 25 kPa soil case there was difficulty in designing a GBS for the assumed 10 MN/m ice load. Ice barriers could be designed to reduce the ice load on the structure to the point where a design was either possible or quantifiably cheaper. For example with structure 1 situated in a 15m water depth the cost saving of a barrier for 100 kPa soil strength was estimated to be 185 million$.
Thus there are situations where an ice barrier could reduce the cost of a GBS design or augment the capacity of the GBS for resisting ice forces.
ACKNOWELGEMENTS
The financial support of the Climate Change Technology Innovation Initiative Unconventional Gas Supply Program (CCTII UGS) is acknowledged. The advice from Dennis Nottingham of PN&D on Spin Fin Piles is also acknowledged.
REFERENCES
Barker, A., Timco, G.W.(2004) Sliding Resistance of grounded Spray Ice Islands, 17th International Symposium on Ice, St Petersburg, Russia.
Barker, Anne, Timco Garry, (2005) Overview of Ice Rubble Generators and Ice Protection Structures in Temperate Regions, , 18th International Conference on Port and Ocean Engineering under Arctic Conditions, POAC’05, Potsdam, NY,USA. CA DOT (2001)
http://www.dot.ca.gov/hq/esc/construction/Manuals/TrenchingandShoring/appendix_ E
Caires S., A Sterl (2005) “100 Year return value estimates for wind speed and significant wave height from the ERA-40 data”, Journal of Climate ,18:1032-1048. Croasdale K., Brown, T, (2000) Ice Load Uncertainties – Progress in their Resolution, ISOPE 2000, Seattle ,USA.
NRCan 2005, Natural Resources Canada
http://earthquakescanada.nrcan.gc.ca/hazard/zoning/NBCC2005maps_e.php. PN&D http://www.pnd-anc.com/services/spinfin_pile.htm.
64
Puolos H.G.., Carter J.P., Small J,C. (2001),Foundations and retaining structures – research and practice, PROC. 15th Int. Conf. Soil Mech. Found. Engng, Istanbul. Spencer Paul A., Daniel M. Masterson, Denis Blanchet, Alex Martin, (2005A), A Computer Routine for Sizing Gravity Based Structures in Ice Covered Waters : Engineering Basis, 18th International Conference on Port and Ocean Engineering under Arctic Conditions, POAC’05, Potsdam, NY, USA.
Spencer Paul A., Daniel M. Masterson, Denis Blanchet, Alex Martin, (2005B), A Computer Routine for Sizing Gravity Based Structures in Ice Covered Waters : Model Results, 18th International Conference on Port and Ocean Engineering under Arctic Conditions, POAC’05, Potsdam, NY,USA.
Spencer Paul A.(2007) Can Ice Barriers around Oil and Gas Drilling Structures Reduce System Cost, Report to National Research Council-Canadian Hydraulics Centre, Ottawa, Ontario, Canada