Automated Medical Trend Detection by
Mary DeSouza
Submitted to the Department of Electrical Engineering and Computer Science in Partial Fulfillment of the Requirements for the Degree of
Master of Engineering in Electrical Engineering and Computer Science at the Massachusetts Institute of Technology
May 22, 2000
G Copyright 2000 M.I.T. All rights reserved.
The author hereby grants to M.I.T. permission to reproduce and distribute publicly paper and electronic copies of this thesis
and to grant others the right to do so.
Departmentp lectrical Engineodng and Computer Science
'A May 22, 2000
Professor Szolovits Thes Supervisor
Artiur C. Smith Chairman, Department Committee on Graduate Theses Accepted by.
MASSACHUSETTS INSTITUTE
OF TECHNOLOGY
Authoi
Automated Medical Trend Detection
by Mary DeSouza
Submitted to the
Department of Electrical Engineering and Computer Science May 22, 2000
In Partial Fulfillment of the Requirements for the Degree of Master of Engineering in Electrical Engineering and Computer Science
Abstract
An automated medical trend detection program, TrenDx, was developed in earlier work by Haimowitz [1] and Le [2]. It was evaluated on its ability to discern growth
abnormalities by matching templates of expected growth patterns. The results of these evaluations were somewhat disappointing because the program was inefficient and could not reach the level of sensitivity and specificity of human physicians in referral decisions. This thesis involved engineering improvements in the original program and evaluations of the new updated program. The engineering changes allow the program to run on faster machines and eliminate the long run times. The revised scoring algorithms effectively prevent the program from reaching erroneous conclusions from too little data. Re-evaluation of previous data and analysis of newly collected data show genuine
improvements in the performance of TrenDx, which now performs at a level comparable to physicians and may soon be used in a clinical setting.
Thesis Supervisor: Peter Szolovits
Table of Contents
1. IN TR O D U CTIO N ... 7 1.1 IMPORTANCE ... 7 1.2 Aims OF RESEARCH ... 9 1.3 GUIDE To THESIS ... 9 2. TR EN D X ... 10 2.1 OVERVIEW OF TRENI)x ... 102.2 TEMPORAL U TILITY PACKAGE (TUP) ... 11
2.3 TREND TEMPLATES ... 12
2.4 CONSTRAINTS ... 13
2.5 H YPOTHESES ... 17
2.6 SCORING AND CONCLUSION REACHING ... 17
2.7 TRIGGERING AND OUTPUT ... 19
3. PED IA TRIC G R O W TH ... 20 3.1 TREND TEMPLATES ... 20 3.2 PATIENTS ... 21 3.3 M ETHOD ... 23 4. TREN D X IM PR O V EM EN TS ... 23 4.1 EFFICIENCY ... 23 4.2 A CCURACY ... 25 4.3 TESTING ... 26
5. RESULTS...27
5.1 MEDICAL RECORD GOLD STANDARD ... 28
5.2 DECISION BREAKDOWN...29
5.3 RESULTS OF CHANGING THRESHOLD TRIGGERING VALUES ... 31
5.4 LOWERING THRESHOLDS... 32
5.5 RAISING THRESHOLDS...33
5.6 CHANGING THRESHOLDS SUMMARY... 35
5.7 R O C A N ALYSIS ... 35
5.8 COMPARISON OF GOLD STANDARDS...37
5.9 COMPARISONS WITH CONSENSUS CASES... 39
5.10 NEW DATA ANALYSIS...41
6. CONCLUSIONS... 44
6.1 PREVIOUS RESEARCH.... ... 48
6.2 APPLICATIONS...50
6.3 FUTURE WORK...52
7. APPENDIX A: RESULTS OF NEW TRENDX WITH PREVIOUSLY COLLECTED DATA ... 55
8. APPENDIX B: RESULTS OF TRENDX WITH NEW DATA ... 59
List of Tables
TABLE 1: DISORDER BREAKDOWN OF PATIENTS FROM LE'S TRIALS ... 22
TABLE 2: DISORDER BREAKDOWN OF PATIENTS FROM NEW DATA... 26
TABLE 3: REFERRALS OF TRENDx VS. MEDICAL RECORD DIAGNOSES... 28
TABLE 4: REFERRALS OF PHYSICIANS VS. MEDICAL RECORD DIAGNOSES ... 28
TABLE 5: DISORDER BREAKDOWN OF TRENDx VS. MEDICAL RECORD DIAGNOSES...29
TABLE 6: DISORDER BREAKDOWN OF PHYSICIANS VS. MEDICAL RECORD DIAGNOSES... 30
TABLE 7: REFERRALS OF TRENDx VS. PEDIATRIC ENDOCRINOLOGIST ... 31
TABLE 8: REFERRALS OF PHYSICIANS VS. PEDIATRIC ENDOCRINOLOGIST ... 31
TABLE 9: REFERRALS OF TRENDx VS. ENDOCRINOLOGIST WITH LOWERED THRESHOLDS 32 TABLE 10:REFERRALS OF TRENDx VS. MEDICAL RECORD WiTH LOWERED THRESHOLDS 33 TABLE 11: REFERRALS OF TRENDx VS. ENDOCRINOLOGIST WITH RAISED THRESHOLDS .. 34
TABLE 12: REFERRALS OF TRENDx VS. MEDICAL RECORD WITH RAISED THRESHOLDS ... 34
TABLE 13: SUMMARY OF CHANGING THRESHOLD VALUES ... 35
TABLE 14: REFERRALS OF ENDOCRINOLOGIST VS. MEDICAL RECORD... 38
TABLE 15: DISORDER BREAKDOWN OF ENDOCRINOLOGIST VS. MEDICAL RECORD... 39
TABLE 16: BREAKDOWN OF CONSENSUS CASES AND SINGULAR DECISIONS ... 40
TABLE 17: REFERRALS OF TRENDx VS. MEDICAL RECORD, WITH NEW DATA ... 41
TABLE 18: REFERRALS OF TRENDx VS. MEDICAL RECORD, NEW DATA AND LOWERED TH RESH O LD S ... 42
TABLE 19: REFERRALS OF TRENDx VS. MEDICAL RECORD, NEW DATA AND RAISED TH RESH O LD S ... 42
List of Figures
FIGURE 1: TEMPORAL CONSTRAINT EXAMPLE ... 14
FIGURE 2: VALUE CONSTRAINT - CONSTANT BUILD ... 16
FIGURE 3: VALUE CONSTRAINT - CHRONOLOGICAL AGE - BONE AGE INCREASING... 16
FIGURE 4: ERROR FUNCTION ... 18
FIGURE 5: ROC CURVE - EXPERT GOLD STANDARD... 36
FIGURE 6: ROC CURVE - MEDICAL RECORD GOLD STANDARD... 37
Doctors of any type, from pediatrician to podiatrist, may all follow the same basic method for the diagnosis of their patient. They examine the history, current symptoms, and test results and attempt to match the current patient data with data from known diseases and conditions. They want to find important patterns that may lead them to diagnose the cause of the patients' symptoms. Doctors who are considered "good" are able to quickly decide which of the matched patterns are important and which data they should pay special attention to.
If a computer program was given possible trends to look out for, in addition to the knowledge to decide which of these trends is more important, then the program could perform the task of analyzing time-series data to trends as doctors do. This thesis will set out to build upon a previously developed trend detection and diagnosis computer program to improve its efficiency and capabilities. This program, which pattern matches
monitored data against trend templates that have been entered by an expert, is being designed to work in a clinical context. Yet, this program can be easily applied to a variety of domains. Any diagnostic monitoring application in which data is compared to previously known patterns can use this program.
1.1 Importance
These days the world is moving in the direction of having computers take over many human tasks. Computers often can perform tasks faster and with more accuracy than human beings. Yet, the medical world is not yet ready for computers to take over,
though systems are beginning to play roles in many clinical settings. Many medical expert systems are being developed to perform automated monitoring. However, it
should be noted that "the purpose of electronic monitoring systems is not to replace nurses, but to complement their observations with a reliable alternative." [3] If given the role of complementing doctors or nurses, or assisting physicians in diagnoses, then computers can begin to play a large role in clinical settings, as long as their accuracy can be improved so the systems can be trusted.
Once these systems have been developed and tested, they can be used in a variety of roles, including providing non-experts ways to diagnose, providing experts with an auxiliary tool for diagnosis, or providing diagnoses with explanations as a tutor for a novice so that they may become familiar with the field. [4]
TrenDx was designed as a diagnosis tool and the clinical setting where it should be used depends on its performance. This program was developed for the diagnosis of trends that are sequences of ordered data that are clinically significant when combined. [5] To do this, TrenDx uses trend templates, which represent disorders as patterns of relevant variables. These patterns lead the assignment of monitored data to intervals or phases. The program calculates a matching score based on how well the patient data fits the model of the trend template. The trend templates are then ranked by how well the data matches and a diagnosis is determined.
1.2 Aims of Research
This research set out to determine if this program had enough potential to be used clinically. For his thesis, Ira Haimowitz [1] designed TrenDx for automated trend
detection during diagnostic monitoring. Phillip Le [2] tested TrenDx in the clinical setting of pediatric growth. My interest was in making a number of engineering improvements to the program, to test it more extensively, and to determine whether it could function with a sensitivity and specificity comparable to that of a physician. One of the major drawbacks with applications of this type that are intended for medical use is the variability in people's bodies. The same symptoms and conditions can appear very different among patients. Thus, it is extremely difficult to clearly describe what patterns define each condition, and the program must allow uncertainty to allow for these
differences in patients. In addition, it is extremely important in medicine, more than in any other field, that the accuracy is comparable to experts. Diagnoses that are incorrect, or other diagnoses which are missed, may result in serious consequences for the patients.
1.3 Guide to Thesis
This thesis starts with an overview of TrenDx, the program that was developed by Haimowitz. The next chapter examines the particular application of TrenDx to pediatric growth and the methods used for Le's trial and this trial. The following section describes my contributions to the TrenDx program and the engineering improvements that were made. The results showing the performance of TrenDx in comparison with physicians,
an expert, and the diagnoses of the medical records are detailed in the next section. The result section includes an evaluation of the updated TrenDx with previously analyzed data and with newly collected data. Then, there is a general discussion of the conclusions and the potential of this program as compared to previously developed medical expert systems. Finally, the future work section describes what should be done next before TrenDx can be used clinically.
2.
TrenDx
2.1 Overview of TrenDx
Haimowitz designed TrenDx for automated medical trend detection for diagnostic monitoring. The program diagnoses patients by matching the data to trends that can be defined as "sequences of time-ordered data that together are clinically significant."[5] These trends may be multivariate and may consist of several distinct data phases.[1]
The input is data from a monitored process, and for this trial the input was pediatric patient data. TrenDx finds all possible ways in which that data may fit into the trend template intervals. For instance, if the input included height data for a girl aged 2.5 years, and the template said that a girl of that age could be either in early childhood or childhood-to-adulthood, then TrenDx would compute a separate context for each possible assignment of the data. The data is instantiated for each template in this manner, by
calculated for each possibility based on how well the data matches to the constraints within those intervals it has been assigned. The top hypotheses are trimmed and kept and TrenDx determines which hypothesis best describes the patient's condition. The program then outputs the most likely diagnosis and whether or not the patient should be triggered. The triggering of a patient can be defined for each situation in which TrenDx is being used. For instance, the triggering of a patient for this trial meant that it was likely the patient had a growth disorder and should be referred to a specialist.
To get a more complete detailed analysis of the original design and
implementation of TrenDx, refer to the theses of Ira Haimowitz [1] and Phillip Le [2]. The next section describes the different parts that make up TrenDx and enable it to diagnose conditions. This chapter describes the original development of TrenDx by Haimowitz and Le, and all of the aspects of the program that are described in this section have been kept in the new implementation.
2.2
Temporal Utility Package (TUP)
TrenDx is able to understand and process information with respect to time with the use of the Temporal Utility Package (TUP) developed by Isaac Kohane. TUP is composed of functions that enable TrenDx to store and reason about data. It has the ability to distinguish between times, tell how times differ with respect to each other, and model intervals with endpoints. With this package, TrenDx is able to handle temporal assertions and questions. One of the most important aspects of TUP is that it allows TrenDx to reason about temporal distances that have endpoints with definite time restrictions and intervals with uncertain endpoints. When there is uncertainty between
whether a certain time occurred before or after another one, TUP creates multiple
"temporal worlds" which represent each of the possible scenarios that the time points can fit into. [6]
2.3 Trend Templates
The trend templates are representations of variables within temporal patterns. TrenDx matches monitored data to these templates, which represent various possibilities common to the population. Each of the trend templates represents a different possible diagnosis of the patients within that population. The templates are made up of various patterns that include landmark events, temporal intervals that represent phases, and measurable value constraints assigned to the intervals. The templates must allow for uncertainty in both the temporal and value constraints.
The trend templates are grouped into monitor sets that represent clinical contexts. These templates are competing with each other as the possible diagnoses for each of the patients. Within each monitor set, there are "normal" templates and "abnormal"
templates. Patients who fall under the "abnormal" templates need to be referred to a doctor, while the "normal" templates represent patients who have non-serious conditions. Within the same monitor set, the same variables are measured and the same landmark points exist, but the trend templates are distinguished by different value and temporal constraints.
2.4 Constraints
TrenDx maintains two ways to constrain data, temporally and by value. The value constraints are functions which limit parameters, and they are used to fit models which are functions of time. The temporal constraints limit the value constraints to certain appropriate time intervals. Furthermore, both types of constraints allow uncertainty to help TrenDx achieve accurate diagnoses.
Temporal Constraints
The temporal constraints, which are represented by intervals with uncertain endpoints, restrict time points to be within intervals or establish temporal relationships between intervals. The intervals have "begin" and "end" points, which have offsets from either landmark points or other intervals' begin and end points. Furthermore, the
constraints allow minimum and maximum restrictions to be put on interval relationships. The temporal uncertainty of the endpoints allows TrenDx to optimize between different possible assignments of the data to the phases of the trends. For instance, the temporal intervals should contain uncertain endpoints and variable duration length to allow for differences among patients with the same condition.
An example of a temporal constraint is below and it is a subset of the temporal constraints from the trend template for average normal growth. The landmark events are birth and growth stops, while the intervals consist of early childhood and childhood-to-adulthood. The program uses two types of statements to represent temporal constraints:
" (x y min max)
In the first statement, x and y represent different landmark events or interval endpoints, while min and max are two numbers which represent the limits on the distance between x and y. In the second statement, intl and int2 are intervals, and the statement
declares that the int2 interval must follow directly after intl.
Temporal Constraint Example:
((begin early-childhood) birth 0 0)
((begin early-childhood) (end early-childhood) (years 2.05) (years 2.95)) (consecutive-phase early-childhood childhood-to-adulthood)
((end childhood-to-adulthood) growth-stops 0 0) (birth growth-stops (years 16.5) (years 18.5))
The above example is illustrated in graphic form: Early Childhood
Childhood-to-Adulthood
Birth.
0 5 10
Age (years) Figure 1: Temporal Constraint Example
15
* Growth Stops
20
Value Constraints
Within each of these temporal intervals, there are value constraints on functions of measurable parameters. The constraints consist of statistical models that describe what the assigned data should resemble. There is uncertainty in the value constraints that allows TrenDx to have enough variability, such that different processes with the same diagnosis may be matched to the same trend template. The constraint is composed of two main components. The first component is a function that maps the data to a sequence of numbers. It can be as simple as a function that returns the value of each time-stamped datum. The second component comes from a set of polynomial functions that can go up to 2nd order. The constant and 1" order polynomial functions have the option of
specifying the values and slopes of the function to be matched against the data. [2] Finally, each of the value constraints has a weight associated with it to signify the importance of TrenDx matching that constraint.
There are two value constraint examples below taken directly from the coding of the templates. As can be seen, with each new constraint that is defined, there is a name, function, parameters, model, and weight associated with the constraint.
Example Value Constraints
(defconstraint :name "constant build"
:func #bd-child-normal :parameters '(weight height) :model '(constant 1)
:weight 1)
Figure 2: Value Constraint - Constant Build
The above value constraint is from the Average Normal Growth template from the childhood-to-adulthood temporal interval. This constraint takes two parameters, height and weight, and calculates the build, which is equal to the ratio of the patient's weight to the weight for that height-age. The model describes a constant function with a value of 1.
(defconstraint :name "Chron Age -BA Increasing"
:func #'chron-age-minus-bone-age :parameters '(bone-age)
:model '(linear (Dl +)) :weight 5)
This constraint, from the Congenital Growth Hormone Deficiency template, is found in the childhood-to-adulthood temporal interval. It takes in one parameter, the bone-age of the patient, and uses the function that subtracts the bone age from the
chronological age. The model states that this value should be linear and increasing. This constraint has a weight of 5, signifying it is more important than other constraints.
2.5
Hypotheses
The data from the monitored process is instantiated for each of the templates and TrenDx computes all temporal worlds in which the current data may be assigned to time intervals in the trend template. Then TrenDx optimizes over alternate ways of assigning the data to the different phases of the templates using the value and temporal constraints. Each possible assignment of the data points within separate temporal worlds represents a different hypothesis within each trend template. For each of the competing trend
templates within the monitor set, there may be multiple hypotheses with the data assigned to different possible temporal intervals. Thus, the program can determine which of the trend templates contain the best hypothesis, but can also determine within that particular trend template the most probable assignment of the data to the temporal intervals.
2.6 Scoring and Conclusion Reaching
The score for each hypothesis is determined by comparing the models with the actual data and by then calculating either the mean absolute percent error or the residual mean square error. The mean absolute percentage error is a better measure since it is able to compare the goodness of fit when variables are on different scales. The reason for
keeping the residual mean square error is that the mean absolute percent error cannot be used when the expected value of the parameter is zero.
Residual Mean Square Error =
( It (Expectedt - Actualt)2 ) / Degrees of Freedom
Mean Absolute Percent Error =
( It I (Expectedt - Actualt)/Actualt I
)
/ Degrees of FreedomThe score describes how well the data within the hypothesis matches to the relevant value constraints within the temporal intervals. The lower the score, the better the match, and thus the more likely that hypothesis.
Figure 4: Error function
The above diagram illustrates the error function that was used. This function was chosen since it represents the way in which an expert or human subject would handle data comparisons. If the value is close to the middle, the error is really small, and as the value
moves away from the expected value the error increases, and at the boundaries the error is extremely large. This is smoother than an error function with definite thresholds that would be too sensitive near the boundaries.
Finally, the scores of the different hypotheses within each template are compared. The top hypotheses are trimmed with beam search, while still maintaining at least one hypothesis per template.
2.7
Triggering and Output
The referral is determined by comparing the scores for each of the hypotheses against threshold values. For a patient to be referred, the error scores for all of the templates that involve normal, or non-referral conditions, must be above this threshold. Remember, that the lower the error score the more likely the hypothesis, so if all the scores are above a threshold, it means they are all unlikely. In other words, if dealing with children's growth, average growth, early puberty, and constitutional delay are all conditions which children may have which do not necessitate a referral to a doctor. Thus, if those three conditions have scores greater than the threshold, than the children need to be referred to a specialist, since it is unlikely that they are normal.
There are two ways in which the normal scores can pass the threshold, after a single time point or after consecutive time points. After each new time point in which data is processed, the scores are calculated, and if the lowest of the normal scores is above the single-threshold then the patient is referred. Otherwise, if during two consecutive times, the lowest of the normal error scores is above the double-threshold, then the patient is referred. The combination of the two triggering methods is used to
reduce the brittle nature of thresholds, where a value just below the threshold would not trigger, while a value a little bit higher would trigger. [2]
The output of TrenDx includes information about whether the patient should be referred and a list of the most likely diagnoses with their error scores. TrenDx also
allows one to trace the hypotheses and scoring while processing a patient, allowing one to see how the data points matched to the trend templates.
3. Pediatric Growth
Very often, general pediatricians suffer from being too busy and having too much data to process and thus they don't have time to carefully examine a patient's cumulative record. Furthermore, some growth disorders can be very serious and many times may be either missed or misdiagnosed. Since it is possible to diagnose many growth disorders with only data about height and weight, this trial focused on testing TrenDx for pediatric growth. For a more detailed examination of pediatric growth and these conditions, see Le's thesis [2].
3.1 Trend Templates
This program was used to test pediatric growth and to see if TrenDx could distinguish between the following possible diagnoses:
* Average Normal Growth: This is the most common condition and is assumed unless another template prevails.
" Early Puberty: This is a benign condition for which pubertal onset is earlier and
the bones develop faster, yet the children will eventually reach normal growth and do not need a referral.
" Constitutional Delay: This is also a benign condition for which bones develop slower and pubertal onset is later. No referral is necessary for children with this condition.
* Congenital Growth Hormone Deficiency: These traits can be modeled since the children who suffer from this deficiency are significantly shorter and their skeletal and sexual delay is much later than even constitutional delay.
* Acquired Growth Hormone Deficiency: A child develops normally until they acquire this condition, at which point their growth significantly decelerates. * Short Bone Syndrome: These children are shorter than the children with growth
hormone deficiency, yet they have very little delay in bone age.
* Precocious Puberty: These children develop sexually very early and their bone age is more advanced in addition to them being taller on average.
* Obesity and Malnutrition: These conditions were included since children may be referred to clinics because of extreme weight problems.
3.2 Patients
Le obtained trial cases from patients referred to the Endocrine Division at the Boston Children's Hospital. The records were taken sequentially and then screened before being included. If the record did not contain at least three time points before the
date the patient was referred, then the case was excluded. Furthermore, the cases were screened out if the referral was within the past year since the final clinical diagnosis might not be available otherwise. Finally, cases of children with cancer were removed from the trial since the cancer may cause other growth problems. In addition, children diagnosed with cancer had their cases fully examined and studied, while this program is designed to diagnose patients when a physician does not have as much time to carefully examine a patient's records.
The population has a higher proportion of abnormal patients and normal patients that have some characteristics of abnormal patients, yet it was determined that this sample was a good starting point for the tests. Table 1 shows the breakdown of the patients by their medical record diagnoses.
Category Diagnosis Number
Normal Normal Growth, Early Puberty, Constitutional 50
Delay, Familial Short Stature
Normal-Other Referred for non-growth problems 18
Precocious Puberty Precocious Puberty 6
GH-Deficiency & Congenital Growth Hormone Deficiency, 11 Hypothyroidism Acquired GH Deficiency, Hypothyroidism
Complex Cases Multi-congenital abnormalities, Cancer 8 Short Bone/ Turner's Short Bone Syndrome, Turner's Syndrome 2 Table 1: Disorder breakdown of patients from Le's trials
3.3 Method
After the records were collected and screened, the data was transcribed to be used for TrenDx and to be distributed to human subjects for evaluation. Only the data that was available before the date the child was seen at the clinic was used. This is because TrenDx is designed to be used before a child is referred using only the data that a general pediatrician would gather. The human participants consisted of physicians, medical students, and a registered nurse. The human subjects were given 10 packets that each contained the same data as TrenDx was given in addition to containing a growth chart for each patient. The participants were asked to fill out 3 items per patient; whether or not they should be referred to a growth clinic, what the preliminary diagnosis of the patient is, and if they were to be referred, at what time point would they have referred the patient. Eighty packets were distributed in total yet only 22 subjects returned the packets and thus the number of evaluations per patient varies greatly. The recommendations of the
endocrinologist and the actual diagnoses from the medical records were used as the two gold standards for the trial.
4. TrenDx ImprOvements
4.1 Efficiency
When Ira Haimowitz and Phillip Le were testing TrenDx, the program was being run on an old Macintosh machine. On some patient cases, TrenDx ran extremely slowly, taking several hours to fully process the data. Now, that TrenDx has been rewritten in
Allegro Common Lisp for Windows and is being run on a much faster machine, the amount of time to process the patients has been greatly reduced. On average, it takes a few minutes to process a patient. Originally, I believed that significant algorithmic improvements in the program might be needed to make it more efficient and practical, yet improved computers have obviated that need.
Yet, some changes were made to improve the efficiency of the program. First, a method was added which would remove trivial hypotheses. Trivial hypotheses are defined as hypotheses in which all of the data points have trivial matches to the trend template data. A trivial match can occur when only one or two data points are assigned to each interval. For example, a possible value constraint might be that a parameter should remain constant at some unknown value. Thus, any value assigned to that interval would match the value constraint trivially since it would completely match the wildcard and produce an error of zero. Hypotheses are automatically pruned using beam search, yet if there are multiple hypotheses for a single trend template that only contains trivial matches, these were now also pruned. This would save time on successive iterations due to fewer hypotheses that would need to be matched and processed. This method would only remove trivial hypotheses when there are multiple hypotheses for a particular trend template. If the trivial hypothesis is the only one for that template, then it is not deleted from the system.
In addition, while Haimowitz and Le were running their tests, TrenDx would occasionally crash. This would happen for various reasons, such as when extreme values were given to TrenDx. The program was modified so that it would be more stable and after all the tests of Haimowitz and Le were repeated, TrenDx never crashed.
4.2 Accuracy
The post-processing elements of TrenDx were examined to see how to improve the accuracy of the program. TrenDx calculates scores based on a regression algorithm that matches the data to constraints for trend templates. Le noticed that TrenDx would occasionally trigger a referral based on the first non-zero error score, and that TrenDx did not realize the importance of the number of data points that it matched. Remember, that TrenDx triggers a referral based on comparing the lowest score from the normal
templates with threshold values. Thus, if the threshold values depended on how many data points that TrenDx matches, then the triggering would be based on how much data TrenDx has. Therefore, a multiplication factor was included for both the single threshold
and the double threshold. The factor would decrease as TrenDx matches more points. Thus, the higher the threshold, the harder it is to trigger a patient.
Numdatapoints = number of data points that TrenDx has matched for that patient
Factor = (2 + Nundata-points) / (Num datapoints)
Other changes were also made to the post-processing of TrenDx. If all the
templates had the same score, then TrenDx would consider that the program did not have enough information to make a diagnosis. It was decided that TrenDx should trigger a referral if there was not enough information and let the user know that is why a referral was triggered. Depending on the clinical setting in which TrenDx is used, and depending
on whether specificity or sensitivity is more important, then whether or not TrenDx triggers a referral with too little information can be modified.
4.3 Testing
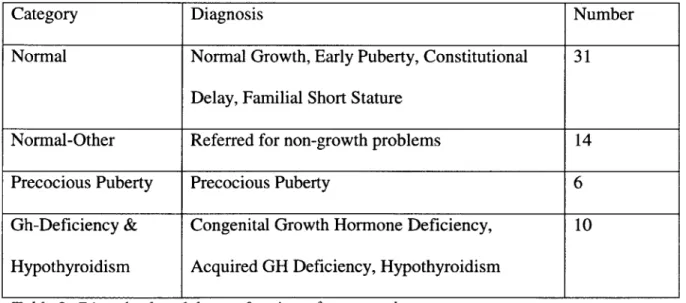
More pediatric patients records were obtained from the Endocrine Clinic at the Boston Children's Hospital. This was done so as to more precisely determine the performance of TrenDx. The specificity and sensitivity would be better calculated with more data and it would ensure that the improvements in TrenDx were not purely based on over-fitting the existing data. Again, the records were screened for the number of time points before the child was referred so that TrenDx would have at least some data to evaluate. Furthermore, the records were screened so that an accurate complete diagnosis was included with the medical record, in order that a gold standard could be determined. The breakdown of the sixty-one records by disorder is below.
Category Diagnosis Number
Normal Normal Growth, Early Puberty, Constitutional 31 Delay, Familial Short Stature
Normal-Other Referred for non-growth problems 14
Precocious Puberty Precocious Puberty 6
Gh-Deficiency & Congenital Growth Hormone Deficiency, 10 Hypothyroidism Acquired GH Deficiency, Hypothyroidism
Due to time constraints, the new records that were obtained only had the medical record gold standard, while the previously obtained records used both the expert and medical record gold standard.
5.
Results
Records from 95 patients from the Endocrine Clinic at Boston Children's Hospital were used to analyze the performance of TrenDx. These are the same patients from Le's trials, yet the results reflect the output of the newer updated version of TrenDx. The output of TrenDx was compared to a variety of sources including the diagnoses of the medical records, the recommendations of a pediatric endocrinologist, and the evaluations of physicians with a wide range of experiences and backgrounds.
Two basic metrics were used to determine the accuracy of the decisions, sensitivity and specificity. They were calculated using the following formulas:
" Sensitivity = (patient is abnormal and referred) / (total # of abnormal patients) " Specificity = (patient is normal and not referred) /
5.1 Medical Record Gold Standard
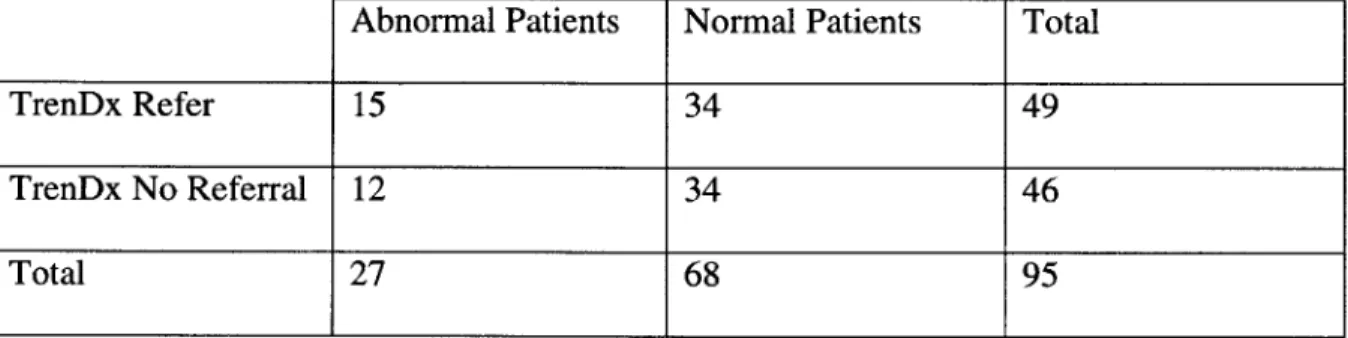
In the first analysis, the performances of the physicians and TrenDx were compared with the medical record diagnoses. Tables 3 and 4 show the results of the referrals of the physicians and TrenDx as compared with the patient records. The sensitivities and specificities of TrenDx and the physicians are close in value.
TrenDx vs. Medical Record Gold Standard
Abnormal Patients Normal Patients Total
TrenDx Refer 15 34 49
TrenDx No Referral 12 34 46
Total 27 68 95
Table 3: Referrals of TrenDx vs. Medical Record Diagnoses Sensitivity = 15/27 = 0.56
Specificity = 34/68 = 0.50
Physicians vs. Medical Record Gold Standard
Abnormal Patients Normal Patients Total
Physician Refer 35 75 110
Physician Not Refer 24 83 107
Total 59 158 217
Table 4: Referrals of Physicians vs. Medical Sensitivity = 35/59 = 0.59
Specificity = 83/158 = 0.53
The column total for the number of patients is not consistent between TrenDx and the physicians in Tables 3 and 4. This is because more than one human subject evaluated many of the patients and therefore each of these results is included in the table.
5.2
Decision Breakdown
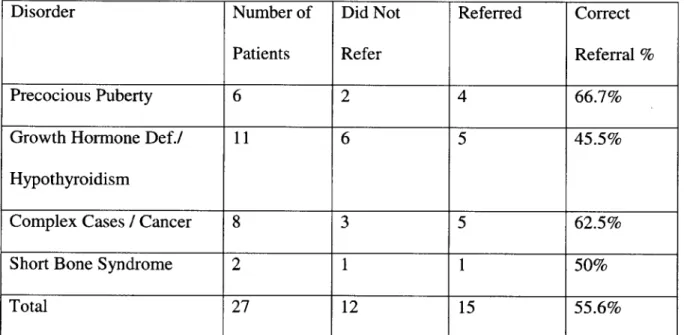
The results of the referral decisions were analyzed and the "abnormal" patients were broken down into the specific disorders. Both TrenDx and the physicians were generally consistent in referring patients across the different disorders, yet the sample size is too small to confirm this.
TrenDx vs. Medical Record Diagnosis
Disorder Number of Did Not Referred Correct
Patients Refer Referral %
Precocious Puberty 6 2 4 66.7%
Growth Hormone Def./ 11 6 5 45.5%
Hypothyroidism
Complex Cases / Cancer 8 3 5 62.5%
Short Bone Syndrome 2 1 1 50%
Total 27 12 15 55.6%
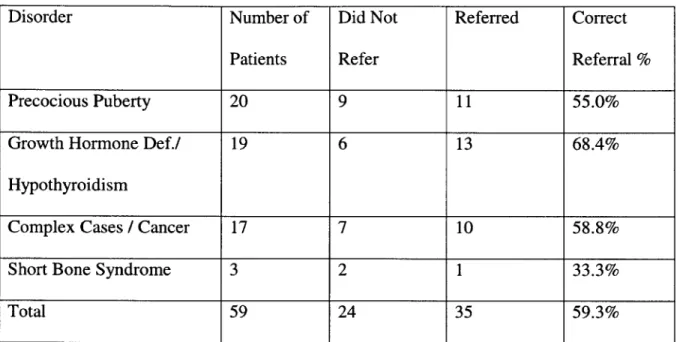
Physicians vs. Medical Record Diagnosis
Disorder Number of Did Not Referred Correct
Patients Refer Referral %
Precocious Puberty 20 9 11 55.0%
Growth Hormone Def./ 19 6 13 68.4%
Hypothyroidism
Complex Cases / Cancer 17 7 10 58.8%
Short Bone Syndrome 3 2 1 33.3%
Total 59 24 35 59.3%
Table 6: Disorder Breakdown of Physicians vs. Medical Record Diagnoses
Pediatric Endocrinologist Gold Standard
Another comparison analysis was done, this time between TrenDx and the physicians and the expert pediatric endocrinologist. The sensitivity and specificity for both cases improved over the comparisons with the medical record diagnoses.
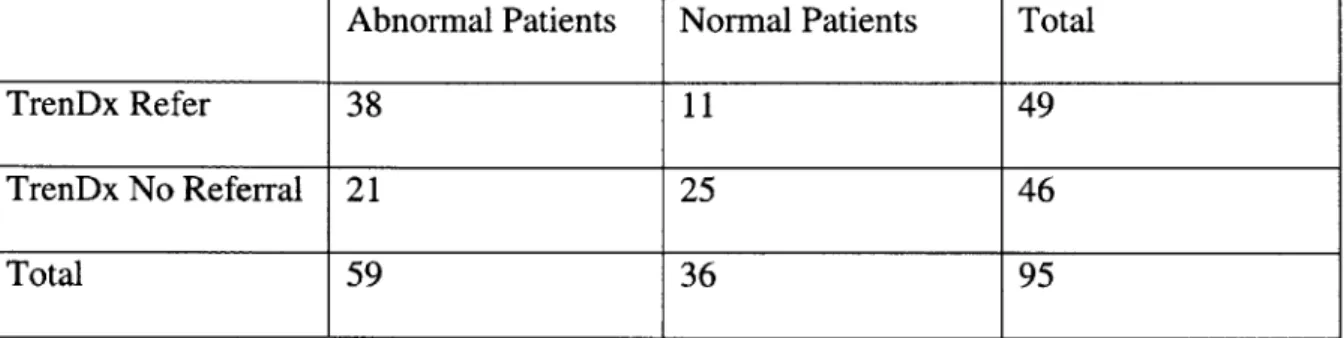
Abnormal Patients Normal Patients Total
TrenDx Refer 38 11 49
TrenDx No Referral 21 25 46
Total 59 36 95
Table 7: Referrals of TrenDx vs. Pediatric Endocrinologist Sensitivity = 38/59 = 0.64
Specificity = 25/36 = 0.69
Physicians vs. Expert Gold Standard
Expert Refer Expert Not Refer Total
Physician Refer 91 19 110
Physician Not Refer 51 56 107
Total 142 75 217
Table 8: Referrals of Physicians vs. Pediatric Endocrinologist Sensitivity = 91/142 = 0.64
Specificity = 56/75 = 0.75
5.3
Results of Changing Threshold Triggering Values
Due to the new scaling factors in the thresholds, it is hard to determine exactly what the mean and standard deviations are for the scores, since the patients have different amounts of data and time points. Le calculated the mean and standard deviation and set the single point triggering at 0.35, which was 2 standard deviations from the mean. The
consecutive triggering threshold was set at 0.31, approximately 1.5 standard deviations from the mean. [2] Remember that the new scaling factor, (2+numdata)/numdata, was added so that the triggering would be dependent on the amount of data that TrenDx had processed for each patient. With this new scaling factor, it was determined that the triggering values should be set at 0.33 for the single point triggering, and 0.29 for the consecutive threshold. These are the values of the thresholds before any multiplication factors. In other words, if for example TrenDx is processing the 20th data point for a particular patient, then the single point threshold would be equal to 0.33 * 20/18 = 0.367.
5.4
Lowering Thresholds
Then, testing was done to see the effects of lowering both thresholds by
approximately one half a standard deviation. The new single point threshold was set at 0.29 and the consecutive trigger at 0.25.
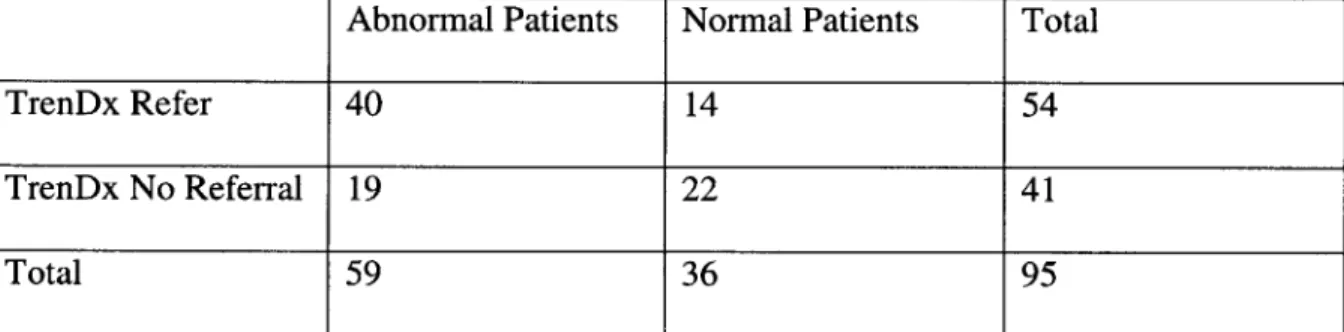
TrenDx vs. Expert Gold Standard (with Lowered Thresholds)
Abnormal Patients Normal Patients Total
TrenDx Refer 40 14 54
TrenDx No Referral 19 22 41
Total 59 36 95
Table 9: Referrals of TrenDx vs. Endocrinologist with Lowered Thresholds Sensitivity = 40/59 = 0.68
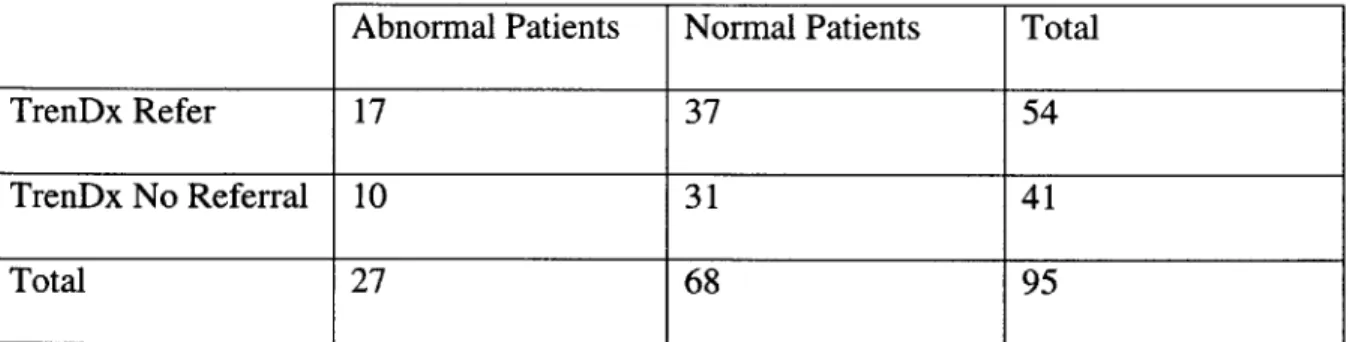
TrenDx vs. Medical Record Gold Standard (with Lowered Thresholds)
Abnormal Patients Normal Patients Total
TrenDx Refer 17 37 54
TrenDx No Referral 10 31 41
Total 27 68 95
Table JO:Referrals of TrenDx vs. Medical Record with Lowered Thresholds Sensitivity = 17/27 = 0.63
Specificity = 31/68 = 0.46
When using either the medical record or expert gold standard, with the lowered thresholds TrenDx referred 2 more patients who were abnormal, yet also referred 3 of the normal patients.
5.5
Raising Thresholds
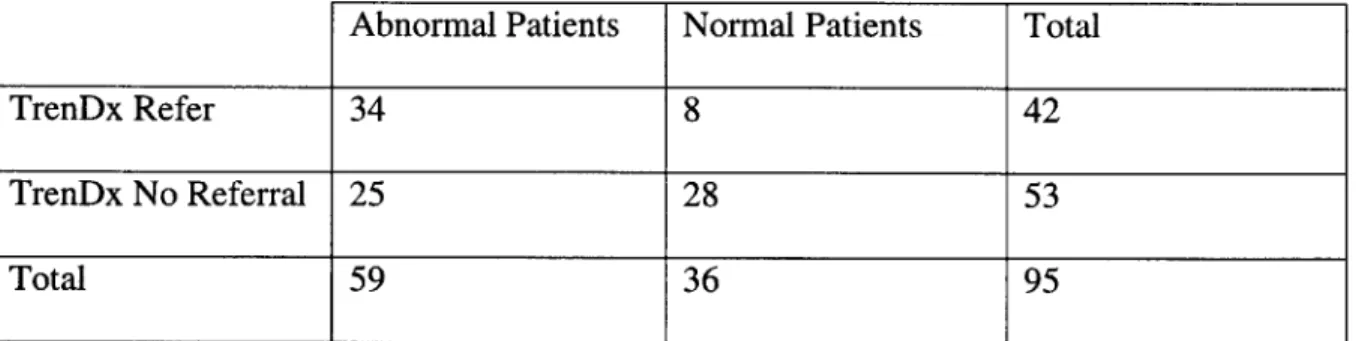
The thresholds were raised approximately one half a standard deviation to 0.36 and 0.33 for the single point and consecutive triggers.
Abnormal Patients
TrenDx Refer 34 8 42
TrenDx No Referral 25 28 53
Total 59 36 95
Table 11: Referrals of TrenDx vs. Endocrinologist with Raised Thresholds
Sensitivity = 34/59 = 0.58 Specificity = 28/36 = 0.78
With the pediatric endocrinologist gold standard, TrenDx missed referring 4 patients that were abnormal and needed to be referred, yet TrenDx correctly did not refer 3 of the normal patients.
TrenDx vs. Medical Record Gold Standard (with Raised Thresholds)
Abnormal Patients Normal Patients Total
TrenDx Refer 14 28 42
TrenDx No Referral 13 40 53
Total 27 68 95
Table 12: Referrals of TrenDx vs. Medical Record with Raised Thresholds Sensitivity = 14/27 = 0.52
Specificity = 40/68 = 0.59
With the medical record gold standard, TrenDx missed referring one of the abnormal patients, yet correctly did not refer 6 of the normal patients.
5.6
Changing Thresholds Summary
Obviously, increasing the threshold values will decrease sensitivity, and raise specificity, while lowering the threshold values will increase sensitivity and lower specificity. The user should set the appropriate threshold triggers depending on where TrenDx will be used and which of these metrics are more important.
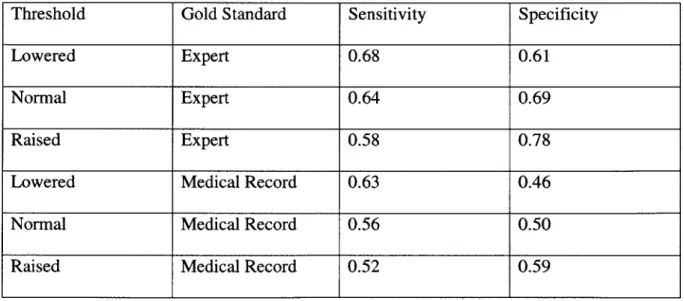
Changing Threshold Performance
Threshold Gold Standard Sensitivity Specificity
Lowered Expert 0.68 0.61
Normal Expert 0.64 0.69
Raised Expert 0.58 0.78
Lowered Medical Record 0.63 0.46
Normal Medical Record 0.56 0.50
Raised Medical Record 0.52 0.59
Table 13: Summary of Changing Threshold Values
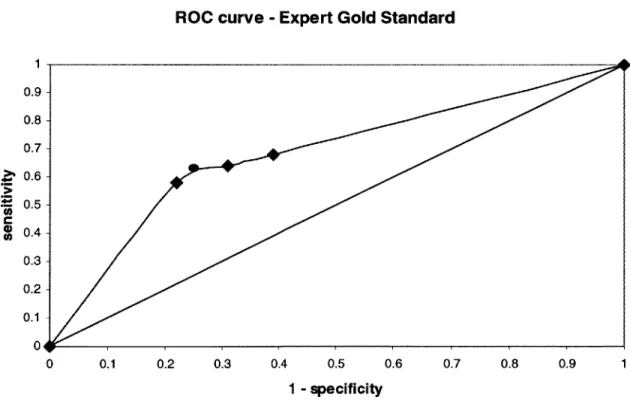
5.7 ROC Analysis
One common way to analyze data of this type is by using a Receiver Operating Characteristic (ROC) curve. An ROC curve is a graphical representation of the tradeoff
between the sensitivity and specificity for every threshold. The plot shows the (1-specificity) on the x-axis and the sensitivity on the y-axis. When the ROC curve climbs rapidly towards the upper left hand corner of the graph it signifies a better diagnostic test. When the curve follows a diagonal path from (0,0) to (1,1), this means that every
improvement in sensitivity is matched by a corresponding decrease in specificity, and thus not as promising a test. By measuring the area under the curve, it can be quantified how quickly the ROC curve rises to the upper left hand corner, and the larger the area, the better the diagnostic test.
As can be seen in figures 5 and 6, the ROC curves have been plotted for each of the gold standards. In addition, on each of the graphs there is an additional point that shows where the human subjects' specificity and sensitivity level would appear.
ROC curve - Expert Gold Standard
U) a) U) 1 -0.9 -0.8 -0.7 -0.6 -0.5 -0.4 - 0.3- 0.2-0.1 -0.1 0.2 0.3 0.4 0.5 1 - specificity 0.6 0.7 0.8 0.9 1 -W 0
ROC curve - Medical Record Gold Standard 0.9- 0.8- 0.7-0.6 0.5 C 0.4 0.3 0.2 0.1-0 0 0.1 0.2 0.3 0.4 0.5 0.6 0.7 0.8 0.9 1 1 - specificity
Figure 6: ROC Curve - Medical Record Gold Standard
The area under the ROC curve for the endocrinologist gold standard is approximately 68%. For the medical record gold standard, the area is approximately
55%.
5.8
Comparison of Gold Standards
Having used two separate gold standards, it was important to compare how they performed with respect to each other. Using the medical record diagnoses as the gold standard, the performance of the pediatric endocrinologists recommendations were examined.
Expert Decision vs. Medical Record Diagnosis
Abnormal Normal Total
Expert Refer 19 40 59
Expert Not Refer 8 28 36
Total 27 68 95
Table 14: Referrals of Endocrinologist vs. Medical Record
Sensitivity = 19/27 = 0.70 Specificity = 28/68 = 0.41
The expert decisions show a very high sensitivity, yet a very low specificity. As can be seen, the expert referred 59 patients, while the medical records said to refer only 27 of the patients. There is quite a significant discrepancy between the two gold standards.
Pediatric Endocrinologist Diagnosis vs. Medical Record Diagnosis
Disorder Number of Did Not Referred Correct
Patients Refer Referral %
Precocious Puberty 6 1 5 83.3%
Growth Hormone Def./ 11 3 8 72.7%
Hypothyroidism
Complex Cases / Cancer 8 2 6 75.0%
Short Bone Syndrome 2 2 0 0%
Total 27 8 19 70.4%
Table 15: Disorder Breakdown of Endocrinologist vs. Medical Record
The breakdown of the disorders shows that the expert correctly referred a very high percentage of the patients, though the endocrinologist missed all of the short bone syndrome cases.
5.9
Comparisons with Consensus Cases
There were only 95 patient records that were given to human subjects to evaluate. Of these 95, only 59 cases had more than one human subject evaluation, and in only 29 of those cases were the recommendations of all the participants equal. A comparison was done between these consensus cases and all other outputs.
Consensus Cases and Singular Decisions
Description Number of Patients
All Referred 4
All Did Not Refer 4
Expert Referred, all others did not refer 3 Medical Record referred, all others did not refer 2 Medical Record did not refer, all others did refer 10 TrenDx did not refer, all others did refer 1 TrenDx referred, all others did not refer 1
Split Decisions 4
Physician Singular Decision 0
Total Consensus Cases 29
Table 16: Breakdown of Consensus Cases and Singular Decisions
Thus, looking at the 29 cases in which there was a consensus among the human subjects, there were 3 singular decisions for the endocrinologist, 12 for the medical record, 2 for TrenDx, and no singular decisions by the human subjects.
When examining all 95 of these patients and looking at the abnormal patients, there were 3 cases in which the medical record indicated the patient was abnormal yet none of the other groups referred the patient. There was only 1 case in which the expert was the only one to refer the abnormal patient. There were 3 cases in which the medical record indicated the patient needed a referral and only one of the human subjects referred
the patient. Finally, there were 2 cases in which TrenDx was the only one to refer the abnormal patient.
5.10 New Data Analysis
New patient records were obtained from the Endocrine Clinic at the Boston Children's Hospital using the same screening method that Le used. This was done to ensure that the improvements in the performance of TrenDx were not purely the cause of over-fitting the existing data, but due to actual improvements in the program. A total of 61 records were obtained and TrenDx was used to process this data. Unfortunately, due to time constraints, an expert gold standard could not be obtained, so the following results are only based upon a medical record gold standard. The table below shows the results that were found using the new data.
TrenDx vs. Medical Record Gold Standard (with new data)
Abnormal Patients Normal Patients Total
TrenDx Refer 7 16 23
TrenDx No Referral 9 29 38
Total 16 45 61
Table 17: Referrals of TrenDx vs. Medical Record, with new data Sensitivity = 7/16 = 0.44
Results were also obtained to see the effects of changing threshold values on the new data. The thresholds were lowered by half a standard deviation to 0.29 and 0.25 for single point and consecutive triggering. Then TrenDx was run again with thresholds raised by half a standard deviation to 0.36 and 0.33 for single and consecutive triggering. The results are in the two tables below.
TrenDx vs. Medical Record Gold Standard (with new data and lowered thresholds)
Abnormal Patients Normal Patients Total
TrenDx Refer 11 25 36
TrenDx No Referral 5 20 25
Total 16 45 61
Table 18: Referrals of TrenDx vs. Medical Record, new data and lowered thresholds
Sensitivity = 11/16 = 0.69 Specificity = 20/45 = 0.44
TrenDx vs. Medical Record Gold Standard (with new data and raised thresholds)
Abnormal Patients Normal Patients Total
TrenDx Refer 5 11 16
TrenDx No Referral 11 34 45
Total 16 45 61
Table 19: Referrals of TrenDx vs. Medical Record, new data and raised thresholds Sensitivity = 5/16 = 0.22
As can be seen in the table below, there is a summary of the results of the new data when the threshold values were changed. The influence on the sensitivity and specificity by the threshold values is quite large with the new data. This can be partially attributed to the limited amount of data that was used for this analysis.
Summary of Changing Thresholds with New Data and Medical Record Gold Standard
Sensitivity Specificity
Lowered 0.69 0.44
Normal 0.44 0.64
Raised 0.22 0.76
Table 20: Summary of Changing Thresholds (new data)
An ROC curve was also constructed for the new data analysis with the changing thresholds. This figure shows the tradeoff between specificity and sensitivity that was obtained for the new data.
ROC Curve (New Data)
0.1 0.2 0.3 0.4 0.5 1-specificity
0.6 0.7 0.8 0.9 1
Figure 7: ROC Curve - New Data - Medical Record Gold Standard
The area under the ROC curve is approximately 55%, the same area that was under the ROC curve for the medical record gold standard when using the previously collected data.
These trials have demonstrated the potential for TrenDx to be used in a clinical setting for diagnosis of pediatric growth. In addition, with different templates TrenDx has potential in many other application domains. At this stage in development, the
1 0.9 0.8 0.7 0.6 0.5 0.4 0.3 0.2 0.1 0 CA U) 0
at this point, the accuracy of TrenDx is approaching the performance of physicians. Thus, it could start to be used in a clinical setting on a trial basis to see the usefulness of this program to doctors.
When considering TrenDx's performance, the comparison between the gold standards must be taken into account. The sensitivity and specificity of the pediatric endocrinologist was 0.70 and 0.41 when using the medical record gold standard. This specificity is extremely low since the expert referred 59 while the medical record diagnoses showed only 27 abnormal patients. The huge differences in these two standards must be taken into consideration and examined when determining the performance of TrenDx.
Important results to note are the consensus cases. These cases are the ones in which all of the human subjects made the same determination of referral. This occurred in only 29 of the 95 patient records that were examined. Of these 29 cases, TrenDx had only 2 singular decisions while the expert had 3 and the medical record showed 12
singular decisions. Thus, the output of TrenDx is matching in most cases the diagnosis of at least one of the following, medical record, pediatric endocrinologist, or the human subjects. Furthermore, there were 2 cases in which TrenDx was the only one to refer the abnormal patients, which is obviously a good result. Again, more testing must be done for these results to become more meaningful.
Threshold Changing Conclusions
Changing the thresholds by half a standard deviation in either direction produced the expected results. When the thresholds were lowered, two more patients who were
abnormal were referred, while three of the normal patients were referred. This raised the sensitivity so that TrenDx had a sensitivity of .04 more than the human subjects for both the medical record gold standard and the expert gold standard. Yet, it decreased the
specificity even more, so that TrenDx was significantly below the human subjects for this metric. Yet, if this program is being used as a referral program that is designed to catch children whose records would otherwise be missed, then the high sensitivity is important
and the thresholds should remain at this lower value.
When the thresholds were raised, the specificity was greatly increased. When using the pediatric endocrinologist gold standard, the specificity went to 0.78 from missing the referrals of 4 patients but not referring 3 of the normal patients. Since 4 patients were missed, the sensitivity dropped significantly to 0.58, which is 0.06 below the human subject's sensitivity. When using the medical record gold standard, TrenDx missed only one of the patients, but correctly did not refer 6 of the normal patients. This obviously led to a dramatic increase in specificity from 0.50 to 0.59. Yet, the sensitivity dropped to 0.52, which is 0.07 below the human subject's sensitivity for the same
standard. The raised thresholds should be used when specificity is important, such as for performing the task of screening patients. Overall, there are too few trials to definitively state where the thresholds should be set, and furthermore, this should depend on the setting in which TrenDx will be used.
New Data Conclusions
The results with the new data analysis were not as promising as would have been expected. Due to time constraints, only a limited amount of data could be collected and thus the analysis wasn't very extensive. In addition, it was unfortunate that the new data could only be compared to the medical record gold standard. The previous data analysis demonstrated that the output of TrenDx more closely matches the pediatric
endocrinologist's recommendations as opposed to the medical record diagnoses. Thus, it would have been helpful to determine if this would occur again with the new data.
The collection of new records had only 16 abnormal patients, and thus each misdiagnosis would greatly influence the sensitivity value. Yet, the 45 normal patients that were collected led to a significant analysis of the specificity levels of TrenDx. With the normal thresholds, the analysis with the previous data showed a sensitivity of 0.56 and specificity of 0.50. The new data analysis resulted in sensitivity and specificity of 0.44 and 0.64. Finally, the physicians' sensitivity and specificity with the medical record gold standard was 0.59 and 0.53. Again, since there were only 16 abnormal patients, it is hard to get a clear view of TrenDx's sensitivity levels. On the other hand, the 45 normal patients led to a decent sample size to examine the specificity levels. As can be seen, TrenDx has an amazing specificity level of 0.64, which is significantly above the physicians' specificity of 0.53 using the same gold standard. This result is extremely promising, though more patient records must be obtained before any conclusions can be made on either the specificity or sensitivity levels of TrenDx.
The threshold levels easily influenced the sensitivity and specificity. This can be greatly explained by noting the limited number of patient records. To more fully
determine the effects of the threshold levels when using the new data, more records would need to be obtained and analyzed.
6.1 Previous Research
Research and development of medical expert systems has become popular recently. As compared to other expert systems, medical systems run into many of the same problems in addition to having extra complications.
For any type of expert system, knowledge acquisition is a significant problem. This is also definitely true in the case of medical expert systems, including TrenDx. Many experts need to be consulted for gathering the medical information, and often there are conflicting beliefs among experts about certain diagnoses. For instance, when
examining the results for the consensus cases, it can be seen that the endocrinologist, medical record, and physicians rarely agreed. Furthermore, due to the nature of medicine, symptoms and diagnoses among patients contain great variation. In other words, the same disease may be exhibited in many different ways depending on the patient. Thus, the knowledge isn't as exact as say an expert system that calculates integrals where there is one clear-cut definite answer. The developers of the expert system MedLogica noticed these problems. MedLogica was a system that assisted physicians with medications. The developers believed that the problem of knowledge
acquisition "in the case of a medical [expert system] is even more intensive than in the case of a technical one."[7]
Another problem that medical expert systems exhibit more than other systems is that they "require comprehensive evaluation of their diagnostic accuracy at every stage of development. Without established evaluation methods, the usefulness of medical expert systems is limited." [8] This evaluation and verification of the accuracy of the diagnoses is extremely important in medical systems due to the complexities of the diagnoses in addition to the potential consequences of incorrect results. The evaluation must be
extensive before the system can be considered possible to use on a large scale in a clinical setting.
There are many diagnostic expert systems that have been developed and are now available commercially. The performance of four of these systems was tested with 105 patients to determine the strengths and drawbacks of these programs. "Iliad and Meditel use Bayesian logic, but they differ in the assignment of prior probabilities, in specific
decision rules, and in the use of expert judgment. Dxplain and QMR use non-Bayesian algorithms, but they incorporate semi-quantitative scales to express the probabilistic association of findings (signs and symptoms) with particular diagnoses, and they use these scales to derive a weighted assessment of the patients' combined signs and
symptoms." [9] As can be seen, there are many approaches to the medical expert systems to try to guarantee accuracy. Since, the successes of the above 4 systems were
approximately the same, it is not clear which approach leads to the best performance. There are many other medical expert systems that use a variety of methods to determine a diagnosis for the patients. Some use a rule-based system to process the data
and provide a conclusion. Yet, most symptoms in medicine are fuzzy concepts and thus having the ability to perform fuzzy matching of the input data when it doesn't match exactly with the expected result is necessary. Therefore, purely rule-based systems are not the best approach to medical expert systems.[10]
Bilevel alarm thresholds are used for detection in other medical expert systems. This detection methodology employs an upper and lower bound for which the monitored variable is not allowed to exceed. Unfortunately, this method has a high false alarm rate. This false alarm rate can be reduced with the increasing of threshold values, yet this will naturally cause the sensitivity to decrease.[3] Thus, TrenDx does not use a purely bilevel alarm threshold method.
Many systems use statistical models to describe patterns in their systems. TrenDx has an advantage over other statistical models since most models describe patterns after fixed time points, while TrenDx can detect trends that occur at any time point including points that are in different trends.
Research into medical expert systems is continuing, and different methodologies are being developed and tested. Extensive testing of the accuracy of these programs must be ensured before these programs are used clinically and doctors and patients trust their
output.
6.2 Applications
Overall, TrenDx could act as an intermediary between a pediatrician and a growth referral clinic. It could advise doctors on what actions they should take on referring a child. This could be useful in different ways, including:
" Screening Program in Clinic: For this task, a high specificity is important. TrenDx
could prevent referrals for children who are normal, or have a growth condition which would not necessitate a visit to a specialist. For instance, early puberty and
constitutional delay could often be mistakenly diagnosed as a more serious condition. If TrenDx diagnosed the children with these benign conditions, it could save an endocrinology clinic both time and money to see the patient.
* Referral Program in Clinic: For this task, a high sensitivity is important. TrenDx could help to catch children who have a disorder and would otherwise not have been referred. TrenDx could be set up so that it automatically ran on every patient's data, and thus help to catch the patients who may have been missed. For instance, TrenDx could catch those children who are misdiagnosed with early puberty or constitutional delay when the problem is something more serious.
" Diagnosis Program outside of Clinic: TrenDx has the potential to be used by non-physicians. For example, an insurance company may want to use this program to determine if they should allow a person to be referred to a clinic. Workers at insurance companies would very rarely have enough medical knowledge to decide this on their own, and thus this program could be useful to them.
TrenDx has the potential to be used in any one of the above situations or settings. Very often, general pediatricians are extremely busy and don't have time to carefully examine a patient to determine if a growth disorder exists. Furthermore, physicians can't
send children to specialists for tests all the time, since tests, such as hormonal disorder, are expensive and time-consuming.
Unlike other medical expert systems, TrenDx was used to simulate conditions that would be found at a primary care clinic. To do this, TrenDx was only given data that would normally be measured before a child went to a growth specialist. In other words, a general pediatrician may not measure pubertal stage and bone age, but instead may only record data on height and weight. Thus, TrenDx was only given this basic data,
obviously making it harder for the program to diagnose the conditions. For instance, it is very difficult to diagnose short bone syndrome or growth hormone deficiency without data on skeletal age and pubertal stage, yet TrenDx was run without including extra data for these parameters. This would allow TrenDx to be used in primary care clinics, as opposed to being used in an expert clinic where a program like this may not be as useful. This is one of the major advantages this program has over many other medical expert systems that are being used and developed.
6.3 Future Work
TrenDx performs well when compared with physicians, yet more extensive testing and improvements in the engineering of TrenDx must be performed before this program can be used in a clinical setting.
More extensive trials to test the performance of TrenDx should be undertaken. One possible area of improvement for the trials could be the selection of patients. All these records were chosen from patients that were referred to the Endocrine Clinic at the