BLADE ROW INTERACTION
EFFEUIS ON COMPRESOR MEASUREMENT
byTonghuo Shang
B.E., Beijing Institute of Aeronautics and Astronautics, (1985)
SUMMITED IN PARTIAL FULFILLMENT
OF THE REQUIREMENTS FOR THE DEGREE OF MASTER OF SCIENCE
IN AERONAUTICS AND ASTRONAUTICS
at the
MASSACHUSETTS INSTITUTE OF TECHNOLOGY
August 1989
SMassachusetts
Institute of Technology •It"
Signiture of Author
Certified by
Department of A onautic and Astronautics, August, 1989
1
Professor Alan H.
Epstein
Thesis Supervisor Department of Aeronautics and Astronautics • Accepted by
s
... Professor Harold Y. Wachman"• D• rth •rt Committee
'9
1989
WITHDR•A•/
M.I. T.
LWM, ~LI1BRARIESAero
I
-· I. _7 ~c~BLADE ROW INTERACTION
EFFECTS ON COMPRESSOR MEASUREMENTS by
Tonghuo Shang Abstract
The influence of blade row interaction on compressor performance was investigated by running an inviscid CFD code called UNSFLO on a 2-D section of a Low Aspect Ratio Fan stage. Proper simulation was verified by comparing CFD results with Laser Anemometry data. The potential influence of downstream stator periodically changes the rotor loading, resulting in a nonuniform time averged flow field in the rotor stator gap region. The spatial variation of time averaged total temperature can be upto 1.5 degrees kelvin both axially and circumferentially, if the gap between the rotor and stator is 20 % of the rotor axial chord. The effect of geometrical variation was parametrically studied. Results showed that the magnitude of spatial variation strongly depends on the size of the gap and pitch ratio. Both increasing the stator pitch and decreasing rotor stator gap will greatly increase the degree of spatial nonuniformity. Increasing the thickness of the downstream stator blade has the same effect It also showed that using Euler turbine equation to calculate total temperature around the stator leading edge plane can lead to serious errors. Because of the axial and tangential variation in temperature and pressure, locating temperature and pressure probes at different positions can result in an error of as much as 3% in adiabatic efficiency. Co-location of probes will eliminate this error and the spatial variation in efficiency is negligible because temperature and pressure changes in phase. The effect of the stator loading was also examined by varying the turning angle and appeared to be small.
Thesis Supervisor: Dr. Alan H. Epstein Title : Associate Professor of
ACKNOWLEDGEMENTS
The completion of this thesis would not have been possible without the advice, help and encouragement of many people.
First, I would like to express my respect and appreciation to my thesis advisor, Prof. Alan. H. Epstein for his supervision and encouragement His guidence has been essential in completing this thesis. I also wish to thank Prof. E M. Greitzer and Prof. M. B. Giles for many discussions and suggestions during the course of this research. Mr. Robert Haimes has been very helpful with the computer systems and in running UNSFLO.
The comraderie and cheering-up of Mr. Sasi Digavalli have made the long working hours look much shorter. The humor of Mr. Todd Barber added a sense of ease to the daily working.
Finally, I would like to express my deep appreciation to my family, especially my parents for their love and support through out my life. The love, patience and understanding my wife shown while pursuing her degree will never be forgotten.
This research was supported by Textron Lycoming, under the supervision of Dr. A. K. Sehra.
Table of Contents
ABSTRACT ACKNOWLEDGEMENTS TABLE OF CONTENTS LIST OF TABLES LIST OF FIGURES CHAPTER 1 INTRODUCTION ... 1 CHAPTER 2 CALCULATIONAL PROCEDURE AND TEST COMPRESSOR ... 42.1 Calculational procedure ... 4
2.2 Test compressor ... 5
2.3 Design point calculation and verification of the code ... 7
CHAPTER 3 SPATIAL VARIATION OF TOTAL TEMPERATURE AND TOTAL PRESSURE ... 11
3.1 Introduction ... 11
3.2 The Unsteady flow field ... 12
3.3 Temporal averaging ... 13
3.4 Euler turbine equation ... 14
3.5 Spatial variation of time averaged total temperature and pressure ... 16
3.6 Effects of geometrical variations ... 21
3.7 Effect of stator loading ... 22
3.8 Effect of stator thickness ... 23
CHAPTER 4 IMPLICATIONS OF BLADE ROW INTERACTION ON MEASUREMENT AND DESIGN ... 27
4.1 Probe placement ... 27
4.2 Losses and design ... 28
CHAPTER 5 CONCLUSION AND RECOMMENDATIONS ... 31
5.1 Conclusions ... 31
5.2 Recommendations ... 32
REFERENCES ... 34 TABLES and FIGURES
List of Tables
Table 2.1 Summary of the 2-D stage geometryTable 2.2 Flow parameters at the inlet and outlet of the rotor and stator as measured by NASA Lewis Research Center [141
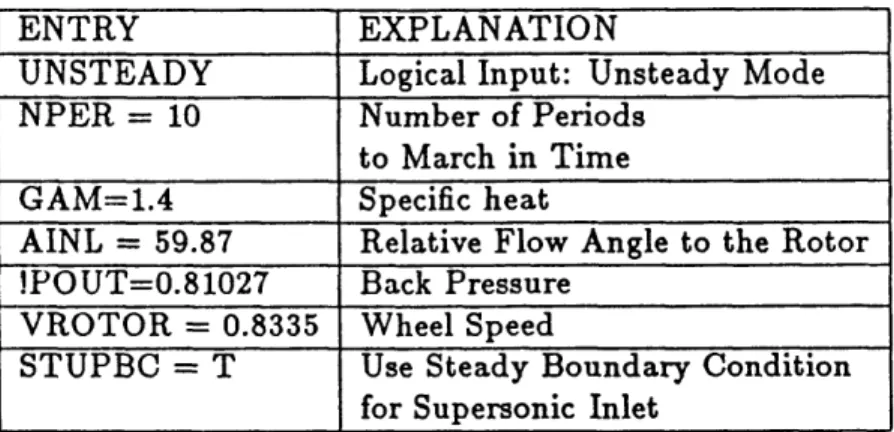
Table 2.3 Input entries for UNSFLO calculation
Table 2.4 Comparison of calculated and measured performance through the 2-D stage
List of Figures
Fig. 2.1 Flow path of NASA stage 67
Fig. 2.2 The streamtube thickness as a function of axial position used in the quasi-3D calculation
Fig. 2.3 The planar view of the simulated 2-D stage configuration
Fig. 2.4 Computational grid used in the design point simulation.
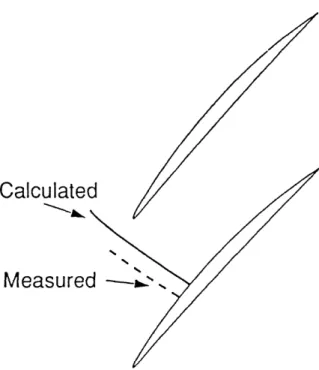
Fig. 2.5 Comparison of measured and calculated shock positions
Fig. 2.6 Density contour plot at design point calculation at one instant of time.
Fig. 2.7 Surface Mach number on the two rotor and three stator blades
Fig. 2.8 Blade to blade view of LA measurement locations within the stator passage at 50% span location.
Fig. 2.9 Comparison of measured and calculated time averaged temperature estimated with Euler turbine equation, as a function of
pitchwise position. Shown are the perturbation from pitchwise average value.
Fig. 2.10 Comparison of measured and calculated time averaged axial velocity distribution. U is the local time averaged axial velocity; U is the pitchwise average of U.
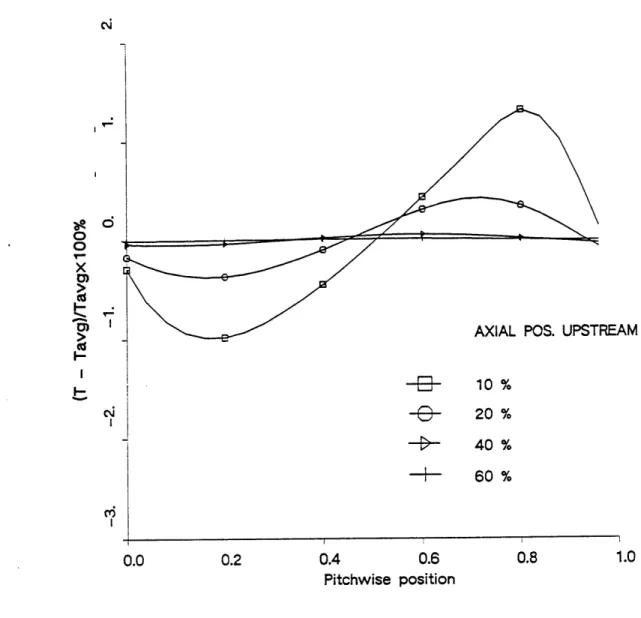
Fig. 3.1 Time averaged total temperature as read by a conventional probe at three axial locations upstream of the stator, due to wake stator interaction.
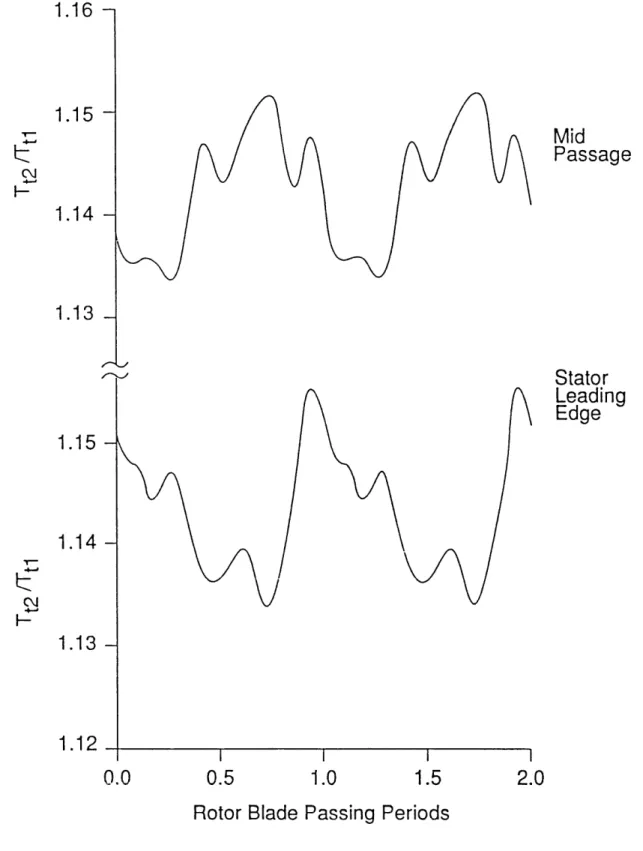
Fig. 3.2 Instantaneous total temperature as would be measured at two pitchwise locations at mid rotor stator gap.
Fig. 3.3 The difference between time and mass averaged total temperature
15% upstream of the stator. Gap: 20%; Pitch ratio: 1.45.
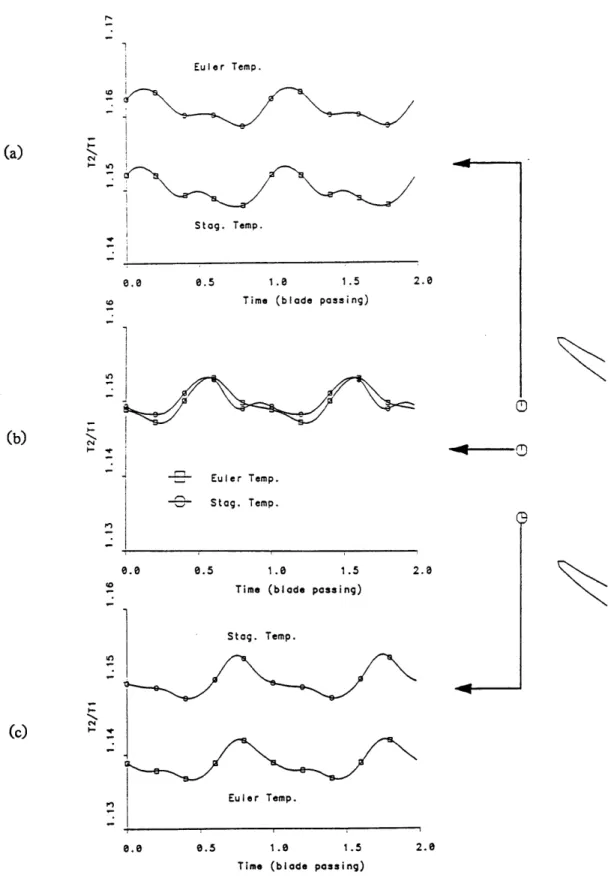
Fig. 3.4 Instantaneous Euler temperature at three pitchwise locations. a). Below the stator leading edge
b>. Mid-Passage
c) Above the stator leading edge
Fig. 3.5 Pitchwise Euler temperature distribution at four axial stations
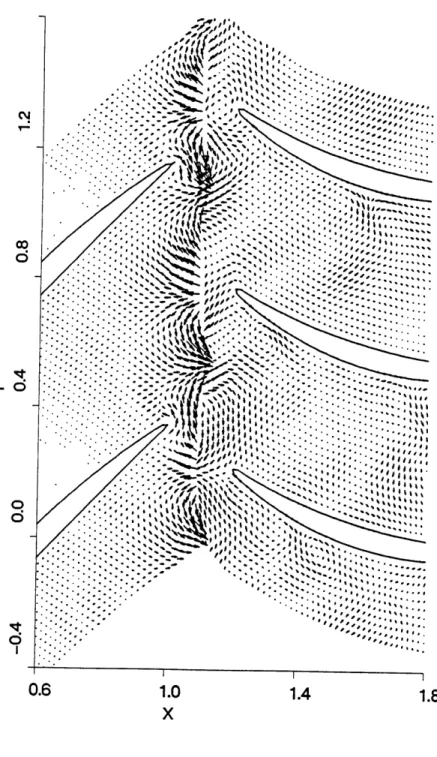
Fig. 3.6 Unsteady component of the velocity vector (V - Vavg), in the frame relative the rotor or stator, whichever applies.
Fig. 3.7 Pitchwise distribution of time averaged stage temperature and pressure ratio at two axial locations (as percentage of the
stator axial chord). The rotor-stator gap is 0.2 and the rotor-stator pitch ratio is 1.45
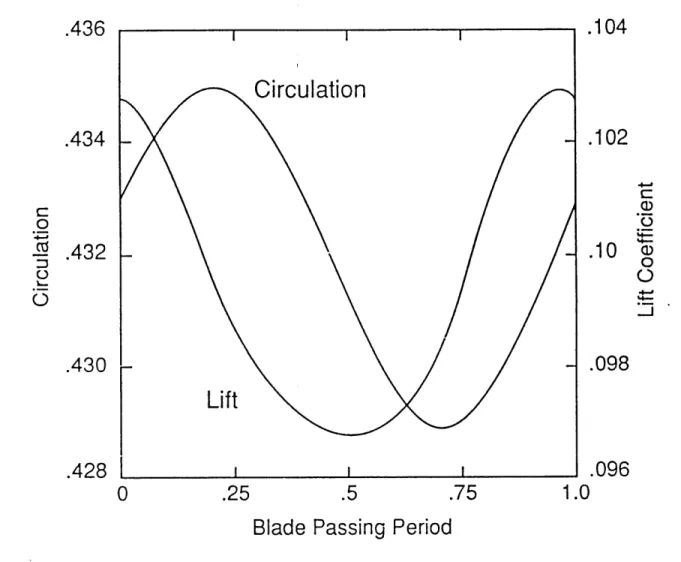
Fig. 3.8 Variation of rotor blade circulation and lift as a function of
blade passing period (time required to traverse one stator pitch)
Fig. 3.9 Pitchwise vorticity distribution at one instant in time illustrating the magnitude of the shed vorticity perturbation.
Fig. 3.10 Pitchwise enthalpy distribution as calculated by UNSFLO,
Eq. 3.5, and using Horlock's methods
Fig. 3.11 Contour plot of time averaged total temperature in the stator passage. Gap size: 20%; Pitch ratio: 1.45.
Fig. 3.12 Demonstration of Eq. 3.5. Symbols represent different
Fig. 3.13 Unsteady circulation on the stator blade in the wake/stator interaction calculation
Fig. 3.14 The effect of rotor stator spacing on the normalized, time averaged rotor temperature rise as would be measured at different pitchwise positions
Fig. 3.15 The effect of rotor stator pitch ratio on the normalized, time averaged rotor temperature rise as would be measured at different pitchwise positions
Fig. 3.16 Blade thickness distribution used in generating new stator blades of different turning angle. Data and curve fit.
Fig. 3.17 Construction of Double Arc Mean Line for Stator blades.
Fig. 3.18 Three stator blades with different turning.
Fig. 3.19 Influence of stator loading on rotor outflow pitchwise temperature distribution
Fig. 3.20 Contour Plot of Instantaneous Total Temperature in the Rotor-Strut Interaction Calculation.
Fig. 3.21 Pitchwise Variation of Time-Averaged Total Temperature and the Corresponding Contour Plot in the Strut Passage.
Fig. 4.1 Adiabatic efficiency deviation from the pitchwise mean for the flow in Figs. 3.7 at two axial stations upstream of the stator leading edge.
Fig. 4.2 Variation of measured efficiency as the probe moves along the the absolute streamline in the mid-passage of the stator.
Fig. 4.3 Deviation of adiabatic efficiency calculated from temperature and pressure which are measured at different pitchwise locations
Chapter 1
Introduction
Aerodynamic performance measurements are the most basic of turbomachinery tools, required for research, design verification and development This is usually average total pressure and temperature measurements made of the machine inflow and outflow to deduce work and efficiency. Measurements at a downstream plenum can give accurate results, but is sometimes infeasible. For instance, in a compressor of an engine where compressor exit flow enters the combustion chamber before significant mixing occur. Also, interstage measurements must be made in multistage compressors to estimate the performance of each individual stage, and for proper matching. Under all this circumstances, accurate measurement is essential in the highly unsteady and spatially nonuniform flow.
There are all kinds of possible errors in interpreting interstage measurements, from probe response characteristics (does the probe read the correct quantity) [1]; to proper averaging technique (area average, mass average or thrust average)[2] If we assume an ideal time averaging probe, then the issue becomes collecting an array of data (pitchwise) to such an extent that the flowfield is adequately represented by this set of data. This requires rakes of probes, or circumferential traversing of the probe, which is mostly not done due to blockage, access, or cost reasons. Sometimes probes
are placed within the blade row, or even within the blade, like the leading edge of the stator. In this case, the accuracy is dependent upon the degree of spatial uniformity and the location of the probe.
We know that the stator tends to collect wakes from upstream rotor, resulting in the spatial nonuniformity of total temperature at the stator exit This is also true for the rotor collecting wakes from inlet guide vanes(IGV). By studying the physics of wake tranport mechnism, one can evaluate the magnitude and distribution of this spatial variation and thus offer guidelines about probe placement and/or data "correction" for measurements [3,41
Potential interaction of adjencent blade rows can also result in spatial variation of total pressure, thus affecting the accuracy of stage performance measurements. Through an incompressible analysis, Horlock and Daneshar showed that the time averaged total pressure variation behind the rotor is the result of potential interaction between the rotor and upstream or downstream blades which change the rotor loading periodically [51 Zierke and Okiishi measured this variation in a low speed compressor [61 The magnitude of this variation was up to 15 percent of the stage total pressure increase.
The goal of this investigation is to understand how blade row interaction affects measurements in high speed compressors; quantitatively assess the spatial variation induced; parametrically examine the effect of geometrical variation (rotor stator gap and pitch ratio, for example); and finally offer guideline for probe placement or data correction to minimize the error in turbomachinery measurements.
3
Chapter 2 will give a brief description of the CFD code and the compressor used in this research effort The fidelity of CFD simulation will also be addressed. Chapter 3 details the spatial variation of total pressure and total temperature for different situations. Impact on measurement will be discussed in Chapter 4. The final conclusion will be drawn in Chapter 5.
Chapter 2
Calculational Procedure and Test Compressor
2.1 Calculational Procedure
The results reported hereafter were obtained by running a CFD code, known as UNSFLO. Using an explicit Lax-Wendroff scheme (similar to Ni's method), UNSFLO solves the 2-D unsteady inviscid equations of fluid motion on an unstructured grid composed of quadrilateral and/or triangular cells. A complete documentation of UNSFLO can be found in [71
One of the novel features of UNSFLO is its ability to handle arbitrary rotor/stator pitch ratio by performing the calculation on a time inclined computational domain. For the current investigation, the pitch ratio UNSFLO handles with single rotor stator passages is about 1.6, which is very close to the physical value of the test compressor (1.55). In case the pitch ratio is higher, calculations on two rotor and three stator passages are required so that the pitch ratio of the rotor stator grids falls within the limit Both of the two approaches above are used in this investigation according to specific situations.
A quasi-3D extension of UNSFLO offers the user an option to specify the varying streamtube thickness in the third dimension (referred to as hade). In this case the original 2D Euler equations are modified to account for this
effect[7] All the results presented in this thesis are calculated with this option. This makes comparison with experimental results more realistic.
UNSFLO can, of course, calculate steady state solutions by using the local maximum time step. The procedure of calculating rotor/stator interaction is as follows[8J First, grids and steady solutions need to be calculated for the rotor and stator separately. If multiple blade passages are required, corresponding grid and solutions are produced. Grid and initial solutions for the stage (rotor and stator) are formed by combining the rotor and stator together. Next, UNSFLO is used to get the steady solution for the coupled stage to insure proper matching. After this solution is converged, UNSFLO is used again to calculate the unsteady flow field of rotor/stator interaction. Finally, the Fourier components of the flowfield is stored for post data analysis.
2.2 Test Compressor
The compressor chosen for this study is a Low-Aspect-Ratio, single stage, transonic axial flow fan designed at the NASA Lewis Research Center in the 70's [91 known as stage 67. Its aspect ratio is 1.56. The hub-to-tip radius ratio at the inlet is 0.375. It has a angular speed of 1680 rad/sec (16042.8 RPM). At design speed the stage achieved an adiabatic efficiency of 90.6% with a pressure ratio of 1.686. The rotor tip Mach number is 1.38. The blade numbers of rotor and stator are 22 and 34.
The primary reason to use this machine is that large amount of data is available for it This includes Laser Anemometry data for both the rotor[10] and the stator[11], High frequency time resolved interstage flow
measurements[12] as well as a number of 2-D and 3-D, inviscid or viscous calculations on this geometry[131
The flow path of this stage is shown in Fig. 2.1. Also shown are the radial position of a 2-D unsteady viscous calculation on the rotor [13], radial locations of high frequency response measurements [12] and the side view of the Laser anemometry survey points[11. The meridional projection of the blade sections, which are defined on curved rotating surfaces, are drawn as dashed curves from leading to trailing edges on the blade. The steamtude thickness of the stage (hade), used in this quasi 3-D calculation, is plotted in Fig. 2.2.
The blade geometry at 50% span are used in this investigation. These are the eighth and sixth sections of the rotor and stator, shown as solid lines across the blade, Fig. 2.1. The streamline calculated from the streamline curvature design program indicates the radial position of this 2-D simulation. This location is slightly above the sonic line, so the incoming flow relative to the rotor is supersonic, Fig. 2.3 is the planar view of this simulated 2-D stage configuration. Station numbers are defined in the conventional way, with 1, 2 and 3 representing the inlet, rotor stator gap and exit of the stage. Table 2.1 summarizes the geometrical information. The rotor stator pitch ratio is 1.55, and the gap is 77.7% of the rotor axial chord. The flow parameters at stations entering and exiting the blades are listed in Table 2.2 [141 which are used to calculate the necessary inputs of UNSFLO. Besides the fact that there are extensive experimental and calculational work done around this region, this radial location is mostly close to a two dimensional flow. This minimizes the artifact due to a 2-D approximation and facilitates a direct comparison between the code result and data.
2.3 Design Point Calculation and Verification of the Code
UNSFLO was quantitatively validated to give accurate results in an unsteady wake-rotor interaction calculation, with a sinusoidal wake of small velocity defect (5%) passing a cascade of flat plates. By comparison with a linearized theory, UNSFLO results are in excellent agreement within 1%, provided that a sufficiently fine grid was used [151. Calculations on turbine blades using UNSFLO also show reasonable results[15,16] but not quantitatively verified due to the lack of data. Besides, UNSFLO had not been previously used for high speed compressors. Therefore, it was thought important to verify the calculation by comparing with experimental data.
The calculation was carried out on the blade section described in section 2.2. Fig. 2.4 shows the final grid used in this calculation. The rotor grid has axial and tangential grid points of 140 and 60. While the stator grid has 120 and 60 grid points in axial and tangential direction. The resulting geometry is slightly altered due to the absence of the trailing edge circle for an inviscid calculation while without modifying the geometrical input The rotor stator pitch ratio is 1.45 instead of 1.55. However, it was thought that this will not change the flow substantially.
Roughly 10,000 iterations are needed to get an steady solution and an equal number required to achieve unsteady periodicity ( 30 blade passing periods). Other cases reported hereafter require about the same amount of CPU time. This is 10 hours on a three-processor Alliant FX/8 mini-super computer, or 6 hours on Stellar, or 90 hours on a DEC microVAX III ( all three
are used at different times for different cases).
The required inputs for UNSFLO calculations are inlet relative flow angle for the rotor, wheel speed and back pressure at the exit of the stator. All in the proper nondimentional form required by UNSFLO. These are tabulated in Table 2.3.
The wheel speed and back pressure are inferred from NASA aero survey data, Table 2.2 [141 However, the inlet flow angle into the rotor turned out to be a critical choice. The shock position is very sensitive to this quantity. Because the shock structure is the vary basic feature of the flow field and is the only explicit source of loss for an inviscid calculation, the relative flow angle was determined on a trial-and-error basis so that the calculated shock position almost matches that inferred from Laser Anemometry measurements [10], shown in Fig. 2.5.
It is important to point out that this process is very expensive and the shock position is different from steady and unsteady solutions, although the inputs are the same. To reduce computation cost, other calculations are done using the same inputs used in this case regardless of the shock structure in the resulting flow.
Fig. 2.6 is a contour plot of density at one instant of time, clearly showing the expansion and compression in the rotor passage. Surface Mach number on the two rotor and the three stator blades are plotted against the axial position of the blade surfaces Fig. 2.7. Two observations can be made here. First the position and strength of the shock on the suction side are indicated. The
normal Mach number before the shock is about 1.35, which means that the shock is a relatively strong one. This number is also very close to the peak suction side Mach number estimated by NASA [141. Second, the Mach number of the two rotor blades are exactly the same although they are in different positions relative to the stator Fig. 2.4, showing that the rotor blades do not experience the unsteadiness generated by the stator because of the large gap in between. However, the stator blades behave unsteadily because of the nonuniform flow at the exit of the rotor.
Table 2.4 compares the calculated and measured values of the specific flow (mass flow per unit area) and the stage pressure and temperature ratio at the stage exit along the selected streamline at the design point condition, shown in Fig. 2.1. These are quite close for an inviscid calculation.
As mentioned before, the purpose of this research is to evaluate the spatial variation of time averaged quantities (such as total pressure and temperature ), due to the effect of blade row interaction. The accuracy of this relies on how well the CFD code modelles the spatial distribution of the flow field. This can be assessed by comparing calculational results with the available laser anemometry data taken in the stator passage[111.
Fig. 2.8 shows the stator blade to blade view of Laser Anemometry measurement locations on the 50% span measurement surface. At each measurement location the axial and tangential velocity are stored for 50 different rotor stator relative positions, which completes one rotor passing period. Comparison was made between calculated and measured circumferential variation of time averaged total temperature calculated from
Euler turbine equation at a station 10% chord upstream of the stator, Fig. 2.9. This station is as given in Fig. 2.8. Comparison of axial velocities at the same location was also made in Fig. 2.10. The agreement is satisfactory.
However, insufficient resolution at the leading edge of the stator results in numerical error. This error is confined within the region around the leading edge, which is no more than 10% of the stator axial chord. It is believed that this will not contaminate the rest of the flowfield substantially.
We conclude from the above argument that the inviscid calculation captures the essential feature of the flow, giving an adequate picture of the spatial distribution of the compressor flow field.
Chapter 3
Spatial Variation of
Total Temperature And Total Pressure
31 IntroductionEfficiency is probably the most important criterion used in judging the performance of a compressor. Therefore every effort has been made to increase its value and the accuracy of its evaluation. Since modern compressors are built to have an efficiency of more than 90 percent, any small change can be crucial and difficult to achieve, down to a quarter of one percentage point For a compressor stage with a temperature ratio of 1.16, the error of temperature measurement should be kept within the range of one tenth of one degree Kelvin. Probe placement can be important if the magnitude of the spatial variation of total temperature is higher than that value. Variation at the exit of a stator blade row due to wake transport can be as high as 20 degrees Kelvin [41 far more than the threshold suggested by the efficiency requirement
Even though wake transport is the mechanism of nonuniform stator exit flow, it is not responsible for any total temperature variation upstream of the stator, if an IGV does not exist in front of the rotor. Fig 3.1 shows the simulated total temperature probe reading (time average) before the stator at 3 different axial locations. This calculation was carried out by running UNSFLO.
The incoming wake has a total temperature variation of 12 degrees Kelvin. Except the overshoot at the leading edge because of the numerical error mentioned in Section 2.3, there is hardly any change in total temperature reading. However, variation of more than several degrees has been measured in compressors with closely spaced rotor and stators, at different probe locations [171 This is definitely not explained by the precision of instrumentation.
It was thought that the potential interaction between the rotor and stator may be responsible for this discrepancy. As mentioned before, the compressor described in Section 2.2 certainly does not have any blade row interaction effect due to the big rotor stator spacing. Therefore, we intentionally closed the gap so that this phenomenon could be investigated.
Before presenting the calculational results, we should define a few things which will be used hereafter. By spatial variation we mean time averaged total temperature and pressure and other flow quantities unless explained otherwise. Axial distance is expressed in percentage of the stator axial chord, with the leading edge as zero reference and downstream as the positive direction. Circumferential distance is normalized by the stator pitch, also with zero position fixed at the leading edge, and positive as the inverse of the rotor rotating, i.e. upward in Fig. 2.3.
3.2 The Unsteady Flow Field
High frequency, time resolved measurement is very useful in understanding the flowfield and loss mechnisms [181. This depends on the
interpretation of waveform of the measured quantity. This waveform is influenced by the interaction as well. Fig. 3.2 illustrates the instantaneous total temperature ratio at two different locations, stator leading edge and mid-passage for a calculation with 20% gap and pitch ratio of 1.45. Besides the difference of the mean value, the time resolved detail is different as well. This may introduce a small error by conventional averaging probes [11
3.3 Temporal Averaging
Compressor performance estimate requires the measurement of a time-weighted average pressure and temperature, used for efficiency evaluation. Mass averaging is preferred in this regard, because it is a direct indication of energy flux, a prerequisite for energy balance.
Even though mass averaging is favored theoretically, most temperature sensors will attempt to provide a time averaged value. Sometimes the measurement goes between time and mass average, bias to either one depending on the probe design and flow conditions [191. The determination of an average value is not straight forward in strongly fluctuating flows [11
The difference between time and mass averaged total temperature is plotted against pitchwise positions in Fig. 3.3. The comparison was made 15% upstream of the stator from a calculation with 20% gap and pitch ratio of
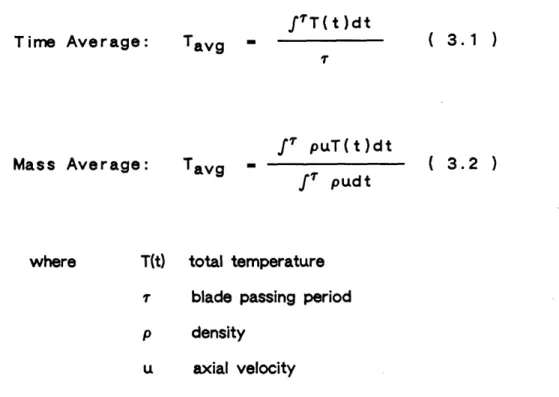
Time Average: Mass Average:
f'T(t)dt
Tavg - ( 3.1 ) f" puT(t)dt Tavg - ( 3.2 ) f7 pudtwhere T(t) total temperature 7 blade passing period
p density
u axial velocity
The difference is negligibly small. The reason may be that the axial velocity changes very little due to the absence of a viscous wake. Hence the mass weighted average is almost the same as the simple average (time average). For this reason and for simplicity, only time average will be discussed later.
3.4 Euler Turbine Equation
Fig. 2.9 shows Euler temperatures from both CFD calculation and Laser Anemometry measurements by using the Euler turbine equation
CpAT - wR(V2 - V 1) ( 3.3 )
where Cp specific heat
AT total temperature change across the rotor blade and
<oR wheel speed V tangential velocity
1 and 2 indicating before and after the blade
For the stage simulated (Fig. 2.3), the temperature after the rotor is 334 degrees Kelvin. This means a pitchwise variation of more than six degrees Kelvin would be expected at that axial location in Fig. 2.8. This seemingly big variation does not necessarily represent the local stagnation temperature change.
There are two basic presumptions about the validity of Euler turbine equation; first, the flow is assumed to be steady in rotor relative frame; second, there is no energy transfer of any kind between streamtubes in that relative frame. As long as these conditions are met, Euler temperature and the stagnation temperature will be identical.
In fact, the use of Euler turbine equation in Fig. 2.9 is not valid. In the rotor relative frame, the flow is very much unsteady at the location where the comparison was made, Fig. 2.8, due to the relative upward motion of the stator. The Euler temperature at three different circumferential locations, corresponding to the maximum, mean and minimum value positions in Fig. 2.9, are shown in Figs. 3.4 (a),(b) and (c). The Euler temperature can be higher or lower, according to different velocity probe positions, than the actual stagnation temperature, which does not change pitchwise in this calculation. The reason is as follows. The stator alters the flow field at the leading edge plane. The tangential velocity, thus the measured Euler temperature, is increased at points below the leading edge, or decreased at points above the
leading edge. But the stator is not doing work to the fluid in this process. The change in flow angle does not change the temperature. Instead, total temperature is constant along the deflected streamline. As the distance between the probe and the stator becomes bigger, the potential influence of the stator becomes smaller, as does the change of flow angle. As a result, Euler temperature is closer to the real stagnation temperature. Fig. 3.5 shows the Euler temperature at four different axial stations. The potential influence will die out beyond half chord length. For stages with closely spaced rotor and stators, Euler turbine equation is not valid in the inter-stage measurement
Because the flow gradient is the greatest around the stator leading edge region, using Euler turbine equation to get total temperature from measured velocity components will most likely give erroneous results. Therefore it should be avoided. However, since the effect of the stator blades changes sign across the leading edge plane circumferentially, there is always a neutral position where the effect of the two neighbor blades cancel each other. The point in the mid-passage in Fig. 3.4 is an example. In the experiment conducted by Ng [181 a conclusion was drawn that Euler turbine equation was good at least in the time averged sense, up to 1 percent or even better. His instrumentation port was in the mid-passage of two stator blades, which is probably such a neutral position.
3.5 Spatial Variation of Time Averaged Total Temperature and Pressure
Results from a simulated stage with strong rotor-stator interaction will be presented here. The stage layout is similar to the one shown in Fig. 2.3, with a rotor stator inter-gap size of 20 percent of the rotor axial chord and
a rotor stator pitch ratio of 1.45. Because the stator was moved closer to the rotor trailing edge, the flowfield around the rotor is highly unsteady. Fig. 3.6 shows the unsteady velocity vector in both the rotor and stator passages, in the relative frame to each individual blade. The potential field of the stator introduces unsteadiness into the rotor passage, mainly confined to the region around the rotor trailing edge. The potential interaction has also changed the performance of the rotor. The pressure and temperature ratio across the rotor were changed to 1.56 and 1.14 respectively, compared to the design point solution, Table 2.4.
The pitchwise variation of total temperature and total pressure at two different axial locations, 20% and 15% upstream of the stator are shown in Figs. 3.7 (a) and (b). Also shown on Fig. 3.7 (a) is the temperature deviation from the mean, by setting the stagnation temperature in front of the rotor as the temperature of the Standard Atmosphere, 288.15 degrees Kelvin. The pitchwise as well as the axial variation is substantial, almost 2 degrees Kelvin. It is interesting to notice that both the shape and the magnitude of this pitchwise variation change axially, with higher variation at downstream stations. This change is almost as big as the pitchwise variation in magnitude. The stagnation pressure changes are almost in phase with the temperature change. For this reason, only temperature will be presented later.
The physical reason for this spatial distribution is the rotor loading change due to the influence of the stator. Just as the stator sees a periodic flow field with a period of the rotor blade passing time, the rotor behaves in the same periodic fashion due to the relatively "moving stator", with a period of stator "blade passing" time, which is equal to the rotor blade passing time
divided by the rotor stator pitch ratio. The circulation and lift coefficient of the rotor as a function of the stator blade passing time is given in Fig. 3.8. From Kelvin's theorem, the circulation change on the rotor results in the shedding of vorticity, which forms a vortex sheet behind the rotor blade. Fig. 3.9 shows the pitchwise vorticity distribution downstream of the rotor trailing edge. Because there are many sources of vorticity in the flowfield, shock and leading edge error, for example, only the unsteady vorticity is plotted. The positive or negative vorticity corresponds to the decreasing or increasing circulation on the rotor blade respectively.
Because the tangential force on the rotor changes from time to time, the work done changes also. The work variation can also be regarded as a spatial change because the moving rotor has a distinct position at a fixed time. This explains the spatial distribution of total temperature shown in Fig. 3.7 (a).
This phenomenon can also be explained in the following way. It is known that the time averaged total temperature changes across a row of moving point vortices, because of the unsteadiness introduced by the moving vortex system [211 In fact, the stagnation temperature variation between the rotor and the stator is due to the fact that the shedded vorticity forms an continuous array of vortices, which redistribute energy in the space they occupy. This leads to a spatial nonuniformity of time averaged total temperature (energy) in the flow field.
Horlock analyzed the total pressure variation analytically in a uniform incompressible potential flow using this concept [51 Assumming a sinusoidal variation of circulation on the rotor with a magnitude of Ar, i. e.
r - O0 + Arsin(27rt/ c ) ( 3.4a )
where
r
0 : average circulationt : time
rc : period of circulation variation
then the variation of time averaged stagnation enthalpy (total temperature) in a compressible flow can be expressed by
AH(x,y) - sin x tan( 1 2 2)+y ( 3.4b )
with AH(x,y) representing the spatial variation, r the rotor blade passing period, S the stator pitch and a the absolute flow angle. x and y are defined as the axial and tangential coordinate as before, but with the origin located at the point of the rotor trailing edge when t - 0 in Eq. 3.4a.
The vortex pattern in the inter-gap region is certainly not regular due to the potential influence of the stator. The vortex sheets are modified when approaching the stator leading edge. This probably explains the change of shape and magnitude in the total temperature variation at different axial locations. But this has not been verified.
Coincidentally, the circulation on the rotor blade reported here is close to sinusoidal. This is not necessarily true in general. Using Crocco's theorem, Giles came up a vortex sheet analysis showing the simple correlation between the
spatial variation of total enthalpy at one location (x,y) and the circulation perturbation from its mean at the time when the rotor trailing edge passes that point (x,y) [224 That is
AH(x,y) - Al(x,y) ( 3.5 )
This avoids the assumption of a sinusoidal circulation, and applies only at the trailing edge station of the rotor. He also showed that time averaged total
temperature remains constant along pathlines of the inviscid vortex sheets.
Fig. 3.10 compares the time averaged total enthalpy variation at the rotor trailing edge station, based on 1) output of UNSFLO; 2) Giles' correlation with circulation from UNSFLO; 3) Horlock's first harmonic variation with the same magnitude in circulation change. The close agreement is primarily a consistency check between the numerical and analytical methods. If the circulation change is small, the pathline of the vortex sheet elements will be the the time averaged streamline. The total temperature should be constant along these lines. Fig. 3.11 verified this point The proportional relationship between AH and
Ar/7
is demonstrated in Fig. 3.12. The straight line is equation (3.5) and thesymbols represent the magnitude of circulation and enthalpy change in each individual calculation with different geometries.
From the above argument we can make the following conclusion. Whenever there is a periodic variation of circulation on the rotor blade, there will be a time averaged total temperature and pressure distribution, with a pitchwise period equal to the distance travelled by the rotor in one cycle. The
downstream stator is the primary source of the circulation change in this report But this is not the only one. Upstream IGVs can bring unsteadiness to the rotor too. This is mainly the interaction between the wake and the rotor. Calculation of this kind is not carried out, but we can use results from wake stator interaction to infer the magnitude of circulation change in this situation. Fig. 3.13 is the circulation change on the stator blade with incoming wakes of
20% in velocity defect As can be seen, the variation can be up to the same order of magnitude as in rotor stator interaction.
3.6 Effects of Geometrical Variations
As the potential influence of the stator is the primary source of spatial nonuniformity in the flow field, it is reasonable to believe that any change in the stator geometry can have substantial effects. The potential influence of the stator decays exponentially upstream, so increasing the gap will decrease the total temperature variation. By the same reason, decreasing the stator pitch will decrease the degree of nonuniformity associated with the stator blade row. The temperature variation will also be reduced. In the limit, the stator pitch goes to zero, then the temperature variation will also vanish.
A wide range of gap size and pitch ratio exist in turbomachinery hardware. And the gap changes radially in the same machine due to the blade twist Gap size changes from as small as a few percent of rotor axial chord in close spaced compressors to as much as a few chords away in fans. The rotor stator pitch ratio can vary from 2 in compressors to 0.2 in fans, with only a few thick struts downstream of the rotor. To examine the effect of this changes, the stator geometry (pitch and gap) was altered to produce
desired selections. The rotor geometry was kept unchanged.
The effect of gap size on the pitchwise total temperature variation is shown in Figs. 3.14 a), b). Three gap sizes were selected at 10, 20 and 40 percent rotor axial chord while the pitch ratio was kept constant at 1.45 for all three cases. Variations at two axial locations, both the rotor trailing edge and 10 percent upstream of the stator are shown in a) and b). The effect is significant An half chord spacing produces negligible variation while a 10 percent spacing leads to as high as 5 degrees in pitchwise variation for a 50 degree temperature increase across the stage. Note that the variation for three cases are almost in phase at the rotor trailing edge. This is probably circumstantial for this geometry. The relative phase shift at the 10 pecent station reflects the different convective time from the rotor trailing edge to the measuring station for three cases.
Changing the stator pitch while keeping the gap size at 20 percent, the effect of different pitch ratio is studied. As UNSFLO readily accepts arbitrary pitch ratio, this is very easily done. The pitch ratio ranges from 0.94 to 2. This effect is revealed in Figs. 3.15 (a) and (b). Again two axial locations are used. The dependence on pitch ratio is very large. Again, the variations at the rotor trailing edge are in phase. But the change at the 10 percent station is due to the different waveform of the variation, rather than the convective time because the spacings are the same for all three cases.
3.7 Effects of stator loading
turning angle while preserving the axial chord and thickness distribution, a family of stator blades are created. The stator blade thickness distribution was found to be
T(x) - 0.01438 + 0.2106x + 0.2097x2 ( 3.6 )
by fitting a quadratic curve to the measured blade thickness [14] using the
least square technique, Fig. 3.16. Other information about the double arc mean
line is obtained from the original design report [9], shown in Fig. 3.17.
Because the mean line radii have to be changed to achieve arbitrary turning, their ratio are kept constant, at 1.024. Fig. 3.18 is the three blade sections,
with 100, 125 and 150 percent of original geometrical turning. The calculations were carried out with a gap of 20 percent and a pitch ratio of
0.94.
The effect of stator loading on total temperature variation is shown in Fig. 3.19. The actual flow turning through the stator are annotated in tha same
figure. The effect is not much The reason might be that, even though the stator turning varies considerably, the front part of the three blades do not change very much. It is this part which contributed the most to the nonuniformity of the flow field in front of the stator.
3.8 Effect of stator thickness
The nonuniformity of the flow velocity is proportionally dependent on the thickness of the stator blade. The thicker the airfoil, the bigger velocity variation. Consequently, the magnitude of the circulation change on the rotor
blade increases, due to the greater unsteadiness produced by the stator. This means higher total temperature variation, according to Eq. 3.5.
In order to verify these arguments, a rotor-strut interaction calculation was carried out by replacing the downstream stator with a thick strut bearing a NACA-0021 airfoil section. The thickness distribution can be formulated as the following [23] T(x) - 0.21 0.296900/T - 0.12600 x - 0.35160 x2 + 0.28430 x
-
0.10150
x
4)
( 3.7 )
The leading edge was rounded with a circular arc with radius of 0.0485. The maximum thickness of the strut was selected to be two third of the rotor pitch, by comparing to the relative length scale used in Ng's experiment [241 In most cases, only 4-6 struts is placed downstream of the rotor fan, and the gap between the rotor and the strut is about 4 times the axial chord of the rotor to reduce the noise level. In this calculation, a rotor strut pitch ratio of 0.25 and a gap size of 40% of the rotor chord were selected. The gap size seems to be unrealistic, but the reliability of the solution is not affected . The resulted unsteadiness due to such a small gap is much higher than in real fans.
In order to simplify the problem, the strut loading was minimized by using a straight camber aligned to the flow direction. As the flow angle is an unknown before the flow field was solved , the previous solutions were used here. It appeared that there was a small angle of attack for the strut, but the
loading because of this is very small. The relative geometry of this rotor-strut
stage is shown in Fig. 3.20.
Also shown in Fig. 3.20 is the contour plot of the instantaneous total temperature for this stage at one instant of time. Notice the intensity of the unsteadiness due to blade row interaction. A system of strong compression waves are produced at the exit of the rotor passage when this passage approaches the leading edge of the strut While the rotor moves along, these compression waves evolve into a passage shock that travels upstream and finally pops out of the rotor inlet This may be unrealistic due to the small gap, but the author finds it interesting.
The time averaged total temperature variation in front of the strut is shown in Fig. 3.21. The total temperature contour plot at the right is much like the one shown in Fig. 3.11, again supporting that time averaged total
temperature does remain roughly constant along the streamline. The pitchwise temperature variation, normalized by the temperature increase through the rotor, is also plotted on the left Notice that an total temperature variation of as much as 50% of the temperature increase across the rotor exists, almost
50 time more than shown in Fig. 3.7. This implies that the thickness of the
stator (strut) is an important factor in determining the total temperature variation, supporting the argument made at the beginning of this section.
In a summary, the spatial variation of time averaged total temperature is a strong function of the stage design parameters, like the rotor stator gap and pitch ratio (blade number count). The thickness of the stator blade strongly
26
affects the magnitude of this spatial variation. For the stage studied here, an pitch ratio lower than 2. and/or a gap size less than 40 percent will introduce noticeable total temprature variations. Thus care has to be taken in interpreting measurement results on stage performance.
Chapter 4
Implications of Blade Row
Interaction on Measurement and Design
The spatial variation of time averaged total temperature and pressure in the rotor stator gap region affects many aspects of compressor performance measurement and design. As most compressors consist of closely spaced rotor and stators in the compression system in order to reduce weight, blade row interaction and the resulting spatial variation of time averaged flow quantities are inherent to modern turbomachinery technology. This chapter deals with how blade row interaction affects measurements and design, offers guidelines on probe placement and/or data correction.
4.1 Probe Placement
The relatively large tangential and axial variation of time averaged total temperature as well as pressure implies that pitchwise survey using rake or traversing probes is prefered. When this is not possible and only limited instrumentation is allowed, the location of the probe must be chosen carefully. As the difference between the probe reading and the mean value differs from place to place, and from one machine to another, this must be treated according to the particular situation.
One major concern of performance measurement is the adiabatic efficiency, which is calculated from time averaged total pressure and temperature. The pitchwise distribution of efficiency at two axial locations using the local time average of total temperature and pressure are presented in Fig. 4.1, referring to Figs. 3.6 a) and b). The variation is very small, less than
a quarter of one percent from the average value. This means that the loss ( shock strength for this case) is not altered due to the blade row interaction, showing that the pressure and temperature are in phase, as noted in Figs. 3.6. The axial variation of efficiency in the stator mid-passage is also examined, shown in Fig. 4.2. As most probes are placed outside the stator passage, the axial position is positive in the upstream side in Fig. 4.2, and vice versa. The change is also negligible.
In common practice, the pressure and temperature probes are not co-located. This is of no concern if the flow field is uniform. In the situation shown in Figs. 3.6, where considerable pitchwise variation exists, the difference between total temperature and pressure probe locations can bring enormous adiabatic efficiency error. Take the axial location 20 percent upstream of the stator, for example. By arbitrarily choosing temperature and pressure probe positions within one stator pitch, the effciency change from its mean is plotted as a contour map in Fig. 4.3. The maximum error can amount to 3 percent This error certainly depends on the magnitude of the pitchwise variation for different stage geometries. It can be even worse. So we strongly recommend that the temperature and pressure probes are located at the same pitchwise position relative to the stator, if co-location is impossible.
Losses associated with the shock system at the supersonic portion of the rotor span is the major cause of compressor inefficiency. When the rotor stator gap is reduced, the back pressure at the exit of the diffusive rotor passage is increased due to the influence of the stator blades. As a result, the passage shock is pushed forward if the rotor passage after the shock is not choked. Fig. 4.4 shows the shock position for three different rotor stator spacings, 10, 20 and 40 % rotor axial chord. When the shock moves forward, the normal Mach number before the shock is smaller, leading to a lower loss across the shock. The adiabatic efficiency for these three cases are 96.6%, 95.7% and 95.2%. This may not be quantitatively accurate due to the unrealistic treatment of the inlet boundary condition (the relative inlet flow angle was kept constant rather than the absolute flow angle), but it certainly indicates a possible tendency.
Another loss mechanism is the loss of kinetic energy locked with the shedding of vorticity due to blade row interaction. A certain percentage of the kinetic energy, if not all, will be lost after the vortex core is dissolved in the process of viscous diffusion. The circulation fluctuation is inevitable in closely spaced blade rows because of the interaction between blade rows and wakes. However, since the magnitude and phase of this variation depends on the relative position of the surrounding blade rows, it may be possible to arrange the circumferential position of the front and aft blade rows (IGVs and stators, for example) so that when the effect of the upstream blade tends to increase the circulation on the rotor, the downstream blade will decrease it As a result, the net effect of them will make the circulation change smaller, thus reducing the losses related to the shedding.
One area of interest is the time averaged effect of the unsteady blade row interaction. It is observed that the flow structure, shock position in particular, differs quite a lot from steady to unsteady solutions. This is important because most design approaches rely on the steady state assumption, without taking into account the unsteady effects.
In summary, care must be taken in interpreting the measurements in the flow field where strong blade row interaction exists. Data correction must be applied if single probe is used to measure stage pressure and temperature ratio. Temperature and pressure sensors should be positioned in the same locations relative to the stator. The impact of blade row
Chapter 5
Conclusion and Recommendations
5.1 Conclusions
The effect of blade row interaction on compressor performance measurement has been investigated by running an inviscid CFD code . The potential field of downstream stator periodically changes the rotor circulation and tangential force, resulting in the spatial nonuniformity of time averaged total temperature and pressure in the region between the rotor and stator. This spatial variation is highly dependent on the size of the rotor stator spacing and pitch ratio ( blade number count). Increasing the spacing and stator pitch reduce this spatial nonuniformity. Increasing the stator thickness will also make the magnitude of variation bigger. For the blade geometry studied here, spacing of less than 40% rotor axial chord and/or a pitch ratio of less than 1.5 will introduce noticeable spatial variations. The total
temperature can vary as much as 3% of the total temperature increase through the rotor, for a stage with gap size of 20% and a pitch ratio of 1.45, which is typical of most modern compressor design.
Results also show that using Euler turbine equation around the leading edge plane of the stator can lead to serious problems and should be avoided
As far as efficiency is concerned, unsteady rotor stator interaction has negligible effects as long as the temperature and pressure are measured at the same location relative to the stator, say at two stator leading edges. But a deviation of 3% in efficiency can be introduced for the stage studied if the temperature and pressure probes are not co-located. This should be avoided as much as it can be.
Shock losses are possibly influenced by the gap size in transonic compressors. Losses associated with modulated vortex shedding due to blade row interaction can be another loss mechnism which is not incorporated in the design process. Proper match of circumferential positions between IGV and stator in multi-stage compressors may reduce the lose of kinetic energy locked with the vortices shedded from the rotor blades, located between the IGV and the downstream stator.
5.2 Recommendations
All the results reported here are obtained from calculational means. Therefore it should be experimentally verified. Care must be taken in choosing test compressor to assure that blade row interaction is strong, and the spatial variation of total temperature is not obscured by other sources. As the flow field is highly unsteady, the response characteristic of conventional, low frequency probes should also be studied.
There are many other aspects of unsteady blade row interaction. Results showed that the time average of the unsteady flow field differs from the steady results a great deal. This is an area need to be explored and the
33
results can be used to improve the usual design approach. As time goes along, the knowledge of unsteady flow will be more and more complete.
REFERENCES
1 WEYER, H, "The determination of Time-Weighted Average Pressure in Strongly Fluctuating Flows, Especially in Turbomachines,"
ESRO TT-161, May 1975.
2 PIANKO, M, WAZELT, F, " Suitable Averaging Techniques in Nonuniform
Internal Flows," AGARD-AR-182.
3 KERREBROCK, J.K, MIKOLAJCZAKAA, "Intro-Stator Transport of Rotor Wakes and Its effect on Compressor Performance," ASME Paper 70-GT-39, 1970.
4 Ng, W.F, EPSTEIN, A.H, "A Quasi-Three-Dimensional Model for
Intro-Stator Transport of Rotor Wakes," ASME Winter Annual Meeting, November,1985.
5 HORLOCK, J.H, DANESHYART, H., "Stagnation Pressure Changes in Unsteady Flow," Aero. Quarterly, Vol. XXII, August 1971, pp. 207-224.
6 ZIEKE, W.C, OKIISHI, T.H, "Measurement and Analysis of Total-Pressure Unsteadiness Data from an Axial-Flow Compressor Stage," J. Engineering for Power, Vol. 104, April 1982, pp 479-488
7 GILES, M. B., "UNSFLO. a Numerical Method for Unsteady Inviscid FLow in Turbomachinery," GTL Report 195, October 1988
8 GILES, M. B, "UNSFLO. User's Menual, Version 4.0," (unpublished), October 1988
9 URASEC, D. C, CORRELL, W. T. CUNNAN,W. S., "Performance of Two stage Fan Having Low-Aspect-Ratio, First-Stage Rotor Blading,"
NASA TP-1493, August 1979
10 WOOD,J. R, STRAZISAR, A. J., SIMONYI, P. S., "Shock Structure in a Transonic Fan Using Laser Anemometry," AGARD CP-401, Setember 1986.
11 HATHAWAY, M. D, OKIISHI, T. H., STRAZISAR, A. J, ADAMCZYK, J. J.,
" Measurements of the Unsteady Flow Field within the Stator Row of a Transonic Axial Flow Fan," Parts I,, ASME PAPERS 87-GT-226,
87-GT-227
12 GERTZ, J. B, "Unsateady Design Point Flow Phenomenon in Transonic Compressors," Ph.D THESIS, MIT 1985
13 OWEN, P. R., "Computational Simulation of Unsteady Flow in a Transonic Compressor Rotor," MS. THESIS, MIT 1986
14 HATHAWAY, MD., Private Communication, 1988.
15 GILES, M. B., "Calculation of Unsteady Wake/Rotor Interactions,"
AIAA-87-0006, January 1987.
16 GILES, M. B., "Stator/Rotor Interaction in a Transonic Turbine,"
AIAA-88-3093, July 1988.
17 EPSTEIN, A.H, Private Communication.
18 Ng, W.F., EPSTEIN, A.H, "Unsteady Losses in Transonic Compressors,"
J. of Engineering for Gas Turbines and Power, Vol. 107, April 1985. pp. 345-353.
19 AGNEW, B., ELDER, R.L., TERREL, M., "An Investigation of the Response of Temperature Sensing Probe to An Unsteady Flow Field,"
20 KUROSAKA, M. et al, "Energy Separation in a Vortex Street," J. Fluid Mech. (1987), Vol. 178. pp 1-20.
21 Preston, J.H, "The Non-Steady Irrotational Flow of an Inviscid Incompressible Fluid, with Special Reference to Changes in Total
Pressure through Flow Machines," Aeronautical Quarterly, November 1961,
36
22 GILES, M.B, Private Communication.
23 Abbott, LH, "Theory of Wing Sections," Dover Publication, New York, 1959
24 Ng. W.F, O'Brien, W.F. and Olsen, TL., "Experimental Investigation of Unsteady Fan Flow Interaction with Downstream Struts," J. Propulsion. Vol. 3, No. 2, March-April 1987, pp 157-163.
Table 2.1 Summary of the 2-D stage geometry ROTOR STATOR Axial Chord (cm) 6.41 5.25
Pitch (cm)
5.18
3.35
Average Radius (cm) 18.15 Gap (cm) 4.98Inlet Angle (deg) 53.64 -39.26 Outlet Angle (deg) 38.84 1.75
Table 2.2 Flow parameters at the inlet and outlet of the rotor and stator as measured by NASA Lewis Research Center [14].
ROTOR STATOR
inlet outlet inlet outlet Wheel Speed (m/s) 304.3 N. A. Flow Angle (Deg) 56.2 42.8 -39.3 -0.6 Rel. Mach Number 1.113 0.659 0.670 0.502 Total Pressure (psi) 14.7 24.01 24.01 23.89 Static Pressure (psi) 11.35 18.17 17.78 20.11 Total Temp. (k) 287.9 333.9 333.9 334.2 Peak Suction Side
Table 2.3 Input entries for UNSFLO calculation
Table 2.4 Comparison of calculated and measured performance through the 2-D stage CFD MEASURED
Massflow(pu)
280.1
276.8
Pt3/Pto 1.609 1.634 Tt3/Tto 1.153 1.160 ENTRY EXPLANATIONUNSTEADY Logical Input: Unsteady Mode NPER = 10 Number of Periods
to March in Time GAM=1.4 Specific heat
AINL = 59.87 Relative Flow Angle to the Rotor !POUT=0.81027 Back Pressure
VROTOR = 0.8335 Wheel Speed
STUPBC = T Use Steady Boundary Condition for Supersonic Inlet
t-O
0
N 0
v,
9z "EZ "OZ ' .LLL '8L
(trO) ,ONVISIQ IVCVIG
C
0
to
c-;0
0
LO
I- c-00 (. Cd • ., r 6)
'-O
C,
O
Lc,
Calculate
Measure,
o
0 +j 4-J C4 81 0 0 4-0 0 a, if c C 0 a)vD
Z a)
ED CJeqwnu pelN S x O m I-1 · I I
0 0 0 0 0 0 0 0 0 0 0 0 0 0 0 0 0 0 0 0 0 0 0 0 0 0 D 0 0 0 0 0 0 0 0 0 0 D 0 0 D 0 0 0 0 0 0 0 0 0 0 0 0 0 0 -c - u o W 00 00O - a-A 0 S0 0 0 0 0 El
a
0 0 0 0 0 0 0 0 0 0 0 0 0 0 0 0 0 0 0 0 0 0 0 0 0 0 0 0 0 0 0 0 0 0 0 0 0 0 00OOI00 1 00L O00O 00 SE 00"0 00"S2- o00OS-
00'st'-H2iid i ] 'Z "DNUi b C O UIINFJN i iU
Lu) cz .C o Lu 00 rUN LU Z L.) z o
Cý
V) 0 oC C-CN -C c c a O 0 cd o 0 '4 1)[ 4k o. c1 • A • • i -I " 0 0 c s J_
![Table 2.2 Flow parameters at the inlet and outlet of the rotor and stator as measured by NASA Lewis Research Center [14].](https://thumb-eu.123doks.com/thumbv2/123doknet/14169118.474323/46.918.254.710.746.974/table-parameters-outlet-stator-measured-lewis-research-center.webp)