HAL Id: hal-01199206
https://hal.inria.fr/hal-01199206
Submitted on 2 May 2016
HAL is a multi-disciplinary open access
archive for the deposit and dissemination of
sci-entific research documents, whether they are
pub-lished or not. The documents may come from
teaching and research institutions in France or
abroad, or from public or private research centers.
L’archive ouverte pluridisciplinaire HAL, est
destinée au dépôt et à la diffusion de documents
scientifiques de niveau recherche, publiés ou non,
émanant des établissements d’enseignement et de
recherche français ou étrangers, des laboratoires
publics ou privés.
Online Extraction and Single Trial Analysis of Regions
Contributing to Erroneous Feedback Detection
Matthew Dyson, Eoin Thomas, Laurence Casini, Boris Burle
To cite this version:
Matthew Dyson, Eoin Thomas, Laurence Casini, Boris Burle. Online Extraction and Single Trial
Analysis of Regions Contributing to Erroneous Feedback Detection. NeuroImage, Elsevier, 2015, 121,
pp.146-158. �10.1016/j.neuroimage.2015.06.041�. �hal-01199206�
NeuroImage 121 (2015) 146-158
Online Extraction and Single Trial Analysis of Regions Contributing to Erroneous
Feedback Detection
IMatthew Dyson1∗, Eoin Thomas2, Laurence Casini1and Boris Burle1∗
1Aix-Marseille Universit´e, CNRS, LNC UMR 7291,
3 place Victor Hugo – 13331 Marseille cedex 3, France
2Athena, INRIA, 2004, Route des Lucioles, 06902 Sophia Antipolis, France
Abstract
Understanding how the brain processes errors is an essential and active field of neuroscience. Real time extraction and analysis of error signals provides an innovative method of assessing how individuals perceive ongoing interactions without recourse to overt behaviour. This area of research is critical in modern Brain-Computer Interface (BCI) design, but may also open fruitful perspectives in cognitive neuroscience research. In this context, we sought to determine whether we can extract discriminatory error-related activity in the source space, online, and on a trial by trial basis from electroencephalography data recorded during motor imagery. Using a data driven approach, based on interpretable inverse solution algorithms, we assessed the extent to which automatically extracted error-related activity was physiologically and functionally interpretable according to performance monitoring literature. The applicability of inverse solution based methods for automatically extracting error signals, in the presence of noise generated by motor imagery, were validated by simulation. Representative regions of interest, outlining the primary generators contributing to classification, were found to correspond closely to networks involved in error detection and performance monitoring. We observed discriminative activity in non-frontal areas, demonstrating that areas outside of the medial frontal cortex can contribute to the classification of error feedback activity.
Keywords: Error, feedback, FRN, inverse solution, motor imagery, brain-computer interfaces, classification. 1. Introduction
Positive and negative feedback on our own action are es-sential for adapting our behaviour to a changing environment and/or learning. Of special interest is feedback signalling inap-propriate action. In recent years there has been a growing inter-est in brain signals associated to such incorrect feedback, and both fMRI and EEG studies have implicated the medial frontal cortex, and more precisely the Cingulate Cortex (its anterior and mid parts) (see Walsh and Anderson, 2012; Ridderinkhof et al., 2004 for reviews) in the processing of error feedback.
The electrophysiological index of incorrect feedback pro-cessing has been proposed to be a negative potential occurring about 200 ms after feedback, termed “Feedback-Related Nega-tivity” (FRN), with a fronto-central topography and whose am-plitude is larger for erroneous than for correct feedback (Milt-ner et al., 1997; Gehring and Willoughby, 2002; Holroyd and Coles, 2002). FRN is thought to be modulated by prediction error magnitude (Hajcak et al., 2007; Bellebaum and Daum, 2008) and is therefore linked to the evaluation of penalty as-sociated with erroneous activity rather than simply error detec-tion (Gehring and Willoughby, 2002). FRN is exhibited when
IThis is the last (postprint) version of the article published in NeuroImage,
121 (2015) 146-158
∗Corresponding authors: matthew.dyson,boris.burle@univ-amu.fr,
Labo-ratoire de Neurosciences Cognitives, UMR7291, Aix-Marseille Universit´e, CNRS, 3, place Victor Hugo, 13331 Marseille cedex 3
feedback is determined by behaviour (Holroyd and Coles, 2002; Walsh and Anderson, 2011b) and when the probabilities of re-ceiving differing types of feedback may be learned (Bellebaum and Daum, 2008; Holroyd et al., 2009). More importantly for our current purpose, the amplitude of FRN appears to be re-lated to expectancy (Holroyd and Coles, 2002; Holroyd et al., 2003; Walsh and Anderson, 2011b), changes in amplitude hav-ing been observed durhav-ing learnhav-ing (Walsh and Anderson, 2011a) and variability in amplitude predicting adjustments in behaviour (Cohen and Ranganath, 2007). A recent review of FRN proper-ties may be found in Walsh and Anderson (2012).
Since, in addition to other properties, FRN appears to be a good marker of when the feedback associated with an action is perceived as incorrect and/or unexpected, it might be exploited in a causal manner, to infer when received feedback fails to meet that predicted, hence revealing when performance of an action does not meet a current goal. This is especially useful when no alternative exists to assess the performance of a par-ticipant or system, i.e. when there is no overt behaviour, or when the intended behaviour is unknown. For example, during trial-and-error learning, knowledge of whether received feed-back matches that expected reveals essential information about the current learning phase. Indeed inferring participant strat-egy from actual behaviour might prove to be difficult as prob-ing an action supposed to be incorrect is often more efficient than trying to validate hypothesis; in this case “incorrect”
feed-back is expected and should not produce a large FRN (see Papo et al., 2003; Arbel et al., 2014 for use of offline FRN in such a context). Extracting feedback related activity at the single trial level, and in real time, is therefore a critical issue and would allow for the development of new online protocols (Sanchez et al., 2014) in which the course of the experiment is adapted, not only based on behaviour, but also on the brain’s response to feedback.
Online extraction of EEG activity associated with erroneous feedback corresponds to a particular type of Brain-Computer Interface (BCI) system; which is, by matter of definition, a type of interaction which precludes resorting to overt behaviour. Ac-cording to current terminology within the BCI field, systems acting primarily to detect error-related activity on a single trial basis are referred to as passive BCI systems (Zander et al., 2010; Zander and Kothe, 2011). A passive BCI system is one not intended for the purpose of voluntary control, but instead provides additional information with regard to users’ intentions or internal states (Zander et al., 2010). An active BCI system is that which produces a control signal based on brain activity that the user is consciously attempting to control. Motor im-agery based systems are the most common example of this type. Currently the majority of passive BCIs involve error detection, often using the error-related potential (ErrP) terminology (Fer-rez, 2007).
The coupling of passive BCI systems with their active coun-terparts is an active research area. The properties of active BCI systems make them a mature prototypical environment within which to probe and generalise the extraction of single trial error-related activity. In the present report, we will concentrate on this context. In a BCI setting, if the system incorrectly decodes a user’s intention it will produce an output which fails to match the user’s expectation. There is no overt way of detecting these types of error, however the action coupled to the system output should serve as incorrect feedback, eliciting FRN, a probable component of the ErrP. In this context feedback may be ex-ploited at two levels. During ongoing activity, detection of ErrP may be used to infer that a BCI user perceived the action which elicited the response to be incorrect and appropriate measures taken. At an abstract level, monitoring rates of error-related po-tentials may provide an indirect gauge of perceived error rate, a factor believed to play an important part in motivation impact-ing on individual performance (Nijboer et al., 2010).
Typically detection of error-related activity in a BCI con-text is used to correct or negate a system’s output. Various BCI research groups have already demonstrated use of ErrP(s) on a single trial basis to improve real, or simulated, BCI perfor-mance. For example, Ferrez and Mill´an have detected ErrP(s) during cursor control (Ferrez and Mill´an, 2005, 2007) and a human-robot interaction task (Ferrez and Mill´an, 2008). Kreilinger et al. have detected single trial ErrP in tasks which use motor imagery to control a discrete cursor (Kreiglinger et al., 2009), a car driving game (Kreilinger et al., 2011) and a robotic arm (Kreiglinger et al., 2012) while Perrin et al. have studied ErrP/FRN in the context of feedback obtained during online use of a P300 speller system (Perrin et al., 2011, 2012). Zander et al. (2010) demonstrated that single trial ErrP detection can significantly
improve real game play in an uncontrolled test environment. In-tegration of ErrP detection has been shown to significantly en-hance gaze-independent ERP-spelling by Schmidt et al. (2012). Based on these previous works, the present research has two main goals, each with different scope. Broadly speaking, our first goal is to determine whether we can extract discrimina-tory error-related activity in the source space, online and on a trial by trial basis. We attempted to extract such activity dur-ing the concurrent performance of motor imagery in a real BCI experiment. This is arguably one of the most challenging con-ditions, since activities generated by motor imagery, primarily in the supplementary motor area and the primary motor cortex, may prevent single trial detection of activity also presumed to be originating in the medial wall, likely in the cingulate cor-tex (Ridderinkhof et al., 2004; Walsh and Anderson, 2012). Whether or not error related activity can be detected during performance of motor imagery, has important implications in a BCI context because it influences when, and how often, feed-back can be applied and exploited in hybrid (Pfurtscheller et al., 2010) motor imagery and ErrP detection BCI systems.
Our second, and primary, goal is to determine to what ex-tent the activity we extract is physiologically and functionally interpretable. Put simply we aim to ascertain whether we can classify error-related activity in the source space and, if so, determine whether or not the regions contributing to classifi-cation fit with the performance monitoring literature. Within the BCI field, it has indeed been argued that without correct identification and labelling of ERP(s), the functional nature of even the most well known BCI systems may be misunderstood (Kaufmann et al., 2011). Currently, error-related potential acts as a useful umbrella term for ERP(s) elicited from the inter-action between a user and a BCI. However, the term conveys little explanatory power and remains specific to the BCI field. By assessing the degree to which functionally discriminant fea-tures contribute to classification, we may determine which neu-ral components are most relevant to ErrP(s), ensuring correct identification and labelling of ERP(s) contributing to separa-bility (Allison and Pineda, 2003, 2006). By gauging the de-gree to which these discriminative features relate to existing knowledge from the fields of error detection and performance monitoring, we may make steps toward inferring how these ERPs may be interpreted in the broader nomenclature of current neurophysiological literature. This general argument applies for many cognitive neuroscience experiments utilising classi-fication techniques; our goal is to adequately classify correct and incorrect feedback, in order to understand the underlying functional and neural determinants producing different types of EEG activity. As we aim to infer underlying functionality by analysis of discriminant EEG, our approach may be seen to fol-low the principle of reversed functionality, as discussed in Zan-der and Jatzev (2012).
To answer these questions, online BCI experiments were performed in which participants were presented with multiple discrete feedback periods during individual trials of motor im-agery. The perceived error rate of each participant was manipu-lated dynamically such that they all experienced similar overall control of the system. As advocated by Ferrez (2007), in use
of the Cortical Current Density model (CCD), inverse solution techniques can be beneficial to the detection of error-related po-tentials. Capitalizing on this work, we used the FuRIA inverse algorithm (Lotte et al., 2007b, 2009). The FuRIA algorithm has a number of properties which make it especially suited for the current study. First, regions of interest (ROI) produced by FuRIA are data driven: by considering all spatial areas of ac-tivation and testing across a wide range of frequency bands, we were able to derive ROI based solely on class labels. This data driven approach allowed us to minimise the introduction of a priori. The second important property is that FuRIA ROI are fully human interpretable (Lotte et al., 2010), describing a spatial area, a frequency band of response and how changes in power relate to class labels. This second property seperates FuRIA from the inverse methods employed in Ferrez (2007) as, unlike distributed voxels, FuRIA ROI are clustered voxels which can be interpreted in terms of distinct areas of activ-ity by reference to the head model utilised (Fuchs et al., 2002; Pascual-Marqui, 2003). The third property is that FuRIA ROI may be described in the quadratic form, allowing for real time extraction of data from EEG making FuRIA ROI appropriate features for online extraction.
To verify that ErrP discrimination rates obtained were suf-ficient enough that they may be considered viable for BCI use, simulations were performed using a modern adaptive classi-fier as a method of validating the rates of detection (Thomas et al., 2013). We then exploited the interpretable properties of the FuRIA algorithm (Lotte et al., 2010) to investigate whether or not ROI features extracted were indicative of activity which may be interpreted in formalisms of error detection and per-formance monitoring. A post-hoc analysis was performed on a standardised feature space to provide additional information complementary to that of the initial investigation.
2. Methods
2.1. Data Collection
EEG data representative of receiving feedback related to online use of a motor imagery BCI system was collected. To maintain readability, the full description of the online BCI ex-periment used to generate representative EEG data and simu-lations used to validate classifier detection rates may be found in a stand-alone form in the Appendix. Section A of the Ap-pendix covers the methods used for acquisition of EEG data. The technique used for artefact removal is described in Section B.1.
2.2. Data Dependent ROI
Data dependent ROI were extracted using the FuRIA algo-rithm (Lotte et al., 2007b, 2009, 2010), which will be briefly described.
2.2.1. The FuRIA algorithm
The FuRIA algorithm describes a sequence of steps which automate a method of extracting ROI in source space and their corresponding frequency bands of activity based on significant
differences in activity associated with user supplied class labels. Regions of interest and associated frequency bands produced by
the algorithm may either be ‘crisp’, in which case all voxels/
frequency responses are equally weighted, or ‘fuzzy’, where the degree to which a voxel or a specific frequency band is impor-tant is defined by a membership function. FuRIA, as defined by the authors, proceeds in three steps and requires the definition of two hyperparameters α and H.
1) Identification of statistically discriminant voxels and
fre-quencies: The output of the first step is a list of
discrimina-tive powers for each voxel tested at each frequency band tested (voxel-frequency pairs). To ensure correctness of statistical es-timates, p values associated with each voxel-frequency pair are determined using a multi component randomisation method. Voxels with p values below a given threshold, α, are considered for inclusion in the succeeding stage of clustering of voxels into ROI.
2) Creation of ROI and frequency bands:The output of the
second step of the algorithm are a set of ROI and their associ-ated frequency response vectors. A modified mean shift algo-rithm is used to spatially cluster discriminatory voxels. The sec-ond FuRIA hyperparameter, H, is the radius of a sphere defin-ing the degree of smoothdefin-ing used when clusterdefin-ing local maxima into ROI. Larger values of H promote fewer, more general, re-gions of interest while smaller values produce a greater number of spatially specific ROI. At the end of the second stage, fea-tures appropriate for BCI classification may be extracted from EEG by frequency band filtering within the discriminatory range of interest followed by spatial filtering with the quadratic form associated with the ROI.
3) Fuzzification of ROI and frequency bands:Optimal
‘fuzzi-fication’ of ROI consists of weighting the individual voxels as-sociated with a ROI such that those with more discriminative power have a greater influence on spatially filtered output. A corresponding fuzzification of frequency may be applied. In this case the magnitude response of an infinite impulse response filter is weighted according to the selectivity of the individual frequencies within the overall band.
The functional output of the FuRIA algorithm are quadratic form filters, describing the ROI, which may be utilised for real time extraction of current source time series. The real time properties of the quadratic form filtering method readily allows for computationally inexpensive analysis of the time course as-sociated with regions of interest. In this analysis an α signifi-cance level of 0.05 was used. For clustering local maxima a H value of 0.75 was used in order to promotes multiple specific ROI, this being the lowest value tested in Lotte et al. (2009). Frequency band information was obtained using Yule-Walker filters, with overlapping bands extracted from 2 to 31 Hz. 2.2.2. ROI extraction
Regions of interest were obtained from one second epochs of data time locked to presentation of feedback. An artefact re-moval technique was applied prior to application of the FuRIA algorithm, described in Appendix B.1. Data were labelled as representing either positive or negative feedback. For analysis
of data dependent ROI, the FuRIA algorithm was applied once to the entire data of each participant in order to obtain single sets of non-overlapping regions. To demonstrate that the FuRIA method is a robust method of obtaining ROI adequate for sin-gle trial classification, a cross validation procedure which fully maintains the separation of recorded data blocks is applied in the Appendix (Section B.2).
As stated, data dependent ROI were generated by applying the FuRIA algorithm to all available data. Although not for-mally proven, we make two reasonable assumptions to link ROI generated by FuRIA with single trial activity results in the Ap-pendix. The first supposition is that voxels which show statisti-cal differences between classes over the entire dataset will also show similar differences in large subsets of the data and will, therefore, be generated in cross validation activity. The second assumption is that use of stratified cross validation over the en-tire dataset will promote those ROI which generalise through-out data, and therefore is a method of identifying those regions contributing to classification across folds in single trial tests.
As a heuristic to demonstrate that this is the case we calcu-lated the spatial overlap between the single most discriminative ROI from each of the four data folds and the four most discrim-inative ROI from the full data for each subject. Overlap was calculated by taking the size of the paired ROI intersection and dividing over the size of the smaller ROI in the comparison. By recording the maximum overlap obtained we measure the degree to which the most discriminative ROI from individual subsets of data were represented by highly ranked ROI from stratified cross validated data. The mean overlap value between the most discriminative ROI from folded data and the four top ranked ROI in unfolded data was 0.85, with a standard devia-tion of 0.17. The median overlap value obtained was 0.90. This heuristic indicates that the most discriminative ROI from single trial activity were similarly ranked in individual subject’s cross validated data.
2.3. Representative ROI
To determine whether the data dependent ROI extracted by FuRIA appeared representative of activity consistent with er-roneous feedback processing, we obtained representative ROI across participants. Regions of interest for each participant were ranked based on a weighted support vector machine (SVM) recursive feature elimination (RFE) procedure. SVM are an es-tablished classification method (Cortes and Vapnik, 1995) which are commonly utilised in the BCI community (Lotte et al., 2007a). SVM recursive feature elimination (SVM RFE) is an applica-tion of RFE which uses the weight magnitude of a SVM as a ranking criterion (Guyon et al., 2002): for each participant a search was performed of SVM cost parameter C and weight option wi, with wi weighting the error class C value to wi*C, as implemented in LibSVM (Chang and Lin, 2011). Weight values were tested from one to 20 incrementing by 0.5 with
cost values ranging from 2−1to 25. All searches were based on
nested five by five fold stratified k-fold cross validation. Opti-mal cost parameter and weight values for minimisation of error were selected for each participant and recursive feature
elimi-nation applied to obtain a ranked list of regions of interest and their associated accuracy rates.
Up to fifteen ROI from each participant were included in an overall grouped ranking. The method of ranking representa-tive ROI promoted regions which maximised shared intersect-ing voxels over participants, normalised by the size of the ROI. Ranking was non inclusive of multiple ROI from a single partic-ipant, and was based solely on spatial information. The region of interest in a participant which maximised said measures was selected as the exemplar. Voxel information to identify the cen-troid of the ROI was obtained using LORETA-KEY (Pascual-Marqui, 2003).
3. Results
We will first briefly present the surface potential activities for both correct and incorrect feedback. We then present the representative ROIs obtained with the FuRIA method as de-scribed above. This will be followed by a more detailed analysis of the activities of those ROI to gain further insight into the role the various regions of the brain perform in feedback processing. 3.1. Surface EEG
Grand average surface EEG activity associated with error and correct feedback periods are displayed in Figure 1. Data was high pass filtered with fourth order Butterworth filters, with a cut-off frequency of 0.3 Hz. Data was forward and backward filtered. The first two rows of Figure 1 present the topographic information for error feedback activity (first row) and correct feedback activity (second row) at different time points. The lower part of the figure shows the time courses of the activity for correct (blue) and incorrect (red) feedbacks at electrode FCz. Replicating previous results, a larger negativity after incorrect feedback occurs around 200 ms post feedback with a fronto-central topography.
3.2. Representative ROI
The top ten representative ROI across participants and their corresponding Brodmann areas are shown in Table 1. The num-ber of participants who had intersecting features overlapping the exemplar ROI are listed and regions are sorted by this count. The SVM-RFE rank sort column value displayed in Table 1 shows the relative position of the region of interest’s mean SVM-RFE rank within the ten ROI listed. A lower mean SVM-SVM-RFE rank indicates more discriminative ROI activity. Figure 2a shows the spatial location of the two top ranked exemplar ROI, as mea-sured by the number of participants matched, which have been amalgamated in the figure for the sake of representation. As listed in Table 1 this corresponds to ROI in and around Brod-mann areas 8 and 32. Figure 2b shows the spatial location of the exemplar ROI with lowest overall SVM-RFE rank (highest overall discriminability) as matched in five participants: Brod-mann area 40 in the right inferior parietal lobule (IPL). Exem-plar ROI were obtained from the data dependent FuRIA method and displayed in LORETA-KEY.
−0.25
0
0.25
0.5
0.75
1
−6
−4
−2
0
2
Time Post Feedback (s)
Amplitude (
µ
V)
Correct Feedback
Error Feedback
−6 −3 0 3 6Figure 1: Grand average EEG activity at FCz with associated topographic maps of scalp data. Upper row topographic maps generated from error feedback trial activity. Lower row topographic maps generated from correct feedback trial activity.
Table 1: Top ten representative regions of interest (ROI). Ranked by number of participants with corresponding ROI fol-lowed by average SVM rank in RFE. Brodmann area (BA #) and Location using terminology defined in LORETA-KEY. Number of participants with intersecting ROI and relative aver-age rank of ROI in SVM-RFE.
ROI# BA# Location and Participants SVM-RFE
Hemisphere Matched Rank
1 8 Medial Frontal Gyrus - 9 3
2 32 Cingulate Gyrus - 9 7
3 13 Anterior Insula/Fr.
Operculum Right 8 2
4 6 Medial Frontal Gyrus - 7 6
5 25 Anterior Cingulate
subgenual cortex - 7 10
6 13 Anterior Insula/Fr.
Operculum Left 6 9
7 40 Inferior Parietal
Lob-ule Right 5 1
8 18 Cuneus - 5 8
9 8 Middle Frontal Gyrus - 4 4
10 40 Inferior Parietal
Lob-ule
Left 4 5
4. Post-hoc Analysis
A post-hoc analysis was performed using the representa-tive ROI listed in Table 1 as a standard set of features applied to all participants. In order to perform cross participant analy-sis, filters were created for each Brodmann area associated with representative ROI. Active voxels within a ROI were defined by the ROI’s Brodmann number as detailed in LORETA-KEY. For further analysis both ROI centred around Brodmann area 8 (Table 1, ROI# 1 and 9) were consolidated into a single region of interest. Time series ROI data were analysed with respect to equivalent ERP and ERD/ERS activity in source space. A correlation analysis was also performed.
4.1. Current Source ERP Averages
Averages of current source activity for each representative ROI were produced. In the case of ERP data, unbalanced num-ber of trials were used. As described in Section 3.1, surface EEG data was high pass filtered using fourth order Butterworth filters with a cut off frequency of 0.3 Hz in order to minimise temporal distortion. Data was forward and backward filtered.
(a) (b)
Figure 2: (a) Amalgamation of the two exemplar ROI matched in all participants processed. ROI centroids match Brodmann areas 8 and 32. (b) Exemplar ROI with lowest overall SVM-RFE ranking, matched in five participants. ROI centroid matches Brodmann area 40. Data dependent fuzzy ROI obtained in FuRIA and displayed in LORETA-KEY.
For presentation of source ERPs, ROI quadratic form filters were applied to averaged data to obtain clear estimates of the temporal progression of series. Source values were aligned for a baseline period preceding each trial. The baseline period cor-responded to the 250 milliseconds prior to the presentation of feedback.
Figure 3 shows average estimated current source activity for regions of interest corresponding to Brodmann area 32 and the parietal occipital ROI in Brodmann areas 18 and 40. The
ver-tical axis shows activity in µA/cm2against time post feedback
in seconds. With respect to current source, the ERPs in Figure 3 broadly describe the two main patterns of temporal activity observed across ROI in the grand average. Brodmann area 32 was chosen over Brodmann area 8 as it displayed a better sig-nal to noise ratio. Peak activity around 200 milliseconds was clearly visible in Brodmann area 6 and existed in a more noisy form in Brodmann area 13 ROI in the anterior insula/frontal operculum. With respect to ERP onset, little discernible dif-ference existed between grand average activity of areas within the medial frontal cortex (Brodmann areas 32, 8, 6) and with the anterior insula/frontal operculum (BA 13). The onset of activity in Brodmann area 25 was delayed with respect to ac-tivity in the medial frontal cortex Brodmann areas by a sub 20 millisecond value. Differences in baseline activity made com-parison of the onset of activity in parietal occipital regions with that in frontocentral areas more difficult, however after tempo-ral smoothing parietal occipital ROI appear to show a genetempo-ral pattern of delayed activation. Lagged correlation analysis of ERPs, both based on grand average activity and individual sub-ject data, failed to identify any systematic differences in latency between Brodmann areas 32, 8 and 6. Lagged correlation anal-ysis based on individual subject data found frontal activity in Brodmann areas 32, 8 and 6 preceded that in other ROI. 4.2. Time Frequency Maps
Time frequency maps of response activity within each rep-resentative ROI were made. In order to ensure that the pre-trial baseline for error and correct trials was comparable, only the first feedback period for each trial was used for calculation. The baseline period in plots is therefore composed of EEG data dur-ing which participants were performdur-ing motor imagery prior to receiving any feedback for the trial. The number of error and
correct trials were balanced by taking those correct trials which were temporally closest in the run to the error trials used.
Time frequency maps were produced by modifying the pro-cedure usually followed to generate event related synchronisa-tion and desynchronisasynchronisa-tion ERS/ERD maps of surface EEG ac-tivity. The method is intended to highlight power changes ob-served after error feedback activity greater than those obob-served after correct feedback, which coarsely correspond to the statisti-cal differences between class current densities used to generate ROI. Data were filtered in 2 Hz wide bands from 3 to 20 Hz. At each frequency band, quadratic form filters for each ROI were applied and a trial based referencing method utilised, meaning independent baselines were used for individual trials based on source activity preceding the cue period. Periods of significant difference from baseline were calculated based on Welch’s t-test (using unknown variance) following a Box-Cox transformation. To determine the significance threshold to apply for plotting, p values were tested and lowered until no systematic periods of significant difference from baseline existed for time frequency maps of correct trial activity. This thresholding was intended to allow interpretation of significant activity in time frequency maps occurring at a level greater than that found after presen-tation of correct feedback. It should be noted that because data is grouped and trial based referencing has been applied, sig-nificant areas of activity could be attributable to the activity of subsets of participants, rather than necessarily existing in all participants.
Average time frequency responses for the frontal ROI at Brodmann area 32 and the parietal/occipital ROI are shown in Figure 4. As in ERP averages, these ROI appear to adequately describe overall activity. The increase in power associated with feedback related negativity is shown in blue. The time fre-quency response related to feedback related negativity in Brod-mann areas 6, 8 and 32 were very similar, with no discernable difference apparent between areas. The same synchronised ac-tivity was visible at a diminished level in maps for Brodmann areas 25 and 13. Induced activity is visible in Figure 4. In-duced activity is associated with a decrease in power, shown in red, and commences around 200 to 250 ms post feedback. De-creased power was most visible in posterior ROI and least visi-ble in anterior ROI, consistent with the propagation of a signal generated in parietal/occipital areas.
−0.25 0 0.25 0.5 0.75 1 0.2 0.4 0.6 (a) BA32 −0.25 0 0.25 0.5 0.75 1 0.2 0.4 0.6 (b) BA18 −0.25 0 0.25 0.5 0.75 1 0.1 (c) Left BA40 −0.25 0 0.25 0.5 0.75 1 0.1 (d) Right BA40
Figure 3: Baseline corrected current source density ERPs for post feedback trial period. Blue shows correct trial ERP, red shows
error trial ERP. Horizontal axis shows time relative to feedback in seconds. Vertical axis shows amplitude in µA/cm2. Note:
subfigures a and b show a larger amplitude scale than used for subfigures c and d.
−0.25 0 0.25 0.5 0.75 1 5 10 15 20 −0.1 0 +0.1 (a) BA32 −0.25 0 0.25 0.5 0.75 1 5 10 15 20 −0.05 0 +0.05 (b) BA18 −0.25 0 0.25 0.5 0.75 1 5 10 15 20 −0.05 0 +0.05 (c) Left BA40 −0.25 0 0.25 0.5 0.75 1 5 10 15 20 −0.05 0 +0.05 (d) Right BA40
Figure 4: Time frequency response for ROI in the post error feedback trial period. Vertical axis shows frequency in Hz. Horizontal
axis shows time relative to feedback in seconds. Individual color bars show power differences in µA/cm2(log-transformed). Blue
shows power increase. Red shows power decrease. Only significant differences to reference are displayed (P < 0.001, Welch’s t-test, Box-Cox Transform).
32 13 8 13 6 18 25 40 40
...
ROI Layout Brodmann BA##0 - 250
ms
125 - 375
ms
250 - 500
ms
375 - 625
ms
...
625 - 875
ms
750 - 1000
ms
Figure 5: Significant changes in correlation coefficients between representative ROI after error feedback for various time segments within a trial. Left image shows layout of Brodmann areas. Blue lines show significant increases in correlation. Red lines show significant decreases in correlation. (P < 0.05, Permutation tested). Time periods are indicated. No significant differences were found in the 500 - 750 ms window.
4.3. Correlation Analysis
Whilst only matched in around half the participants tested, a right parietal ROI ranked most highly overall in SVM-RFE results. Reliable differences in right hemisphere beta rebound activity have previously been reported in BCI literature with re-spect to perceived loss of control (Zander and Jatzev, 2012). As right hemisphere biased posterior activity was also found in this study, a correlation analysis was performed to elucidate re-lationships between anterior and posterior activity in the data obtained. In the case of the conditions tested, we are interested in whether correlation between ROI increases or decreases in association with feedback type. We performed analysis on the difference between the correlation values in the two conditions. The difference between correlation values can be shown to fol-low a normal distribution, unlike coefficient values themselves
which tend to be skewed. Pictured as two similarly correlated scatter conditions, this analysis equates to determining whether the angular difference between best fit projections is significant. For correlation analysis, current density time series data for each participant was z-scored and trial data split into seven 250 millisecond periods with 125 millisecond overlap. For each time period and ROI pair, permutation testing was used to gen-erate 100,000 randomly labelled class indices from which a dis-tribution of differences in mean Spearman rank correlation val-ues was created. This distribution represented the null hypoth-esis that differences in correlation between ROI was not related to feedback type. Actual differences in mean correlation values were then compared to the null hypothesis distribution to deter-mine where differences fell below p < 0.05. Figure 5 shows sig-nificant differences in mean correlation values found between
error and correct feedback conditions for the seven overlapping periods in the post feedback window. Pairs of ROI for which the difference in correlation values showed significant increases af-ter error trials are shown in blue, while significant reductions in correlation are shown in red. Following an increase in correla-tion between frontal and posterior areas, we observe significant decreases in correlation, across a diffuse network, occurring rel-atively late (around 500 ms) after feedback. As this network overlaps central areas, it may contribute to the non-stationarity of EEG, potentially influencing the feature space of motor im-agery based BCI systems. We shall come back to interpretation of this correlation in the discussion.
5. Discussion
The general goal of this research was to assess whether er-ror potentials can be extracted in the source space, and whether the recovered generators, in terms of ROI, would be readily in-terpretable with regard to the performance monitoring networks reported in the literature. This involved two different steps.
The first step was to precise whether or not activity related to feedback can be detected in single trial EEG in the source space, during concurrent performance of motor imagery in a real BCI context. To extract source activities, we employed the FuRIA algorithm (Lotte et al., 2007b, 2009) which is well suited for online use. Initially, we determined whether or not the FuRIA method is sensitive enough to extract ROI whose activity accounts for error related potentials in EEG typical of performance of a motor imagery task, where the imagery task recruits brain areas close to the supposed generators of error potentials. In order to demonstrate that ROI extracted by Fu-RIA are relevant to ErrP(s), and that they can extract informa-tion pertinent to error related potentials on a single trial basis, i.e. that the ROI FuRIA recovered were functional, we classi-fied post feedback periods with useful detection rates. These objectives were met by the simulation presented in Sections B and C of the Appendix. These results clearly indicate that EEG activity associated with perceiving feedback as either be-ing correct or erroneous can be detected with a high level of precision on a single trial basis for a subset of trials using the FuRIA method. Given the experimental protocol, we may also state that the FuRIA method is sensitive enough to overcome the noise induced by performance of motor imagery when de-tecting activity evoked by feedback.
Our foremost goal was conditional on the above being met. This involved determining whether, based on purely data driven approaches with negligible a priori, the EEG activity associ-ated with discrimination of erroneous feedback - error relassoci-ated potentials - could be easily interpreted in the context of error
de-tection/ performance monitoring literature. We addressed this
question by spatially consolidating data dependent FuRIA ROI into a set of representative ROI, listed in Table 1. Our represen-tative ROI can be ranked according to two metrics; by how well they generalise, i.e. how many participants have data dependent ROI intersecting the representative ROI, and by how well they discriminate, in our case their relative SVM-RFE ranking. The sources which rank highest according to these two measures,
Brodmann areas 8 and 32 and Brodmann area 40 in the right hemisphere, are shown in Figure 2. It is important to note that, although displayed in the manner of typical inverse analysis, re-sults in Figure 2 were obtained by applying inverse methods to single trial EEG, parcelling voxels into ROI according to indi-vidual subjects separability and then comparing the intersection of ROI across individuals. As the ROI presented in Figure 2a is centred in a region described by numerous source localisa-tion studies of FRN (Ridderinkhof et al., 2004; Walsh and An-derson, 2012) we may state that the most commonly selected discriminatory source EEG activity associated with erroneous feedback, and ErrP(s), obtained without a priori in a real BCI experiment, matches that expected in literature covering feed-back related negativity.
While the number of subjects included in the final analysis was low, our primary goal was to precise the particular neu-ral determinants promoting discrimination between feedback types, rather than to generalise from our classification rates. In this respect, although our pool of participants was limited, results demonstrate that the frontal ROI associated with FRN was detected in all subjects tested, indicating high consistency across the experimental group. The rest of the discussion fo-cusses on the representative ROI generated by this study and how this network of activity may be interpreted in a BCI con-text.
5.1. Interpretation of Representative ROI
The representative ROI show a good degree of overlap with networks described by Ullsperger and von Cramon (2003) when investigating performance monitoring under conditions lacking sufficient information for error detection; BA24c, BA6, BA8, bilateral activity in BA13/14 and bilateral activity around BA40. A similar network was also identified by the same authors when emphasising accuracy and error relevance, in which case sig-nificant changes were found in BA24, BA6, BA13 bilaterally, in the supramarginal gyrus on the left hemisphere and the tem-poroparietal junction right hemisphere (Ullsperger and von Cra-mon, 2004). Performance monitoring when lacking sufficient information for error detection is actually a good description of the initial use of a BCI by naive participants. It is therefore unsurprising that similar networks of activity are involved. In early BCI use, two factors prevent participants from detecting, or being consciously aware of, erroneous activity. The first is that feedback is typically at least one level of abstraction above surface EEG activity. This abstraction occurs as reduced rep-resentations of EEG are transformed into a control signal by a classifier; a black box with transfer characteristics that must be learned by experience. The second is that untrained users usu-ally control surface EEG in an indirect manner, through the ap-plication of conscious mental effort (Curran and Stokes, 2003). Online training allows users to transition from the application of conscious mental effort to an appropriate automated activity. This transition is possible because, while cognitively demand-ing, the conscious mental effort approach allows for trial by trial adaptation which facilitates exploratory learning. As a form of exploratory learning we also expect to see activity associated with reward processing (Holroyd and Coles, 2002; Walsh and
Anderson, 2012) in the medial frontal cortex region which de-scribes the border between Brodmann areas 8, 6, 32 and 24 (Ridderinkhof et al., 2004).
With respect to attention related behaviour, activations in the inferior anterior insula/frontal operculum have been sug-gested to reflect co-activation of the autonomic system (Ullsperger and von Cramon, 2004) which could enable the feeling of hav-ing committed an error, potentially enhanchav-ing awareness, via visceral reactions to the event (Klein et al., 2007). Significant bilateral activation has been identified as occurring in the ante-rior insular/frontal operculum cortex during pre-response con-flict, decision uncertainty, response errors and negative feed-back (Ullsperger et al., 2010). It has also been suggested that
the right anterior insula/ frontal operculum may modulate
cog-nitive control systems when task conditions become challeng-ing. This may occur when engaging cognitive control to opti-mise performance by regulating attention and focus via interac-tion of the dorsal and ventral atteninterac-tion systems (Eckert et al., 2009). In the present data, a strong right hemisphere bias is present in insula/frontal operculum activity, both in terms of generalisation and discriminability. Note, however, that the centroids of the representative ROI are more posterior than de-scribed in the literature, at the level of precision of EEG source localisation. While insula activity representing shifts between adaptive and stable task control (Dosenbach et al., 2007) would provide a parsimonious explanation in the given BCI context, an alternative interpretation could be related to emotional re-sponses to uncertainty and negative feedback (Flynn et al., 1999).
Post FRN, we observed an extended period of induced ac-tivity (see Figure 4). During this period, correlation increases between nodes of networks broadly matching those described
in imitation/ learning literature, including regions in the frontal
cortex and the inferior parietal lobule (Figure 5). These net-works are theorised to facilitate the generation of visuomotor transformations when imitating actions (Decety et al., 1997) and to translate actions into motor representations (Buccino et al., 2004). Differences observed in lateralisation of activity sug-gest that the right IPL computes representations of expected state for comparison to sensory information in order to inhibit feedback from internally triggered actions (Decety et al., 2002; Chaminade and Decety, 2002). Evidence for the inferior
pari-etal role in generating and / or updating forward models also
comes from lesion studies (Sirigu et al., 1996; Danckert et al., 2002; Schwoebel et al., 2002). The EEG component
promi-nently considered to index ‘updating of context’ is the P3/ P300
(Donchin and Coles, 1988), the posterior component of which, the P3b, is believed to have distributed generators encompass-ing the temporoparietal junction (Polich, 2007). In the context of motor command prediction errors, Krigolson and Holroyd (2006, 2007) have speculated that the P3 may reflect part of an evaluative process indexing the revision of internal forward models. Ullsperger et al. (2014) have also proposed that late centroparietal positivity following errors, the P3b in the case of feedback, reflects processing related to adaptive behaviour -which given a motor imagery BCI context is likely to involve forward model revision.
Evidence suggests the parietal areas play a core role in the
comparison of internally modelled states with sensory feed-back, and that this role requires the maintenance and real time updating of forward models. The production of motor imagery is reliant upon imitation and forward modelling as it aims to reproduce internal representations in the absence of sensory feedback. In an online BCI context, additional constraints are placed on the role of forward models. In the online case, users are typically expected to adapt their behaviour toward that which is positively reinforced by feedback, sometimes referred to as adapting toward the classifier. A static classifier rewards con-sistent reproduction of the activity provided during the calibra-tion stage, while punishing activity that deviates in an unspec-ified manner from the calibrated norms. In this situation, opti-mal behaviour requires both the minimisation of effort required to obtain reward, exploration of the space of forward models, and consistent reproduction of activity, exploiting any knowl-edge gained about classifier requirements.
It may be the case that networks that facilitate the
genera-tion of visuomotor transformagenera-tions/ update forward models are
strategically activated post error feedback: in this case activ-ity between Brodmann areas 40 and 6 would reflect informa-tion exchange between parietal and motor areas (Decety et al., 1997; Gr`ezes et al., 1998). This activation could represent ei-ther resetting of models back to a ‘last known good configura-tion’ or alteration to an untested pattern depending on whether the BCI user is attempting to minimise effort in the short term or to explore the possible range of acceptable applicable im-agery. These explanations provide suggestions as to why motor imagery post feedback may sometimes exhibit greater separa-bility (Reuderink et al., 2011) and have an influence on overall classification rates (Koerner et al., 2014). Unfortunately anal-ysis of post feedback effects on classification was not possi-ble in our case as all feedback periods could not be considered sequentially independent. This induced post feedback activity may also explain non-stationarities reported in feature spaces when perceiving loss of control (Shenoy et al., 2006; Zander and Jatzev, 2012) and may be especially congruent with obser-vations of significant changes in right hemisphere beta activity observed by Zander and Jatzev (2012).
In contrast to frontal FRN activity, induced activity observed in our study was matched across fewer subjects. Given the pro-posals given by Krigolson and Holroyd (2007) and Ullsperger et al. (2014) regarding the nature of the P3/P3b like component observed, this difference may relate to strategies of adaptation. Two behaviours which would make this activity invisible to our data driven approach would be: failing to adapt behaviour post error feedback, and/or continued revision of forward models for motor imagery irrespective of feedback. Should induced activity reflect a P3/P3b component, an alternative explanation for less consistency may simply come from the fact that these ERP(s) are associated with more a diffuse set of generators than FRN (Polich, 2007) making a single ROI less likely to be se-lected across subjects.
In conclusion, the data presented support the primary and secondary research question with caveats. Activity related to error feedback can be detected in single trial EEG in the pres-ence of noise generated by motor imagery. This is important in
a BCI context as it suggests discrete feedback embedded within trials as a viable alternative to continuous or post trial feedback. Activity contributing to classification when selected without an
a priorion the source can be interpreted in the context of FRN
literature. In the case of continuous performance of motor im-agery, non frontal discriminatory EEG components exist. The degree to which posterior features are likely to remain stable as a user becomes proficient in motor imagery remains an open issue to be investigated
Acknowledgments
This work was carried out as part of the CoAdapt Project, funded through ANR-09-EMER-002-01 and by the European Research Council under the European Community’s Seventh Framework Program (FP7/2007-2013 Grant Agreement no. 241077). The authors wish to thank the members of the Co-Adapt Project for essential input.
Appendix : BCI Error Feedback Experiment
This appendix outlines the experiment which was run in or-der to acquire data representative of experiencing error feed-back while using a BCI system. Participants used a real BCI system which introduced faux errors when necessary. Care was taken in the experimental design to prioritise classifier output such that participants could not probe for faux feedback by in-tentionally acting contrary to system cues. As we aimed for users to experience error feedback, our BCI experimental de-sign is inconsistent with state of the art methods for optimisa-tion of motor imagery classificaoptimisa-tion. For example, while EEG was acquired using a high density system, motor imagery clas-sification was based on Laplacian transformation of two to three electrode channels, rather than utilising individualised spatial filtering methods (Ramoser et al., 2000; Blankertz et al., 2008). Incorporating information from additional channels would im-prove classification accuracy and overall BCI control (Blankertz et al., 2006), however doing so would reduce the number of ‘real’ feedback errors experienced by participants. A reduc-tion in ‘real’ feedback errors would necessitate either a greater dependence on faux feedback, altering the manner in which subjects attribute agency to mistakes or a longer period of data collection, introducing complexities as users’ abilities improve over time.
A. Acquisition of Feedback Trials
Data were collected during performance of a BCI motor im-agery task with feedback primarily delivered according to par-ticipants’ performance. Participants performed four blocks of motor imagery without feedback, data from which was used to train a classifier for online classification of motor imagery, followed by four blocks with feedback. When participants’ on-line performance exceeded, or failed to meet, prespecified ra-tios of error to correct feedback, an adaptive algorithm manip-ulated the type of feedback delivered to increase or reduced the amount of error feedback experienced.
A.1. Participants
Eleven participants aged between 25 and 33 were tested (four female). Informed written consent was obtained accord-ing to the declaration of Helsinki and the local ethics committee (CCP Sud M´editterann´e 1) approved the experiment (Approval
# 1041). Participants were paid around 100 e. All
partici-pants were free of psychoactive medication use and any history of neurological disease including head injury. All participants were naive to BCI use.
A.2. Data Acquisition
Sixty four channels of EEG were recorded using a Biosemi ActiveTwo with electrodes positioned according to the interna-tional 10-20 system. Data were sampled at 2048 Hz, low-pass filtered (Butterworth) and decimated by a factor of eight in or-der to downsample to 256 Hz. All protocols were implemented in, and data recorded using, OpenViBE (Renard et al., 2010). A.3. BCI Training Data and Calibration
Motor imagery training followed a Graz-style protocol (Pfurtscheller and Neuper, 2001). A fixation cross was pre-sented. After a delay of one second a beep occurred, followed by a delay of 1.5 seconds before presentation of a cue for one second. The cue presented was an arrow which pointed either to the left or right. The direction of the cue indicated which hand the subject should use to perform imaginary movements. The fixation cross remained on the screen for 5 seconds after which the trial ended. Each participant performed 4 runs of 40 trials. An outline of the protocol used for motor imagery training is shown in Figure A.6a.
Resulting EEG data representative of motor imagery was surface Laplacian transformed (Hjorth, 1975). Event related desynchronisation/synchronisation (ERD/ERS) maps were cal-culated between one and 40 Hz for 21 channels (frontal-central, central and central-parietal channels five through six) covering the motor cortex. Event related synchronisation and desynchro-nisation maps displayed significant changes in power relative to a baseline prior to the directional cue, and were calculated for both left and right hand motor imagery. An operator manually selected potentially applicable electrode channels, and partic-ipant specific alpha and beta frequency bands, selecting those with ERD/ERS maps which showed significant changes in ac-tivity relative to baseline which was also distinct to one class of motor imagery. In the case of each participant, the operator defined a single pair of frequency bands (the upper and lower limits of both alpha and beta frequencies) and the number of relevant EEG channels; producing feature vectors which were a multiple of two in length unless frequency band information was specifically excluded from particular channels.
Manual channel selection, and frequency band inclusion, were then tested and informed using offline analysis methods included in the BioSig toolbox (Schl¨ogl and Brunner, 2008) for Matlab (Mathworks Inc, Boston, MA). Offline analysis meth-ods presented accuracy and Kappa values for the trial period, along with cross validated accuracy for a particular time period and specific accuracy and area under the curve (AUC) values
Time (s)
Beep
Cue
Motor Imagery
0
1
2
3
4
5
6
7
8
(a)1˜s
2˜s
3˜s
(b)Figure A.6: (a) Individual trial timing for Graz style motor imagery training protocol. The fixation cross period is represented by the continued horizontal bar. All other events are as labelled. (b) Modified Graz online protocol with discrete feedback. After a beep sound a left/right cue indicates which type of motor imagery to perform. Discrete feedback is initially positioned in the centre of the fixation cross. Three feedback periods are presented, each after a one second delay. The second feedback period in the image represents error feedback. Wrist movements indicate the period during which participants were instructed to perform flexion/extension motor imagery.
for each imagery class. In the case where more than two elec-trode channels were selected as potentially appropriate, the op-erator determined the most discriminative pair of channels and then followed a heuristic whereby additional channels were in-cluded if they produced notable improvements to offline cross validated accuracy. Up to four electrode channels were se-lected, producing a maximum of eight features. For the ma-jority of subjects, four features were used (two channels × two frequency bands) and of this group all but one participant used subject specific alpha and beta band activity from electrode channels C3 and C4.
In order to drive three consecutive feedback periods within a single trial a small degree of temporal optimisation was per-formed. A three second window which optimised discrimina-tion was selected from within the first four seconds of trial data. The window period was determined based on cross-validated classification accuracy calculated using the BioSig toolbox. The three second window was then epoched into non-overlapping one second periods. The one second periods were used to train a linear discriminant analysis (LDA) classifier (Fischer, 1936) implemented in OpenViBE. An approximation of how well the classifier was anticipated to perform online, for the first, sec-ond and third non-overlapping one secsec-ond periods, was derived by applying the OpenViBE LDA classifier to the training data. Classification rates obtained by applying the OpenViBE LDA classifier to the training data were then used to seed accuracy logs. Individual accuracy logs were retained for each of the three feedback periods.
A.4. Online BCI Use with Feedback
Participants performed an OpenViBE motor imagery ex-periment modified to display discrete, rather than continuous,
feedback. Figure A.6b shows an outline of the interface pre-sented to the user. After directional cue presentation (Figure A.6b panel two), a block appeared centred on the fixation cross. Within each trial three discrete feedback positions were pre-sented. Each feedback position was maintained on the screen for one second. The direction of movement of feedback was based on online classification of a one second period of EEG prior to feedback presentation. Three consistent correct classi-fier outputs moved the feedback block to the outer edge of the fixation cross. Error rates for each of the three feedback periods were sequentially updated over a 40 trial period, with each 40 trial period overlapping the previous run. For the initial online run the accuracy logs described in Section A.3 were modified to increase the recorded error rates by around 15%. These ac-curacy logs were used to represent a fictitious prior online run, which filled a first-in, first-out queue on which sequential esti-mates of error rates were based. The modification to increase error rates was performed to account for the classifier having been trained and tested on the same data, in order to ensure ini-tial estimates of user accuracy were not artificially high. Over the course of testing, error rates obtained were sequentially up-dated after each trial for each of the three discrete feedback periods independently. Within each run feedback was manip-ulated, based on error rates, such that each participant experi-enced minimum rates of 20% error feedback and 70% correct feedback, for each of the discrete feedback periods. Each par-ticipant performed four runs of 40 trials, during which time an operator monitored EEG.
B. Analysis of Feedback Trials
Analysis of feedback trial data was performed offline. The analysis of feedback data is separated into three sections:
arte-fact removal, feature extraction and simulation of sequential single trial classification. In order to be appropriate for BCI use all sections are based on methods which may be applied in real time.
B.1. Artefact Removal
During preliminary analysis of data it became apparent that some artefactual EEG produced amplitude values in source space which were visually discriminable from normal distributions. On the assumption that electromyographic (EMG) activity was the main source of these artefacts, a rejection method was based on the discrete Teager-Kaiser transform (Kaiser, 1990). The Teager-Kaiser energy transform is a simple method applicable in real time (making it appropriate for use in a BCI context) that improves the signal to noise ratio for detection of mus-cular activity (Solnik et al., 2010). For EMG onset detection the Teager-Kaiser transform is typically applied to a signal and, after any post processing, values are discretised according to whether or not a predefined threshold is exceeded. The thresh-old value is often defined in terms of the standard deviation of the input signal.
Figure B.7 shows an example projection of the maximum current source values (log transformed) observed within two ROI in LORETA source space, which were used during manual calibration of Teager-Kaiser threshold values. Manual calibra-tion was based on observacalibra-tion of data from each participants’
first motor imagery session with feedback 1. Energy
trans-forms were calculated for all channels and trials. A correspond-ing current source projection was calculated for the same data and displayed the maximum source amplitude for each feed-back trial (as shown in Figure B.7). Calibration of a constant value, n, which defined the Teager-Kaiser threshold in terms of EEG standard deviations, was then performed by observ-ing trial source projections labelled accordobserv-ing to surface energy transformed values. Feedback periods in which two neighbour-ing electrode channels produced energy value greater than the threshold defined by n were labelled as artefactual. The value of n was tuned so as to best label source amplitude distributions assumed to be spurious via the properties of surface EEG. B.2. Feature Extraction
Features appropriate for BCI classification were extracted from EEG using the FuRIA algorithm (Lotte et al., 2007b, 2009, 2010). FuRIA, as defined by the authors, requires the defini-tion of two hyperparameters α and H. Voxels which demon-strate a significant difference, p, between classes are considered for inclusion in discriminative ROI when p is below a given threshold, α. In this analysis an α significance level of 0.05 was used. The second FuRIA hyperparameter, H, defines the degree of smoothing used when clustering local maxima into ROI. Larger values of H promote fewer, more general, regions of interest. In this analysis we used an H value of 0.75. This is
1Although calibration utilises prior knowledge of EEG this step could be
replaced by a preliminary session to capture samples of artefactual data.
2.5 3 3.5 4 4.5 5 5.5 6 2 2.5 3 3.5 4 4.5 5
Max ROI BA35 log(µA/cm2)
Max ROI BA37 log(
µ
A/cm
2 )
Figure B.7: Maximum current source density (log transformed) observed after presentation of feedback for two Brodmann based ROI. Points represent single trials. Red points indicate feedback periods labelled as containing excess energy based on a Teager-Kaiser operator applied to surface electrode activity. the lowest value tested in Lotte et al. (2009) and promotes mul-tiple small ROI. Frequency band information was obtained us-ing Yule-Walker filters, with overlappus-ing bands extracted from two to 31 Hz.
The feedback related activity of interest in our analysis is time locked, therefore we introduced a fuzzy temporal member-ship, based on the same functions used in FuRIA for space and frequency (Lotte et al., 2009). This allowed us to weight tem-poral periods in the same manner as those used for space and frequency. Quadratic form filters were generated for FuRIA ROI and applied to EEG data to extract time series features. For single trial classification feature extraction was performed four times using three folds of data, following a standard cross validation procedure.
B.3. Sequential Trial Classification
We simulated based on a supposed motor imagery system presenting three discrete feedback periods per trial, as experi-enced by users. The simulated system had a passive component which aims to label feedback periods as being associated with either an error or a correct trial. The class label for a single trial was determined based on the output of both the active motor
imagery classifier and a passive error/ correct feedback
detec-tor, and was used to direct adaptation of the classifier between trials. For comparison purposes we also present results from Fischer’s static linear discriminant classifier based on all feed-back periods. EEG artefacts were simulated based on individual participants’ rates for correct and incorrect feedback. Artefact rejection was performed solely on the passive system, as the active motor imagery system uses fewer, predominantly cen-tral, channels. For each participant and condition, simulations were repeated 25 times.
B.3.1. Passive Feedback Classification
We consider high precision to be the most important prop-erty of an error potential classifier. As such two classifiers were trained based on constrained precision in discriminating the two classes of feedback - correct and error. Classification was based on Fischer’s linear discriminant (FLD) (Fischer, 1936). To ob-tain usable precision values FLD threshold values, b, were ad-justed based on a method similar to that described in Blankertz et al. (2002). For each of four folds, two FLDs were trained based on 3×10 nested cross validation. Bias value, b, was in-cremented whilst two conditions held: (a) cross validated preci-sion in the class to be discriminated remained below 90%, and (b) increments of b produced a significant improvement in
pre-cision (t-Test, df=29). Test results were obtained by applying
trained FLD classifiers to the unseen run for each fold. Mean results over the four folds are presented.
B.3.2. Active Adaptive Motor Imagery Classification
Within the simulation, motor imagery was classified us-ing an adaptive method with the properties of Kalman tive LDA (KALDA) (Vidaurre et al., 2006, 2007). As an adap-tive method KALDA has been validated and shown to perform favourably in a BCI study using a large number of participants
(Vidaurre et al., 2007). KALDA parameters UC2 and UCtini
were set to 1/160. Window length N was set to 64 samples. As all the parameters of KALDA were not correctly optimised, we refer to the classifier as adaptive FLD. The adaptive FLD was updated between trials based on the class label ascertained by the passive classification system. Simulations were informed using specificity and sensitivity rates from B.3.1. A two stage feedback classification scheme was implemented. In the first stage, an error detection classifier may invert the label produced by the imagery classifier presenting feedback. If feedback was not recognised as incorrect it was passed to a second classifier which labels feedback either as correct or unknown. The tem-poral relationships between motor imagery classification and
error/ correct classification for a single motor imagery trial with
three feedback periods are highlighted in blue in Figure B.8 and followed that detailed in Algorithm 1.
B.3.3. Determining a Trial Label
At the end of each trial a motor imagery label was deter-mined. Three simple methods of trial labelling were tested. The first method, baselineL, simply took the mode prediction of the adaptive classifier over all feedback within a trial and represents an adaptive baseline. Passive label, passiveL, used the prediction of the adaptive classifier for each period within a trial but could also classify a feedback period either as ‘error’, ‘correct’, or ‘unknown’. Feedback periods identified as ‘error’ had their adaptive classifier label flipped. Passively labelled pe-riods, those classified as either ‘error’ or ‘correct’, were then weighted as twice as likely to represent the true class label be-fore averaging. The third combined method, combinedL, used information from the passive classification method and the adap-tive motor imagery classifier. In the combined method, pas-sive labels were weighted according to their precision rates ob-tained during training, whilst motor imagery classifier output
Algorithm 1. Simulation Pseudo Code
for t= 1 → 160 {Trials} do
for f= 1 → 3 {Feedback periods} do
MotorPredictionAdaptivet f = adaptiveFLDClassifier(Xt f)
FeedbackPredictionPassivet f= MotorPredictionAdaptivet f
if RateO f Arte f act(Yt) < rand then
if RateS ensitivityS peci f icityError(MotorPredictionAdaptivet f, Yt) >
rand then
FeedbackPredictionPassivet f= not MotorPredictionAdaptivet f
FeedbackClassi f ierWeightt f = FeedbackClassi f ierWeightt f×2
else if RateS ensitivityS peci f icityCorrect(MotorPredictionAdaptivet f, Yt)
> rand then
FeedbackClassi f ierWeightt f = FeedbackClassi f ierWeightt f×2
end if end if end for
S taticLabelt = staticFLDClassifier(Xt)
BaselineLabelt = mode(MotorPredictionAdaptivet)
PassiveLabelt = mode(FeedbackPredictionPassivet(FeedbackClassi f ierWeightt))
CombinedLabelt= function(MotorPredictionAdaptivet,FeedbackPredictionPassivet)
end for
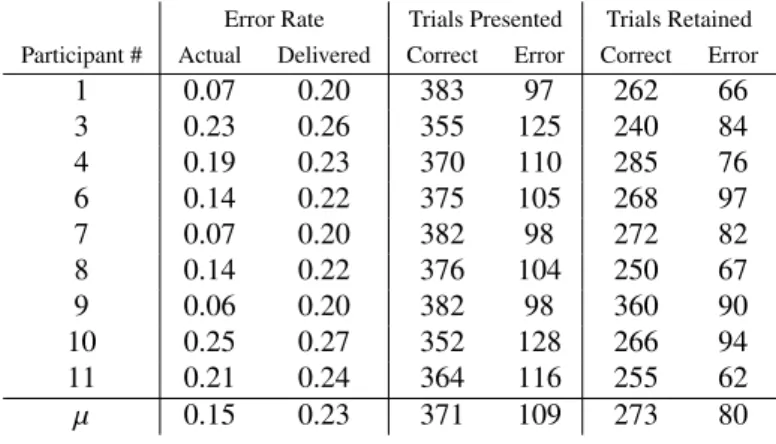
Table C.2: Data collection: Online error rate, as calculated over 480 feedback periods. Delivered error rate. Number of cor-rect and error feedback presented. Number of corcor-rect and error feedback retained after artefact rejection.
Error Rate Trials Presented Trials Retained
Participant # Actual Delivered Correct Error Correct Error
1 0.07 0.20 383 97 262 66 3 0.23 0.26 355 125 240 84 4 0.19 0.23 370 110 285 76 6 0.14 0.22 375 105 268 97 7 0.07 0.20 382 98 272 82 8 0.14 0.22 376 104 250 67 9 0.06 0.20 382 98 360 90 10 0.25 0.27 352 128 266 94 11 0.21 0.24 364 116 255 62 µ 0.15 0.23 371 109 273 80
was weighted according to the average mutual information con-tent of the period driving feedback, as sequentially maintained by the adaptive FLD (Vidaurre et al., 2007), before summation of the mean values of the two predictions.
C. Results
Two participants were not included in analysis. Participant # 2 showed signs of fatigue during motor imagery training and ERD/ERS maps produced prior to online testing revealed no systematic activity. Participant # 5 demonstrated good motor imagery during training and test but produced excessive facial movement primarily after incorrect feedback. As artefacts were strongly biased towards the negative feedback class, the partic-ipant was discounted.
C.1. Online BCI Feedback Data
Table C.2 shows the actual error rates achieved by partici-pants along with the manipulated error rate experienced during
Trial Start f = 0 MI Classf Adaptive FLD MI Feedbackf MI Feedbackf Is Error FLD MI Feedbackf Is Correct FLD f < 3 Update Adaptive FLD Determine MI Label Continue f = f + 1 Yes No MI Label MI Class f Errorf Correctf
Figure B.8: Classification, labelling and adaptation steps in the simulated BCI system for a motor imagery (MI) trial with three feedback, f, periods. Solid lines indicate steps. Dashed lines indicate interaction. Blue indicates motor imagery and feedback classification loop. 1 3 4 6 7 8 9 10 11 0.75 0.8 0.85 0.9 0.95 1 Subject Number Classification Accuracy
static FLD baselineL passiveL combinedL
Figure C.9: Simulation results: Horizontal black - classification rates for static FLD using three seconds of EEG. Boxplot blue - baselineL, passiveL and combinedL class labelling methods using discrete feedback as described in Section B.3.3.
data collection. The actual number of feedback periods pre-sented and retained after artefact rejection are also listed. Error rates in Table C.2 were obtained online using OpenViBE’s LDA classifier over 480 feedback periods per participant.
C.1.1. Passive Feedback Classification
Table C.3 shows precision, recall (sensitivity), and true neg-ative rate (specificity) rates for the correct and error FLD clas-sifiers. Test results were calculated over four folds of data, with each fold corresponding to one experimental run. Both clas-sifiers achieve similar levels of precision, with lower recall in error classification. Specificity and sensitivity rates are based
Table C.3: Test results: Precision, Recall (Sensitivity) and True Negative Rate (Specificity) for discrimination of Correct and Error feedback periods.
Correct Feedback Error Feedback
Participant # Precision Recall TNR. Precision Recall TNR.
1 0.93 0.85 0.73 0.83 0.15 0.99 3 0.92 0.89 0.77 0.91 0.50 0.98 4 0.87 0.61 0.66 1.00 0.01 1.00 6 0.89 0.82 0.72 0.86 0.20 0.99 7 0.91 0.83 0.73 0.83 0.12 0.99 8 0.88 0.77 0.61 NaN 0.00 NaN 9 0.94 0.85 0.79 0.93 0.14 1.00 10 0.87 0.73 0.69 0.87 0.14 0.99 11 0.95 0.82 0.81 1.00 0.08 1.00 µ 0.91 0.80 0.72 0.90 0.15 0.99
on the distribution of correct and incorrect feedback presented during online BCI data collection. In the table, NaN values are used where values cannot be calculated due to zero recall. C.1.2. Sequential Trial Classification
Figure C.9 shows simulation results obtained for the three labelling methods described in Section B.3.3 over 25 runs. The first column is baselineL, based on multiple feedback periods and adaptive classification; the second and third columns rep-resent passiveL and combinedL based on data from the active and passive systems. Horizontal bars represent static FLD pre-diction based on the three seconds of data driving discrete feed-back. Vertical bars show mean (circle); median; standard de-viation; and minimum and maximum whiskers. The mean ac-curacies for each condition were: static FLD 91.3%; baselineL 90%; passiveL 92.4%; and combinedL 93.6%. Mean standard deviation was below 2%.