HAL Id: hal-02932080
https://hal.archives-ouvertes.fr/hal-02932080
Submitted on 9 Sep 2020HAL is a multi-disciplinary open access archive for the deposit and dissemination of sci-entific research documents, whether they are pub-lished or not. The documents may come from teaching and research institutions in France or abroad, or from public or private research centers.
L’archive ouverte pluridisciplinaire HAL, est destinée au dépôt et à la diffusion de documents scientifiques de niveau recherche, publiés ou non, émanant des établissements d’enseignement et de recherche français ou étrangers, des laboratoires publics ou privés.
Impact of the reaction pathway on the final product in
on-surface synthesis
Antje Kutz, Md Taibur Rahman, Ville Haapasilta, Chiara Venturini, Ralf
Bechstein, André Gourdon, Adam Foster, Angelika Kühnle
To cite this version:
Antje Kutz, Md Taibur Rahman, Ville Haapasilta, Chiara Venturini, Ralf Bechstein, et al.. Impact of the reaction pathway on the final product in on-surface synthesis. Physical Chemistry Chemi-cal Physics, Royal Society of Chemistry, 2020, 22 (11), pp.6109-6114. �10.1039/C9CP06044H�. �hal-02932080�
Impact of the reaction pathway on the final product in on-surface synthesis
Antje Kutz,a‡Md Taibur Rahman,b‡Ville Haapasilta,c Chiara Venturini,,dRalf Bechstein,bAndré
Gourdon,dAdam S. Foster,c,eAngelika Kühnle b*
a Institute of Physical Chemistry, Johannes Gutenberg University Mainz, Duesbergweg 10-14,
55099 Mainz, Germany
b Physical Chemistry I, Faculty of Chemistry, Bielefeld University, Universitätsstraße 25, 33615
Bielefeld, Germany
c Department of Applied Physics, Aalto University, PO Box 11100, FI-00076 Aalto, Finland
d CNRS, CEMES, Nanoscience Group, BP 94347, 29 Rue J. Marvig, 31005 Toulouse, France
e WPI Nano Life Science Institute (WPI-NanoLSI), Kanazawa University, Kakuma-machi,
Kanazawa 920-1192, Japan
‡ These authors contributed equally to this work.
ABSTRACT
On-surface synthesis provides a very promising strategy for creating stable functional structures
on surfaces. In the past, classical reactions known from solution synthesis have been successfully
transferred onto a surface. Due to the presence of the surface, on-surface synthesis provides the
potential of directing the reaction pathway in a manner that might not be accessible in classical
solution synthesis. In this work, we present evidence for an acetylene polymerization from a
terminal alkyne monomer deposited onto calcite (10.4). Strikingly, although the dimer forms on
the surface as well, we find no indication for diacetylene polymerization. This is in sharp contrast
to what is observed when directly depositing the dimers on the surface. The different pathways are
linked to the specific arrangement of the dimers on the surface. When forming stripes along the
[-4-21] direction, the diacetylene polymerization is prohibited, while when arranged in stripes
aligned along the [010] direction, the dimers can undergo diacetylene polymerization. Our work
thus constitutes a demonstration for controlling the specific reaction pathway in on-surface
1. Introduction
On-surface synthesis has emerged as a promising approach for the fabrication of functional
molecular structures on surfaces.1-4 Performed in ultrahigh vacuum (UHV), on-surface synthesis
provides the option to create products that might not be accessible in classical solution synthesis
due to, e.g., the poor solubility5 or high reactivity of the product.4 An impressive example for the
latter is the synthesis of long acenes,6 which are instable under ambient conditions. While
nonacene is the largest acene that has been synthesized so far,7 the synthesis of decacene has been
shown by on-surface reduction on a Au(111) surface.8 In another work, triangulene has been
synthesized,9 a molecule which was predicted in 1953,10 but never isolated in its unsubstituted
form due to its reactivity.
On-surface polymerization11 of conductive chains is of particular interest for molecular
electronics applications as it offers the possibility to create electrical contacts for linking
mesoscopic objects with nanoscopic functional units.12-17 In this context, an elegant example has
been presented already in 2001, where the tip of a scanning tunneling microscope has been used
to initiate a diacetylene polymerization on a graphite surface.18, 19 However, molecular electronics
applications require electrically insulating substrates to decouple the electronic structure of the
molecules from the underlying support surface. Recently, we have shown that a diacetylene
polymerization can also be induced on the (10.4) surface of calcite, which is a bulk insulator.20 In
the latter study, the dimer formed by homo-coupling of a terminal alkyne has been used as a
precursor. Upon deposition onto the surface, the precursors adopt a specific adsorption geometry
with a spatially well-defined arrangement. Such geometrical constraints provide the key when
aiming for controlling the reaction by surface templating.21 Given that a specific relative
precursors on the surface offers a handle for controlling the reaction pathway. Ideally, different
reaction pathways should be selectable depending on the specific adsorption configuration. So far,
a clear demonstration for reaction selectivity based on surface templating is, however, lacking.
In the present work, we use a terminal alkyne precursor, namely 3-ethynylbenzoic acid (3-EBA,
see Fig. 1a), for on-surface synthesis on calcite (10.4) (Fig. 1b). Terminal alkynes are known to
undergo Glaser coupling,24 and the corresponding reaction has been proven to be possible also on
metal surfaces.25-29 We have recently presented the proof of principle that this reaction can also be
performed on calcite (10.4).30 Besides homo-coupling, the precursor used here also has the
potential to undergo an acetylene polymerization.15, 31-37 On-surface acetylene polymerization has
been shown on Au(111),37 however, not on a bulk insulator as yet. Here, we provide experimental
evidence for on-surface acetylene polymerization using 3-EBA as a precursor. Upon annealing to
550 K, we obtain acetylene polymer chains with lengths of up to 80 nm as deduced from our
dynamic atomic force microscopy (AFM) images. Interestingly, although the dimer forms as well,
we find no evidence for diacetylene polymerization. This is surprising as diacetylene
polymerization is induced when annealing the directly deposited dimer on the surface. The
specificity of this reaction pathway can be understood by the different arrangement of the dimers
in the two cases: when formed in an on-surface reaction, the dimers form stripes along the [-4-21]
direction. When directly deposited, the dimers form stripes along the [010] direction. In these
different arrangements, the alignment of the dimers with respect to each other is different,
Figure 1. Model of (a) the 3-ethynylbenzoic acid (3-EBA) molecule and (b) the calcite
(10.4) surface. The scale bar applies to both models. The calcite (10.4) surface has a rectangular unit cell with dimensions of (0.50 × 0.81) nm2, consisting of two carbonate ions and two calcium ions.
2. Methods
Experimental Part
The calcite crystals used in these experiments were purchased from Korth Kristalle GmbH
(Altenholz, Germany). The samples were degassed in situ at 700 K for 2 hours prior to cleavage
to remove air-borne contaminations. Afterwards, the cleaved crystals were annealed at 650 K for
1 hour to reduce surface charges.
The 3-EBA molecules were purchased from Sigma Aldrich (Germany) or synthesized by us
following established procedures38-43 Further information on the molecule synthesis can be found
in the ESI. The 3-EBA molecules were sublimated in situ from a home-built Knudsen cell. For
sublimation, the maximum temperature of the cell was about 310 K. During deposition, the chamber pressure remained below 2∙10-10 mbar. The molecules were deposited onto a sample kept
at room temperature.
All experiments were carried out with a VT AFM 25 atomic force microscope (ScientaOmicron, Taunusstein, Germany) under UHV conditions (base pressure typically better than 4∙10-11 mbar).
All AFM images presented in this work were captured at room temperature. Therefore, all annealed
samples were cooled down to room temperature prior to imaging. The system is equipped with an
external lock-in amplifier HF2LI (Zurich Instruments AG, Switzerland) to control the phase shift,
amplitude and excitation of the oscillation. We used n-doped silicon cantilevers purchased from
NanoWorld (Neuchâtel, Switzerland) with an eigen frequency of around 300 kHz (type
PPP-NCH). Prior to the measurements, all cantilevers were treated by sputtering with Ar+ at 2 keV for
10 minutes to remove possible oxide layers as well as other contaminations.
All images shown here are either topography (zp) or excitation frequency (𝜈𝜈𝑒𝑒𝑒𝑒𝑒𝑒) images. The fast
and slow scan directions are indicated in the upper right corner in each image. The images are
displayed such that under normal imaging conditions (i.e., without contrast inversion44) bright
colors corresponds to high attractive interactions while dark colors correspond to less attractive or
repulsive interactions.
Simulations
All the density functional theory (DFT) computations were performed using the CP2k program
suite.42 We used the PBE functional43 augmented with the D3 dispersion correction scheme44 in
all computations, both in the structural optimization calculations (T = 0 K) and in the
first-principles molecular dynamics (FPMD) simulations. The electronic structure was solved using the
Gaussian Plane Wave Method.45 The valence electrons were expanded in terms of molecularly
optimized double-zeta basis functions,47 whereas the core electronic states were approximated with
GTH pseudopotentials.46 The electronic density was modelled using a plane wave basis with an
energy cutoff of 500 Ry. The FPMD simulations were used to explore suitable bonding patterns
simulations were run for few thousand steps with a 0.5 fs timestep using velocity rescaling
thermostat45 set to a target temperature of 560 K.
3. Results and Discussion
At first, we investigated the adsorption of 3-ethynylbenzoic acid (3-EBA) on calcite (10.4).
More specifically, we performed density-functional theory (DFT) calculations to study the
binding geometry of 3-EBA on calcite (10.4). A top and side view of the adsorption geometry
is given in Figs. 2a and b, showing a flat-lying molecule. The main axis of the molecule is
oriented along the [-4-21] direction with the ring being positioned on a calcium row. The
carboxylic acid group binds to the surface via a characteristic binding motif:46 the negatively
charged carbonyl oxygen is on top of the positively charged surface calcium, while the hydrogen
points to the protruding oxygen atom of the surface carbonate group. The adsorbed molecule
exhibits a formation energy of -1.5 eV (with a negative energy being favorable to formation),
indicating that the molecule should stick on the surface at room temperature. While this is the
most stable configuration we found, there are several other possibilities involving the rotation
of the molecule’s OH-group within 0.4 eV of the ground state. This flexibility likely explains
the high mobility of the monomers on the surface despite the strong adsorption, as at room
temperature the molecule will rapidly sample through all these configurations offering paths to
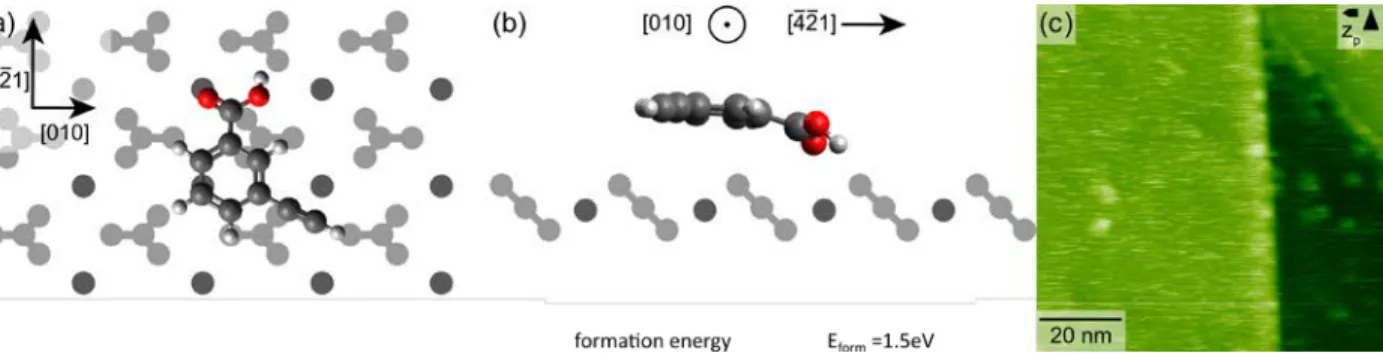
Figure 2. Optimized geometry of an isolated 3-EBA molecule on the calcite (10.4) surface
in (a) top view and (b) side view. (c) AFM topography image of an as-deposited calcite (10.4) sample. Two step edges are seen in the image. The terraces are covered by streaky features, indicating mobile species on the surface at room temperature.
To get experimental insights, we sublimated 3-EBA molecules at 310 K for 5 min in front of a
freshly cleaved calcite (10.4) surface held at room temperature under UHV conditions and
investigated the surface by dynamic AFM at room temperature. In Fig. 2c, a representative AFM
image is shown. Two terraces are seen in the image, separated by a step edge. The terraces are
decorated by streaky features, which we assign to mobile molecules. No ordered structures are
observed at room temperature. From these images, we conclude that the molecules are adsorbed
on the calcite (10.4) surface at room temperature, confirming the DFT results presented above.
The image indicates that the molecules are highly mobile at room temperature, forming a
two-dimensional gas of moving molecules. These are promising conditions for an on-surface reaction.
Next, we present the results of a heating series performed with the sample discussed
previously. After heating the molecule-covered sample at 400 K for 1 hour, dot-like bright
structures emerged (see Fig. 3a). The streaky features observed on the as-deposited sample were
still present, indicative of mobile molecules. When increasing the heating temperature to 450 K
for 1 hour, the streaky features nearly vanished. Most importantly, stripe-like structures were
formed along the [-4-21] direction (see Fig 3b). Upon heating at 550 K for 1 hour, these
stripe length up to 80 nm upon dosing more monomers and annealing for longer times (see ESI
Fig. S1). The streaky features have completely vanished and only few dot-like clusters remained
after heating at 550 K.
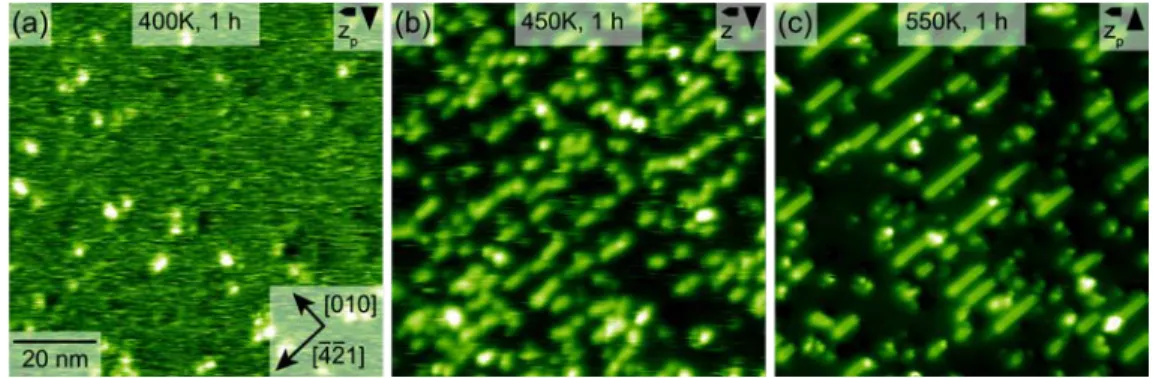
Figure 3. Examples from a heating series of a molecule-covered sample. Each annealing
step lasted for 1 hour. (a) Heating to 400 K led to the formation of some bright dots, while (b) heating to 450 K resulted in a reduction of the streaky features and the appearance of stripe-like structures, oriented in the [-4-21] direction. Further heating to (c) 550 K yielded in longer stripes and the disappearance of the streaky features.
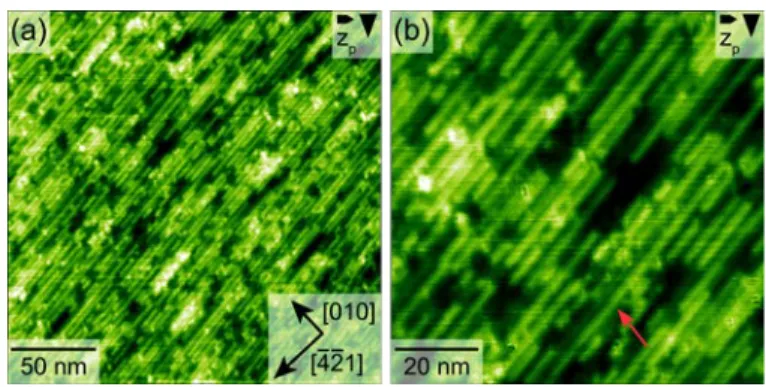
To investigate the inner structure of the emerging stripes, we performed high-resolution imaging
of a stripe-covered area. As can be seen in Fig. 4a, two different stripe-like structures exist, which
are both aligned along the [-4-21] direction. As will be argued in the following, these two structures
are assigned to (1) polyacetylene chains and (2) side-by-side aligned dimers.
The majority of the stripes (marked by the red box in Fig. 4) show a periodicity of 0.4 nm along
the [-4-21] direction, corresponding to the calcium-calcium distance in this direction (see Fig.
4b-c). Terminal alkynes are known to react via an acetylene polymerization.31 To investigate whether
the stripes formed here indeed constitute acetylene polymers, we again performed DFT
calculations. We compared the formation energy of the polymer on the surface with the equivalent
number of monomers, i.e., isolated 3-EBA molecules, maintaining compatible atom numbers in
is 1.1 eV per molecule lower than the energy of isolated 3-EBA molecules on calcite (10.4). This
calculation suggests that an acetylene polymer on the surface should be more favorable than the
unreacted monomers. Moreover, the calculated cis-transoidal polymer structure fits excellently to
the observed stripe structure, as demonstrated in Fig. 4d. With these results, we conclude that an
acetylene polymerization can be achieved via the deposition of the monomer precursor, 3-EBA,
onto calcite (10.4).47
Figure 4. Molecular structure obtained upon heating the sample for 1 h to 550 K. (a) Two
different kind of stripes can be seen along the [-4-21] direction, marked by red and blue boxes, respectively. (b) The stripe marked by the red box in (a) is shown in a frequency shift image, revealing the periodicity of 0.4 nm. (c) Sketch illustrating the inner structure of the stripes. (d) Acetylene polymer structure as obtained from DFT, including the calcite (10.4) surface to illustrate the excellent match in size and pattern.
In principle, the 3-EBA monomer used here also has the possibility to undergo
dimerization.25 When depositing this dimer directly onto calcite (10.4), we have previously shown
that it undergoes diacetylene polymerization.20 This leads to the interesting question as to why
there is no indication of diacetylene polymerization upon deposition of the 3-EBA monomer. Does
no dimer form? For this, we return to the second structure formed, which is marked by the blue
box in Fig. 4a.
In these stripes, dark dots at the periphery of the stripes are observed, which exhibit a periodicity
(see Fig. 5(a-b)). To obtain further insights into this structure, we compare these stripes with the
previously reported arrangement of the dimer molecules when directly deposited onto calcite
(10.4).20 When directly deposited onto calcite (10.4), the dimers form islands composed of rows
running along the [010] direction. However, a second island structure is found that was reported
in our previous work,20 composed of rows oriented along the [-4-21] direction (see Fig. 5c). These
rows exhibit a periodicity of 0.8 nm along the row direction and do, indeed, resemble the second
stripes observed here. When an image of the second stripe structure is superimposed onto the
island, the excellent fit in dimensions becomes evident (see Fig. 5d), indicating that the second
stripe structure found here is composed of side-by-side arranged dimers resulting in rows oriented
in the [-4-21] direction.
Figure 5. (a) Zoom-in AFM image of second structure formed upon heating the 3-EBA
monomer deposited on calcite (10.4) surface, exhibiting the periodicity of 0.8 nm. (b) Sketch illustrating the inner structure of the stripes. (c) Structure observed after direct deposition of the dimer. The yellow box highlights an island composed of stripes oriented along the [-4-21] direction. (d) An area from (a) is superimposed onto the island shown in image (c).
In summary, the two different reaction products observed here are assigned to (1) polyacetylene
chains and (2) side-by-side aligned dimers. The latter finding is surprising because it shows that
towards diacetylene polymers is observed (see Fig. 6). This result demonstrates that a different
pathway is taken when the monomer is deposited and only forms dimers on the surface as
compared to depositing the dimer directly. In both cases, dimers are present on the surface and
arrange side-by-side to form stripes, however, when depositing the dimers directly, the stripes are
predominantly aligned along the [010] direction with a periodicity of 0.5 nm along the stripe.20 In
this arrangement, the dimer spacing is in the reported range required for diacetylene
polymerization of 0.47 to 0.52 nm and also the angle of the molecular axis with respect to stripe
matches the angle of 45°, which has been mentioned in literature.23 In contrast to the situation
observed after depositing the dimers directly, when the dimers are only formed on the surface, the
stripes are aligned along the [-4-21] direction. Here, the periodicity along the stripe is 0.8 nm,
which is significantly larger than what has been reported for diacetylene polymerization.23 In this
case, the dimers do not further react to diacetylene polymers. This comparison demonstrates that,
even that the same molecule is present on the surface in both cases, the specific reaction conditions
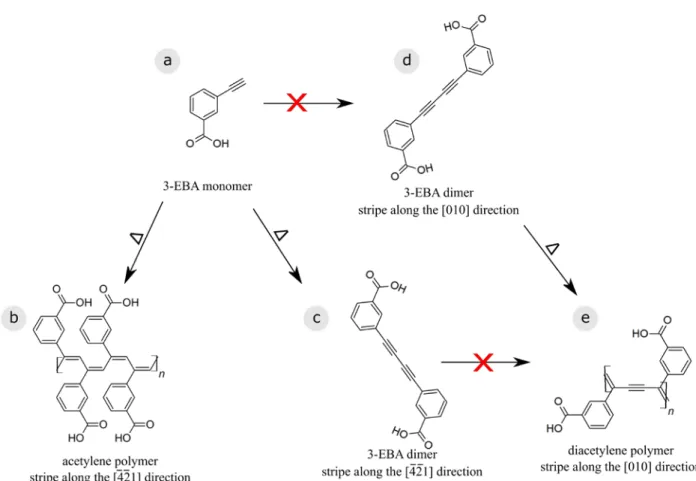
Figure 6. Overview of the reaction pathways of the 3-EBA monomer (a) on calcite (10.4).
Upon annealing, acetylene polymerization can be induced (b). The monomer can also form homo-coupled dimers. These dimers align side-by-side and form rows along the [-4-21] direction (c). Interestingly, in this arrangement, the dimers do not react further. When directly depositing the dimers, rows arranged in the [010] direction form (d). Only in this arrangement, the dimers undergo diacetylene polymerization (e).
Conclusion
In conclusion, by the interplay of dynamic AFM experiments and DFT computations we present
evidence for an acetylene polymerization carried out on a bulk insulator surface. The terminal
at 550 K results in the formation of stripes along the [-4-21] direction, which match excellently
match with cis-transoidal acetylene polymer chains. This assignment is further corroborated by
the DFT calculations, revealing that the acetylene polymerization is associated with an energy gain
of 1.1 eV per acetylene unit formed. Moreover, another type of stripe oriented along the [-4-21]
direction can be found that is identical to a structure formed upon direct deposition of the dimer.
Therefore, we assign these stripes to an arrangement of side-by-side aligned dimers.
Most interestingly, we find no evidence for a further reaction of the latter dimers to form a
diacetylene polymer. This is in sharp contrast to what has been found previously when directly
depositing the dimers. Thus, our result demonstrates that the constraint given by the specific
reaction pathway can effectively control the final product: When the dimer is deposited directly,
the diacetylene polymerization is induced. In sharp contrast, when the dimer is only formed in an
on-surface reaction from the monomer precursor, the diacetylene polymerization is effectively
prohibited. Our work provides a clear example of how the specific reaction pathway in on-surface
synthesis affects the final product.
AUTHOR INFORMATION
Corresponding Author
*kuehnle@uni-bielefeld.de
Conflicts of interest
ACKNOWLEDGMENT
We gratefully acknowledge financial support from the EU through grant PAMS (seventh
framework program GA 610446). Computing resources from the Aalto Science-IT project and
CSC IT Center for Science, Finland, are gratefully acknowledged. This work was furthermore
supported by the Academy of Finland through its Centres of Excellence Programme 2015–2017
under project number 284621, as well as project 314877. A.S.F. was supported by the World
Premier International Research Center Initiative (WPI), MEXT, Japan.
REFERENCES
1 A. Gourdon, Angew. Chem. Int. Ed., 2008, 47, 6950-6953.
2 R. Lindner and A. Kühnle, ChemPhysChem, 2015, 16, 1582-1592.
3 A. Richter, A. Floris, R. Bechstein, L. Kantorovich and A. Kühnle, J. Phys.: Condens.
Matter., 2018, 30, 133001.
4 G. Franc and A. Gourdon, Phys. Chem. Chem. Phys., 2011, 13, 14283-14292.
5 M. Treier, C. A. Pignedoli, T. Laino, R. Rieger, K. Müllen, D. Passerone and R. Fasel, Nat.
Chem., 2011, 3, 61-67.
6 J. I. Urgel, H. Hayashi, M. Di Giovannantonio, C. A. Pignedoli, S. Mishra, O. Deniz, M. Yamashita, T. Dienel, P. Ruffieux, H. Yamada and R. Fasel, J. Am. Chem. Soc., 2017, 139, 11658-11661.
7 C. Tönshoff and H. F. Bettinger, Angew. Chem. Int. Ed., 2010, 49, 4125-4128.
8 J. Krüger, F. García, F. Eisenhut, D. Skidin, J. M. Alonso, E. Guitián, D. Pérez, G. Cuniberti, F. Moresco and D. Peña, Angew. Chem. Int. Ed., 2017, 56, 11945-11948. 9 N. Pavliček, A. Mistry, Z. Majzik, N. Moll, G. Meyer, D. J. Fox and L. Gross, Nature
Nanotech., 2017, 12, 308–311.
10 E. Clar and D. G. Stewart, J. Am. Chem. Soc., 1953, 75, 2667-2672.
11 F. Para, F. Bocquet, L. Nony, C. Loppacher, M. Féron, F. Cherioux, D. Z. Gao, F. Federici Canova and M. B. Watkins, Nat. Chem., 2018, 10, 1112-1117.
12 A. J. Heeger, Angew. Chem. Int. Ed., 2001, 40, 2591-2611. 13 H. Shirakawa, Angew. Chem. Int. Ed., 2001, 40, 2574-2580. 14 A. G. MacDiarmid, Angew. Chem. Int. Ed., 2001, 40, 2581-2590.
15 D. J. Sandman, J. M. Njus and B. Tran, Macromol. Symp., 2004, 216, 77-85.
16 C. X. Wang, J. L. Chen, C. H. Shu, K. J. Shi and P. N. Liu, Phys. Chem. Chem. Phys., 2019, 21, 13222-13229.
17 J. Y. Dai, Q. T. Fan, T. Wang, J. Kuttner, G. Hilt, J. M. Gottfried and J. F. Zhu, Phys.
19 Y. Okawa and M. Aono, J. Chem. Phys., 2001, 115, 2317-2322.
20 A. Richter, V. Haapasilta, C. Venturini, R. Bechstein, A. Gourdon, A. S. Foster and A. Kühnle, Phys. Chem. Chem. Phys., 2017, 19, 15172-15176.
21 R. Lindner, P. Rahe, M. Kittelmann, A. Gourdon, R. Bechstein and A. Kühnle, Angew.
Chem. Int. Ed., 2014, 53, 7952-7955.
22 G. Wegner, Pure Appl. Chem., 1977, 49, 443-454.
23 K. Fahsi, J. Deschamps, K. Chougrani, L. Viau, B. Boury, A. Vioux, A. van der Lee and S. G. Dutremez, CrystEngComm, 2013, 15, 4261-4279.
24 C. Glaser, Ber. Dtsch. Chem. Ges., 1869, 2, 422-424.
25 F. Klappenberger, Y.-Q. Zhang, J. Björk, S. Klyatskaya, M. Ruben and J. V. Barth, Acc.
Chem. Res., 2015, 48
26 H.-Y. Y. Gao, J.-H. H. Franke, H. Wagner, D. Zhong, P.-A. A. Held, A. Studer and H. Fuchs, J. Phys. Chem. C, 2013, 117, 18595-18602.
27 H.-Y. Y. Gao, H. Wagner, D. Zhong, J.-H. Franke, A. Studer and H. Fuchs, Angew. Chem.
Int. Ed., 2013, 52, 4024-8.
28 H.-Y. Y. Gao, D. Zhong, H. Mönig, H. Wagner, P.-A. Held, A. Timmer, A. Studer and H. Fuchs, J. Phys. Chem. C, 2014, 118, 6272-6277.
29 J. Liu, Q. W. Chen, Q. L. He, Y. J. Zhang, X. Y. Fu, Y. F. Wang, D. H. Zhao, W. Chen, G. Q. Xu and K. Wu, Phys. Chem. Chem. Phys., 2018, 20, 11081-11088.
30 A. Richter, M. Vilas-Varela, D. Peña, R. Bechstein and A. Kühnle, Surf. Sci., 2018, 678, 106-111.
31 S. J. Landon, P. M. Shulman and G. L. Geoffroy, J. Am. Chem. Soc., 1985, 107, 6739-6740.
32 T. J. Katz and S. J. Lee, J. Am. Chem. Soc., 1980, 102, 422-424.
33 T. J. Katz, S. J. Lee and M. A. Shippey, J. Mol. Catal., 1980, 8, 219-226.
34 K. Judai, S. Abbet, A. S. Worz, A. M. Ferrari, L. Giordano, G. Pacchioni and U. Heiz, J.
Mol. Catal. Chem, 2003, 199, 103-113.
35 T. Masuda, Y. Kuwane, K. Yamamoto and T. Higashimura, Polymer Bulletin, 1980, 2, 823-827.
36 G. Natta and F. Danusso, Stereoregular Polymers and Stereospecific Polymerizations 1967: Pergamon, Elsevier.
37 A. Riss, S. Wickenburg, P. Gorman, L. Z. Tan, H. Z. Tsai, D. G. de Oteyza, Y. C. Chen, A. J. Bradley, M. M. Ugeda, G. Etkin, S. G. Louie, F. R. Fischer and M. F. Crommie, Nano
Lett., 2014, 14, 2251-2255.
38 D. A. Offermann, J. E. McKendrick, J. J. P. Sejberg, B. L. Mo, M. D. Holdom, B. A. Helm, R. J. Leatherbarrow, A. J. Beavil, B. J. Sutton and A. C. Spivey, J. Org. Chem., 2012, 77, 3197-3214.
39 E. Merkul, D. Urselmann and T. J. J. Müller, Eur. J. Org. Chem., 2011, 238-242.
40 W. B. Austin, N. Bilow, W. J. Kelleghan and K. S. Y. Lau, J. Org. Chem., 1981, 46, 2280-2286.
41 Y. S. Feng, C. Q. Xie, W. L. Qiao and H. J. Xu, Org. Lett., 2013, 15, 936-939.
42 L. F. Jones, M. E. Cochrane, B. D. Koivisto, D. A. Leigh, S. P. Perlepes, W. Wernsdorfer and E. K. Brechin, Inorg. Chim. Acta, 2008, 361, 3420-3426.
43 R. H. Pawle, V. Eastman and S. W. Thomas, J. Mater. Chem., 2011, 21, 14041-14047. 44 F. Loske, P. Rahe and A. Kühnle, Nanotechnology, 2009, 20, 264010.
46 D. M. Duffy and J. H. Harding, Langmuir, 2004, 20, 7630-7636.
47 See the ESI for a detailed discussion of other reasonable reaction pathways, in which we provide arguments for discarding all other obvious reaction products.
Electronic Supplementary Information to
“Impact of the reaction pathway on the final product
in on-surface synthesis”
Antje Kutz,a‡ Md Taibur Rahman,b‡ Ville Haapasilta,c Chiara Venturini,d Ralf Bechstein,b André
Gordon,d Adam S. Foster,c,e Angelika Kühnleb*
a Institute of Physical Chemistry, Johannes Gutenberg University Mainz, Duesbergweg 10-14,
55099 Mainz, Germany
b Physical Chemistry I, Faculty of Chemistry, Bielefeld University, Universitätsstraße 25, 33615
Bielefeld, Germany
c Department of Applied Physics, Aalto University, PO Box 11100, FI-00076 Aalto, Finland
d CNRS, CEMES, Nanoscience Group, BP 94347, 29 Rue J. Marvig, 31005 Toulouse, France
e WPI Nano Life Science Institute (WPI-NanoLSI), Kanazawa University, Kakuma-machi,
Kanazawa 920-1192, Japan
Synthesis of methyl 3-iodobenzoate1 I O MeO a c
To a round-bottomed flask were added 3-iodobenzoic acid (2 g, 8.06 mmol), some drops of conc. H2SO4 and MeOH (50 mL). The solution was heated under reflux overnight, then it was diluted
with diethyl ether and washed with H2O, a saturated solution of NaHCO3 and brine. The organic
phase was dried over MgSO4 and evaporated under vacuum. The product 7 (1.473 g) is a white
solid and was obtained with a yield of 69. 71 %.
1H-NMR (300 MHz, CDCl3): δ H 8.38 (1H, s, Ar-Ha), 8.02-7.99 (1H, m, Ar-H), 7.90-7.87 (1H, m,
Ar-H ) , 7.19 (1H, t, J = 7.8 Hz, Ar-Hc), 3.92 (3H, s, ˗OCH3).
Synthesis of methyl 3-ethynylbenzoate2-4
MeO
O a
c
Methyl 3-iodobenzoate (1 g, 3.8 mmol), CuI (29 mg, 1.52*10-1 mmol), Pd(PPh3)2Cl2 (53 mg,
7.55*10-1 mmol) were dissolved in degassed THF(10 mL) in a Schlenk flask. Then trimethylsilylacetylene (0.81 mL), NEt3 (1.06 mL) were added and degassed again for some
minutes. The solution was stirred at room temperature under argon atmosphere. After 3h (when the entire starting compound had reacted) were added TBAF in THF solution (7.65 mL) and some molecular sieves (3Å). The reaction was stirred under air atmosphere and at room temperature overnight. The mixture was then filtered on Celite, washing with Et2O. The residue was then
purified by column chromatography (SiO2, EtOAc/ hex 0.5 : 9.5) to afford the product (0.392 g,
64.13 %).
1H NMR (300 MHz, CDCl
3) δH 8.16 (1H, s, Ar-Ha), 8.03-8.00 (1H, m, Ar-H), 7.68-7.64 (1H, m,
Synthesis of 3-ethynylbenzoic acid5, 6,7
O HO
a c
Methyl 3-ethynylbenzoate (91 mg, 5.68*10-1 mmol) was dissolved in MeOH (1.5 mL) under
stirring and then a solution of LiOH (16 mg, 6.68*10-1 mmol) in H
2O (1.5 mL) was added to the
mixture. The reaction was stirred overnight. Then the solvent was removed in vacuum, then HCl 3M was added drop by drop until precipitate at pH 8; then adjusted at pH 2~3 and extracted with EtOAc. The organic phase was washed with brine and dried over an. MgSO4; removing of the
solvent in vacuum afforded the target compound (0.045 g, 54.20 %).
1H-NMR (300 MHz, CDCl3) δH 8.23 (1H, s, Ar-Ha), 8.10-8.06 (1H, m, Ar-H), 7.74-7.71 (1H, m,
Additional Image of Reaction Product
We have done the mentioned experiment more than 10 times and investigated a total area of
more than 50,000 nm2 on several calcite (10.4) surfaces. A further representative image is given
below.
Figure S1. AFM images of stripe-like structures formed by 3-EBA on calcite (10.4) upon
heating at 550 K for 10 hours (a). (b) Zoom into the image given in (a), the red arrow indicates a stripe, which has a length of approx. 80 nm.
Discussion of Reasonable other Reaction Products
To elucidate the nature of the majority stripes formed after annealing, we here discuss the
possible reaction pathways the precursor 3-EBA can undergo (Fig. S2).
Figure S2. (a) Overview of reaction pathways based on terminal alkynes, namely (a)
homocoupling of terminal alkynes with possible subsequent (b) diacetylene polymerization, (c) alkyne cyclotrimerization, (d) alkyne dimerization and (e) acetylene polymerization.
Firstly, the 3-EBA monomers can form straight dimers (Fig. S2a), which are known to
subsequently undergo a diacetylene polymerization reaction (Fig. S2b). Secondly, the 3-EBA
monomers can undergo a cyclo-trimerization reaction (Fig. S2c) or dimerization reactions that
acetylene polymerization (Fig. S2e). Next, we discuss the nature of the majority stripes observed
here upon annealing of 3-EBA on the basis of these reaction pathways. As detailed in the main
text, the majority stripes are oriented along the [-4-21] direction and show a periodicity of 0.4 nm
along this direction.
We discard option S2a, as we can directly compare with the outcome of our previous study:8
Previously reported AFM images of the straight dimer molecules
(3,3´-(1,3-butadiyne-1,4-diyl)bisbenzoic acid, 3-BBA) directly deposited onto calcite (10.4) revealed islands composed of
rows running along the [010] direction. As our stripes are aligned perpendicular to the [010]
direction, we discard this structure. However, in the previous work, we have observed that 3-BBA
molecules can form a second island structure that is composed of rows oriented along the [-4-21]
direction (see Fig. 5c in the main text). These rows, however, exhibit a periodicity of 0.8 nm along
the row direction, which does not match the 0.4 nm periodicity found here for the stripes. From
these experimental evidences, we conclude that the stripes are not composed of the straight dimers
(ruling out the option shown in Fig. S2a). Moreover, we performed DFT calculations to further
corroborate this experimental conclusion. To this end, we investigated whether the stripes could
be formed 3-BBA molecules arranged side-by-side. Our DFT calculations revealed that it is
energetically unfavorable for 3-BBA to be arranged side-by-side along the [-4-21] direction with
a periodicity of 0.4 nm, giving further evidence for the conclusion that the stripes are not formed
by side-by-side arranged molecular dimers.
As has been shown previously, the dimers can further react via a diacetylene polymerization
(Fig. S2b).8 The diacetylene polymer chain revealed a periodicity of 0.5 nm along the [010]
diacetylene polymer chain discards the option of the type A stripes being formed from diacetylene
polymers, as these two structures do not agree in orientation nor in periodicity.
Moreover, all non-straight and cyclic structures can be excluded, as the stripes observed here are
linear. Thus, we additionally discard the options shown in Figs. S2c and S2d.
References
1 D. A. Offermann, J. E. McKendrick, J. J. P. Sejberg, B. L. Mo, M. D. Holdom, B. A. Helm, R. J. Leatherbarrow, A. J. Beavil, B. J. Sutton and A. C. Spivey, J. Org. Chem., 2012, 77, 3197-3214.
2 E. Merkul, D. Urselmann and T. J. J. Müller, Eur. J. Org. Chem., 2011, 238-242.
3 W. B. Austin, N. Bilow, W. J. Kelleghan and K. S. Y. Lau, J. Org. Chem., 1981, 46, 2280-2286.
4 Y. S. Feng, C. Q. Xie, W. L. Qiao and H. J. Xu, Org. Lett., 2013, 15, 936-939.
5 L. F. Jones, M. E. Cochrane, B. D. Koivisto, D. A. Leigh, S. P. Perlepes, W. Wernsdorfer and E. K. Brechin, Inorg. Chim. Acta, 2008, 361, 3420-3426.
6 R. H. Pawle, V. Eastman and S. W. Thomas, J. Mater. Chem., 2011, 21, 14041-14047. 7 WO 2008/157844 Patent PCT/US2008/067951
8 A. Richter, V. Haapasilta, C. Venturini, R. Bechstein, A. Gourdon, A. S. Foster and A. Kühnle, Phys. Chem. Chem. Phys., 2017, 19, 15172-15176.

![Figure 4. Molecular structure obtained upon heating the sample for 1 h to 550 K. (a) Two different kind of stripes can be seen along the [-4-21] direction, marked by red and blue boxes, respectively](https://thumb-eu.123doks.com/thumbv2/123doknet/13708527.434200/11.918.171.761.372.560/figure-molecular-structure-obtained-heating-different-direction-respectively.webp)