HAL Id: hal-00295344
https://hal.archives-ouvertes.fr/hal-00295344
Submitted on 14 Oct 2003
HAL is a multi-disciplinary open access
archive for the deposit and dissemination of
sci-entific research documents, whether they are
pub-lished or not. The documents may come from
teaching and research institutions in France or
abroad, or from public or private research centers.
L’archive ouverte pluridisciplinaire HAL, est
destinée au dépôt et à la diffusion de documents
scientifiques de niveau recherche, publiés ou non,
émanant des établissements d’enseignement et de
recherche français ou étrangers, des laboratoires
publics ou privés.
monoxide in different air masses
M. de Reus, H. Fischer, F. Arnold, J. de Gouw, R. Holzinger, C. Warneke, J.
Williams
To cite this version:
M. de Reus, H. Fischer, F. Arnold, J. de Gouw, R. Holzinger, et al.. On the relationship between
acetone and carbon monoxide in different air masses. Atmospheric Chemistry and Physics, European
Geosciences Union, 2003, 3 (5), pp.1709-1723. �hal-00295344�
Chemistry
and Physics
On the relationship between acetone and carbon monoxide in
different air masses
M. de Reus1, H. Fischer1, F. Arnold3, J. de Gouw2, R. Holzinger1, C. Warneke2, and J. Williams1
1Max Planck Institute for Chemistry, Airchemistry Department, Mainz, Germany
2National Oceanic and Atmospheric Administration (NOAA), Aeronomy Laboratory, Boulder, USA 3Max Planck Institute for Nuclear Physics, Atmospheric Physics Division, Heidelberg, Germany Received: 18 December 2002 – Published in Atmos. Chem. Phys. Discuss.: 21 February 2003 Revised: 2 October 2003 – Accepted: 6 October 2003 – Published: 14 October 2003
Abstract. Carbon monoxide and acetone measurements are
presented for five aircraft measurement campaigns at mid-latitudes, polar and tropical regions in the northern hemi-sphere. Throughout all campaigns, free tropospheric air masses, which were influenced by anthropogenic emissions, showed a similar linear relation between acetone and CO, with a slope of 21–25 pptvacetone/ppbvCO. Measurements in the anthropogenically influenced marine boundary layer revealed a slope of 13–16 pptvacetone/ppbvCO. The differ-ent slopes observed in the marine boundary layer and the free troposphere indicate that acetone is emitted by the ocean in relatively clean air masses and taken up by the ocean in pol-luted air masses. In the lowermost stratosphere, a good cor-relation between acetone and CO was observed as well, how-ever, with a much smaller slope (∼5 pptvacetone/ppbvCO) compared to the troposphere. This is caused by the longer photochemical lifetime of CO compared to acetone in the lower stratosphere, due to the increasing photolytic loss of acetone and the decreasing OH concentration with altitude. No significant correlation between acetone and CO was ob-served over the tropical rain forest due to the large direct and indirect biogenic emissions of acetone.
The common slopes of the linear acetone-CO relation in various layers of the atmosphere, during five field experi-ments, makes them useful for model calculations. Often a single observation of the acetone-CO correlation, deter-mined from stratospheric measurements, has been used in box model applications. This study shows that different slopes have to be considered for marine boundary layer, free tropospheric and stratospheric air masses, and that the acetone-CO relation cannot be used for air masses which are strongly influenced by biogenic emissions.
Correspondence to: M. de Reus
1 Introduction
Acetone (CH3COCH3) is one of the most abundant partially oxidised hydrocarbons (POH) in the atmosphere. Its back-ground mixing ratio ranges between 200 pptvin the southern hemisphere and 500 pptvin the northern hemisphere (Singh et al., 1995). However, mixing ratios exceeding 2 ppbvin the free troposphere and 1 ppbv in the lower stratosphere have been observed (Wohlfrom et al., 1999; Arnold et al., 1997; P¨oschl et al., 2001). The major anthropogenic sources of ace-tone in the atmosphere are direct emissions and secondary production by the oxidation of hydrocarbons (i.e. propane, isobutane and isopentane). Biogenic sources include direct emissions from vegetation, decaying organic material and secondary production by the oxidation of biogenic hydro-carbons (e.g. monoterpenes). Moreover, biomass burning provides a source of acetone in the atmosphere (Singh et al., 1994; Jacob et al., 2002). Acetone is removed from the atmo-sphere by photolysis, the reaction with OH radicals and wet and dry deposition (Singh et al., 1994; Jacob et al., 2002).
The exchange of acetone with the ocean also plays an im-portant role in the acetone budget. For the global acetone budget, the ocean has to be considered as a source of acetone, however, oceans provide both a photochemical source and a microbial sink of acetone, depending on the geographical re-gion (Jacob et al., 2002). The uptake of acetone by the ocean in areas of upwelling water has been observed over the north-west Indian Ocean by Warneke and de Gouw (2001). Model calculations for the northern Indian Ocean region show an overestimation of acetone in polluted air masses (de Laat et al., 2001), which also points towards the uptake of acetone by the ocean. However, in relatively clean air (CO<100 ppbv), the acetone concentration was underestimated by the model and a marine acetone source had to be included to reproduce the acetone measurements (de Laat et al., 2001; Wisthaler et al., 2002).
In the presence of NOx, the photochemical breakdown of acetone produces peroxyacetylnitrate (PAN), a relatively unreactive reservoir species for NOx in the upper free tro-posphere. Furthermore, acetone can provide substantial amounts of OH and HO2radicals in the free troposphere that may contribute to ozone production (Singh et al., 1995; Mc-Keen et al., 1997). A good correlation has been observed between carbon monoxide and acetone mixing ratios dur-ing several field studies (Sdur-ingh et al., 1994; Mauzerall et al., 1998; Reiner et al., 2001), which points to common sources of CO and acetone. CO is a well known tracer for anthropogenic pollution and biomass burning, since it is pro-duced by incomplete combustion processes. Moreover, CO is mostly co-emitted with a large number of different hydro-carbons, and is, therefore, also related to the secondary pro-duction of acetone.
Since acetone is an important molecule in the chemistry of the atmosphere, it should be considered in model calcula-tions. In global models, emissions of acetone are mostly ex-plicitly described, whereas in box model studies the model is generally constrained to measurements. Since acetone mea-surements are not always available, the correlation between acetone and CO is often used for model initialisation (McK-een et al., 1997; Keim et al., 1999; Frost et al., 2002).
This paper deals with the acetone-CO correlation observed during different aircraft measurement campaigns. A com-mon linear correlation is defined for various air masses, which could be used in future model calculations.
2 Experiments and instrumentation
In this paper carbon monoxide and acetone measurements during different airborne measurement campaigns are pre-sented. A short description of the measurement campaigns and applied instruments is given below. The Mediterranean Intensive Oxidant Study, MINOS, took place in August 2001 from Crete, Greece. The main goal of the measurements was to determine anthropogenic pollution transport over the Mediterranean. Airborne measurements were performed on the Falcon aircraft, operated by the German Aerospace Cen-tre (DLR) (Lelieveld et al., 2002). The other campaigns, presented below, have been performed using a Cessna Cita-tion aircraft, operated by the Technical University Delft, the Netherlands. Both aircraft have a vertical range of 12–13 km. The Indian Ocean Experiment, INDOEX, was carried out in February and March 1999 from the Maldives. It fo-cussed on the transport of anthropogenic pollutants, originat-ing from south and southeast Asia, over the northern Indian Ocean (Lelieveld et al., 2001).
The Cooperative LBA (Large-scale Biosphere-atmosphere experiment in Amazonia) Airborne Regional Experiment, LBA-CLAIRE, was organised to study biogenic emissions from the tropical rain forest. Therefore, research flights were
performed over the Amazon rain forest from Paramaribo, Surinam, in March 1998 (Crutzen et al., 2000).
Moreover, data from two STREAM (Stratosphere Tro-posphere Experiment by Aircraft Measurements) cam-paigns are included, STREAM98 and STREAM97. The STREAM98 campaign focussed on long range transport of biomass burning emissions and was performed from Timmins, Canada, in July 1998 (Fischer et al., 2002). STREAM97 focussed on ozone depletion in the spring Arctic lowermost stratosphere and took place in March 1997 from Kiruna, Sweden (Fischer et al., 2000).
During all campaigns, carbon monoxide was measured us-ing a tunable diode laser absorption spectrometer (TDLAS). This instrument is optimised for airborne measurements and is described in detail by Wienhold et al. (1998) and Kormann et al. (2002). In-situ calibrations have been performed dur-ing all flights against workdur-ing standards consistdur-ing of com-pressed air. These were cross-calibrated before and after the campaigns against National Oceanic and Atmospheric Ad-ministration (NOAA) standards using gas chromatography. The accuracy and precision of the CO measurements for the various measurement campaigns are given in Table 1.
Acetone measurements were performed using a proton-transfer-reaction mass spectrometer (PTR-MS) and a chem-ical ionisation mass spectrometer (CIMS). In both instru-ments, acetone is chemically ionised by the proton trans-fer with H3O+ ions and the products are detected with a quadrupole mass spectrometer (Lindinger et al., 1998; M¨ohler et al., 1993). The CIMS instrument has been used during both STREAM campaigns, the PTR-MS in-strument throughout the other campaigns. No in-flight cal-ibrations were performed for the acetone measurements. The sensitivity of the CIMS instrument during STREAM97 and STREAM98 and the PTR-MS instrument during LBA-CLAIRE has been calculated from the rate constant of the re-action of acetone with H3O+ions and the reaction time. The sensitivity of the PTR-MS has been tested in the laboratory after the LBA-CLAIRE campaign, resulting in an accuracy of 30% (Warneke et al., 2001). During INDOEX and MI-NOS, the PTR-MS instrument was calibrated prior to and af-ter the campaign using a standard mixture containing a num-ber of volatile organic compounds (VOCs) in N2(de Gouw et al., 2001). During MINOS, an additional calibration was performed in the field. In-flight background measurements were performed for the PTR-MS on a regular basis by pass-ing the sample air through a charcoal filter (LBA-CLAIRE and INDOEX) or a thermal platinum converter (MINOS). This background has been subtracted from the measured sig-nal to obtain the atmospheric mixing ratio.
At high ambient water vapour mixing ratios, occurring in the boundary layer and lower free troposphere, the reverse reaction of the protonated acetone complex in the flow tube of the CIMS instrument becomes important, leading to an underestimation of the observed acetone mixing ratio. A correction for this reverse reaction has been applied to the
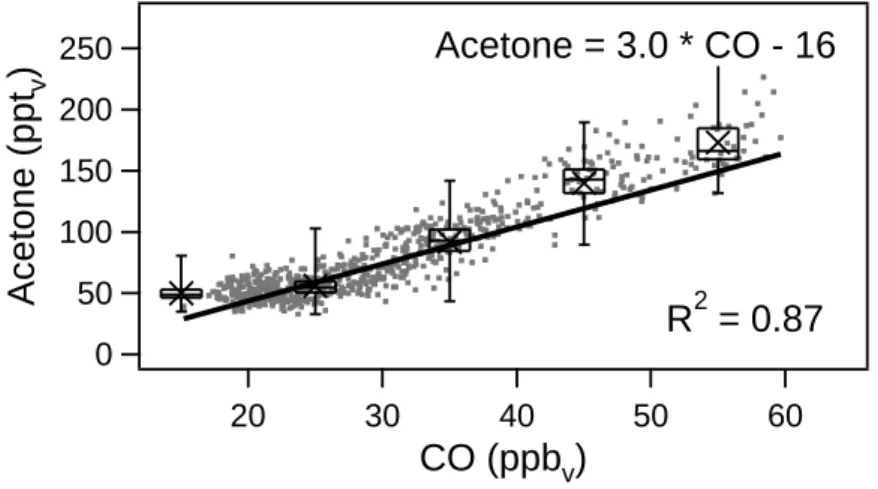
Table 1. Measurement technique, accuracy of the standard used for the calibration of the instrument, precision and responsible institutes for
the CO and acetone measurements during the measurement campaigns presented in this study
Campaign CO accuracy of standard precision Acetone accuracyof standard precision STREAM97 TDLAS1 1% 2% CIMS2 40% 10% LBA-CLAIRE TDLAS1 3% 2% PTRMS3 30% 20% STREAM98 TDLAS1 1.3% 2.5% CIMS2 30% 20–40%∗ INDOEX TDLAS1 10% 10% PTRMS4 20% 20% MINOS TDLAS1 1% 1.5 ppbv PTRMS4 20% 20%
∗precision dependent on the H
2O partial pressure, we used 20% for the stratospheric measurements and 40% for the tropospheric
measurements.
Measurements performed by the:
1Max Planck Institute for Chemistry, Mainz, Germany.
2Max Planck Institute for Nuclear Physics, Heidelberg, Germany. 3University of Innsbruck, Austria.
4Institute for Marine and Atmospheric Research Utrecht, The Netherlands.
STREAM98 data using the simultaneous measured acetoni-trile mixing ratio (Wohlfrom et al., 1999). This reverse reac-tion did not play a significant role in STREAM97, since the measurements were mainly performed in the stratosphere, where the water vapour mixing ratio was very low (Schnei-der, 1997). No significant dependence of the PTR-MS ace-tone measurements on ambient relative humidity was found in laboratory studies (Warneke et al., 2001). The accuracy, precision and the institutes responsible for the acetone mea-surements during the different campaigns are listed in Ta-ble 1.
The different techniques to measure acetone in the at-mosphere have been compared during several measurement campaigns. Sprung et al. (2001) describe an intercompari-son between the acetone measurements using a CIMS and a PTR-MS instrument, which were deployed on the C130 air-craft during INDOEX. They found that the PTR-MS showed slightly higher acetone mixing ratios than the CIMS. The agreement between the two instruments was within 20%, which is smaller than the accuracy of each individual instru-ment. An intercomparison between two differently config-ured PTR-MS instruments, which were deployed on the Fal-con aircraft during MINOS, shows excellent agreement in acetone mixing ratios measured by the two PTR-MS instru-ments (de Gouw et al., manuscript in preparation). Finally, acetone measurements performed with a CIMS instrument have been compared with those from an in-situ gas chromato-graph (GC), which were flown on two different aircrafts dur-ing SONEX (Wohlfrom et al., 1999; Sdur-ingh et al., 2000). The authors concluded that both data sets were consistent with each other within the uncertainty limits of the individual in-struments, however, in the stratosphere the CIMS data tended to be higher than the GC by up to a factor 2.
3 Results
In this section correlation plots of acetone and carbon monoxide are shown for various aircraft measurement cam-paigns. In all graphs, the carbon monoxide mixing ratio is plotted in ppbv on the x-axis and acetone in pptv on the y-axis. Hence, the slope of the linear relation between acetone and CO is expressed in pptv acetone/ppbv CO. A straight line fit, taking into account measurement errors in both co-ordinates, is used to determine the linear correlation between acetone and CO (Numerical recipes, Sect. 15.3) (Press et al., 1992). The measurement error or total uncertainty has been calculated by the square root of the sum of the squares of the precision and the calibration accuracy of the CO and acetone measurements as given in Table 1. Since this is a percentage of the measured concentration, the absolute measurement er-ror (in ppbvor pptv) increases with increasing concentration, giving more weight to data points with lower concentrations in the linear fit. All data shown in this paper are 15 s averaged values.
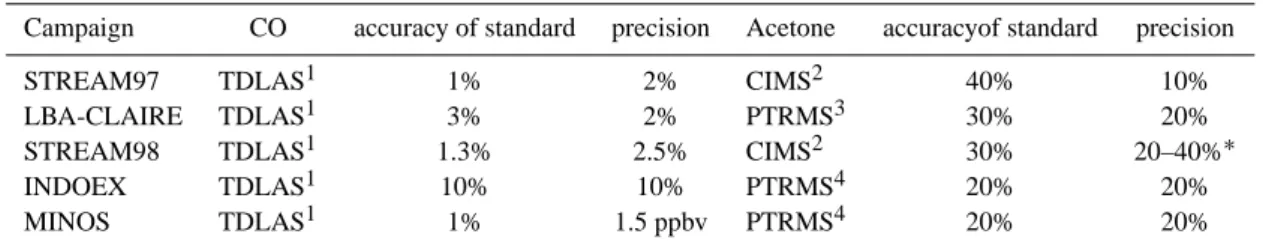
Figure 1a shows the acetone and CO mixing ratios, ob-served during MINOS, including a linear fit through the data. The acetone and CO mixing ratios correlate very well, which is evident from the high linear correlation co-efficient (R2=0.81). The slope of the linear fit was 19.8 pptv acetone/ppbvCO.
Figures 1b–d show the acetone and CO mixing ratios for different subsets of the data, i.e. the marine boundary layer (b), free troposphere (c) and lowermost stratosphere (d). In the marine boundary layer (0–1 km altitude) and the free troposphere (1–12.5 km) the correlation coefficient was high, indicating common sources for acetone and CO. The slope of the linear relation between acetone and CO was 13.5 pptvacetone/ppbvCO in the marine boundary layer
1000
800
600
400
200
Acetone (ppt
v)
60
55
50
45
40
CO (ppb
v)
d
Acetone = 7.1 * CO + 151
R
2= 0.10
5000
4000
3000
2000
1000
0
Acetone (ppt
v)
200
160
120
80
c
Acetone = 21.8 * CO - 762
R
2= 0.77
5000
4000
3000
2000
1000
0
Acetone (ppt
v)
200
150
100
50
a
Acetone = 19.8 * CO - 596
R
2= 0.81
4000
3000
2000
1000
Acetone (ppt
v)
200
180
160
140
120
100
b
Acetone = 13.5 * CO + 369
R
2= 0.59
Fig. 1. Acetone and CO mixing ra-tios observed during the MINOS cam-paign (grey dots) and the linear correla-tion between the two trace gases (solid line). Figure (a) shows all data, (b) data from the marine boundary layer (0–1 km), (c) the free troposphere (1– 12.5 km) and (d) the lower stratosphere (O3>150 ppbv; CO<60 ppbv). The
boxes indicate the 33% and 67% per-centiles, the whiskers the minimum and maximum value, the line the median and the cross the mean acetone mix-ing ratio for a certain CO interval. The slope and intercept (±σ ) of the correla-tions are presented in Table 2.
4000 3000 2000 1000
Acetone (ppt
v)
250 200 150 100a
Acetone = 16.2 * CO - 770
R
2= 0.35
4000 3000 2000 1000 0Acetone (ppt
v)
250 200 150 100 50CO (ppb
v)
b
Acetone = 21.6 * CO - 1692
R
2= 0.45
Fig. 2. Acetone and CO mixing ratios observed in the (a) marine boundary layer (0–1 km) and (b) free troposphere (1–12.5 km) during
INDOEX.
(R2=0.59) and 21.8 pptvacetone/ppbvCO in the free tropo-sphere (R2=0.77). The smaller slope in the marine boundary layer might reflect either the longer lifetime of acetone in the marine boundary layer compared to the free troposphere or an interaction with the ocean, which will be addressed in more detail in the discussion section.
On a few occasions stratospheric air masses were sam-pled, which were characterised by ozone mixing ratios above 150 ppbvand CO mixing ratios below 60 ppbv. In the lower-most stratosphere, the slope of the linear correlation between acetone and CO was much lower than in the troposphere (7.1 pptvacetone/ppbvCO), which is caused by the absence of significant sources for CO and acetone in the stratosphere and the longer lifetime of CO compared to acetone, due to the increasing photolysis of acetone with altitude. The rela-tively low correlation coefficient (R2=0.10) is probably due to the limited amount of data points in the stratosphere and the poor precision of the acetone measurements due to the low mixing ratios.
Also during INDOEX, acetone and CO mixing ratios were very well correlated (see Fig. 2). Measurements have been performed in the marine boundary layer (0–1 km altitude) and the free troposphere (1–12.5 km altitude). The slope of the linear fit was 16.2 pptv acetone/ppbv CO in the marine
boundary layer (R2=0.35) and 21.6 pptvacetone/ppbvCO in the free troposphere (R2=0.45).
Both the INDOEX and MINOS campaigns were per-formed downwind of major anthropogenic pollution sources, which resulted in a highly polluted boundary layer (de Gouw et al., 2001; Lelieveld et al., 2002). Air masses observed in the marine boundary layer over the northern Indian Ocean during INDOEX originated from the Indian subcontinent and Southeast Asia. Numerous convective systems over the northern Indian Ocean caused the pollution from the marine boundary layer to be mixed up into the free troposphere (de Reus et al., 2001). De Gouw et al. (2001) determined the age of the pollution plumes observed during INDOEX using acetylene/ethane and benzene/ethane ratios. The age of the air masses observed in the marine boundary layer over the Indian Ocean ranged between 4 and 15 days. In the free tro-posphere similar air mass ages were found since convection lifted the relative fresh pollution from the marine boundary layer to the middle free troposphere.
During MINOS, anthropogenic pollution was observed in the marine boundary layer originating from eastern and west-ern Europe. The air masses in the free troposphere over the Mediterranean were influenced by long range transport of pollutants from the US, Europe and Asia (Lelieveld et
1500
1000
500
0
Acetone (ppt
v)
60
50
40
30
20
10
CO (ppb
v)
Acetone = 5.6 * CO + 89
R
2= 0.40
b
5000
4000
3000
2000
1000
0
Acetone (ppt
v)
200
180
160
140
120
100
80
60
R
2= 0.58
Acetone = 24.4 * CO - 1105
a
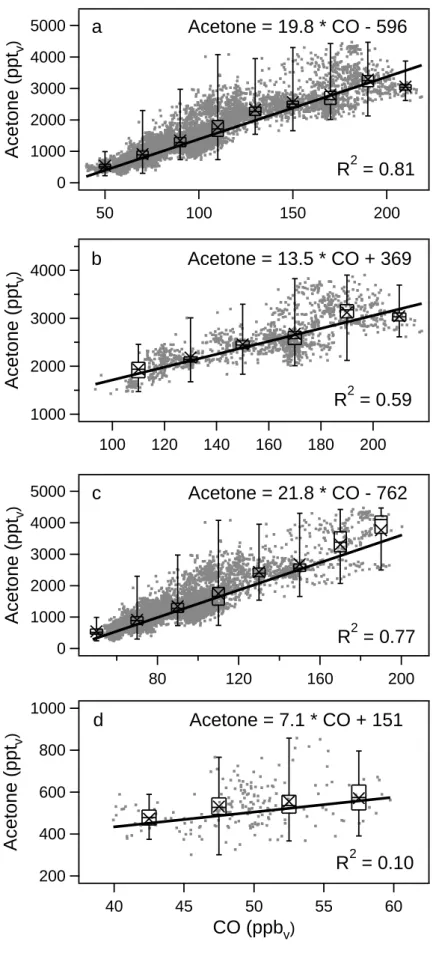
Fig. 3. Acetone and CO mixing ratios observed in the (a) free troposphere (>7 km) and (b) lower stratosphere (O3>150 ppbv; CO<60 ppbv)
during STREAM98. The open circles represent measurements which were strongly influenced by tropospheric mixing.
al., 2002; Traub et al., 2003). Salisbury et al. (2003) cal-culated the age of the air masses in the marine boundary layer using the toluene/benzene ratio from observations at the ground based station on Crete during the MINOS campaign and compared those with back trajectory calculations. They found that during the entire campaign the air mass age was below 30 hours. Since the aircraft performed its measure-ments north of the island of Crete, the air masses observed by the aircraft in the marine boundary layer have a maxi-mum age of 30 hours. Scheeren et al. (2003) investigated the Southeast Asian air masses which dominated the free tropo-sphere in the first half of the campaign. They determined a chemical age of these air masses of 7–15 days, based on the comparison of emission ratios from MINOS with emis-sion ratios derived from INDOEX results and back trajec-tory calculations. The trajectrajec-tory analysis also showed that North American pollution plumes were observed occasion-ally, which were lifted from below 700 hPa between 5 and 10 days prior to the measurements. Moreover, recent convec-tive injection of European boundary layer air was observed during two flights.
Hence, the air masses observed in the free troposphere over the Indian Ocean and the Mediterranean Sea were in-fluenced by anthropogenic pollution and had a chemical age between a few days and 15 days. Apparently, within 15 days the signature of the linear relation between acetone and CO does not change significantly. In the free troposphere, the lifetime of acetone is shorter than the CO lifetime, due to the photolysis of acetone. In order to keep the acetone-CO relation stable over a time period of 15 days, secondary pro-duction of acetone has to compensate for the loss of acetone. This is further examined in the discussions section.
Although younger air masses were sampled in the marine boundary layer over the Mediterranean than over the northern Indian Ocean, a similar correlation between acetone and CO was observed. The major sources of CO over the northern In-dian Ocean were biomass and biofuel burning (Lelieveld et al., 2001), whereas fossil fuel burning was the major source of CO in the marine boundary layer over the Mediterranean (Lelieveld et al., 2002). During STREAM98, measurements between 7 and 12.5 km altitude were performed. Air masses with ozone mixing ratios exceeding 150 ppbvand CO mix-ing ratios below 60 ppbvwere considered to be stratospheric,
250
200
150
100
50
0
Acetone (ppt
v)
60
50
40
30
20
CO (ppb
v)
R
2= 0.87
Acetone = 3.0 * CO - 16
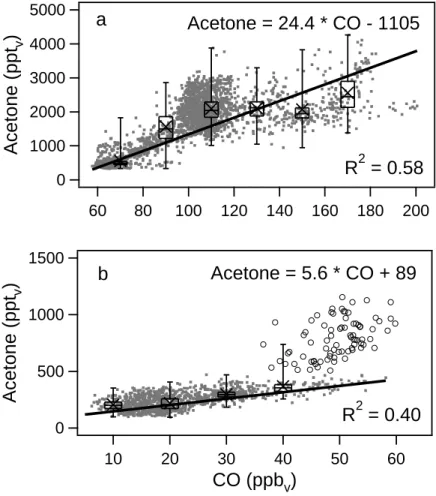
Fig. 4. Acetone and CO mixing ratios observed in the lower stratosphere (O3>150 ppbv; CO<60 ppbv) during STREAM97.
Table 2. Slope (in pptvacetone/ppbvCO ±1σ ) and intercept (in pptvacetone ±1σ ) of the linear correlation between acetone and CO during
different measurement campaigns
Campaign Operational base Time period Marine boundary layer Free troposphere Stratosphere STREAM97 Kiruna, March 1997 – – 3.0±0.15
Sweden −16±3.8
LBA-CLAIRE Paramaribo, March 1998 No correlation No correlation – Surinam
STREAM98 Timmins, July 1998 – 24.4±0.48 5.6±0.32
Canada −1105±34 89±5.5
INDOEX Male, Feb/Mar 1999 16.2±0.85 21.6±0.41 – Maldives −770±120 −1692±44
MINOS Crete, July 2001 13.5±0.70 21.8±0.22 7.1±2.5 Greece 369±104 −762±18 151±125
all other air masses tropospheric. The observed acetone and CO mixing ratios in the free troposphere and stratosphere are shown in Fig. 3. In both parts of the atmosphere ace-tone and CO were well correlated. The slope of the cor-relation was, however, very different. For the stratosphere a slope of 5.6 pptv acetone/ppbv CO was found (R2=0.40), for the troposphere 24.4 pptv acetone/ppbv CO (R2=0.58). During STREAM98 intensive mixing occurred between the lower stratosphere and the upper troposphere (Hoor et al., 2002). The open circles in Fig. 3b represent air masses with relatively high acetone mixing ratios which were ob-served at stratospheric O3and CO mixing ratios. For these data points the linear relation between acetone and CO de-scribes a slope of 17.3±8.2 pptvacetone/ppbvCO (R2=0.23). Hence, these stratospheric air masses show a strong tropo-spheric influence and have not been taken into account when calculating the linear relation between acetone and CO in the stratosphere. The air masses observed in the free tro-posphere during STREAM98 originated from polar-, mid-and (sub)tropical latitudes. The chemical age of these air masses has been determined by Fischer et al. (2002)
us-ing the C2H2/CO ratio. Air masses originating from polar-and mid-latitudes were 5–7 days old. Trajectory analysis shows that air masses originating from (sub)tropical latitudes were transported a few days before reaching the measure-ment area.
Further stratospheric measurements were performed dur-ing STREAM97. Since this campaign focussed on ozone de-pletion in the lowermost stratosphere, mainly stratospheric measurements are available (O3>150 ppbv; CO<60 ppbv). The linear correlation between acetone and CO had a slope of 3.0 (R2=0.87; see Fig. 4) (see also Schneider, 1997). A significant correlation between acetone and CO is not always observed, as is shown for the LBA-CLAIRE campaign. The LBA-CLAIRE measurements were conducted in the bound-ary layer (0–1 km) and free troposphere (1–12.5 km) over the Amazon rain forest and are shown in Figs. 5a and b. The squared correlation coefficient for the linear relation between acetone and CO was 0.06 in the boundary layer and 0.002 in the free troposphere, and hence, the correlation between acetone and CO was not significant.
8000 6000 4000 2000 0
Acetone (ppt
v)
250 200 150 100CO (ppb
v)
R
2= 0.002
b
8000 6000 4000 2000 0Acetone (ppt
v)
170 160 150 140 130 120 110CO (ppb
v)
R
2= 0.06
a
Fig. 5. Acetone and CO mixing ratios observed in (a) the boundary layer (0–1 km) and (b) free troposphere (1–12.5 km) over the tropical
rain forest during LBA-CLAIRE. The open circles represent measurements in the marine boundary layer (a) and in an upper tropospheric biomass burning plume (b).
The boundary layer over Surinam, a largely unpolluted re-gion, is influenced by northeasterly trade winds, which ad-vect air from the Atlantic Ocean over the Amazonian rain for-est towards the ITCZ. The air masses over the Surinam rain forest are, hence, not anthropogenically influenced but are mainly subject to biogenic emissions. It is well established that acetone has significant biogenic sources (Crutzen et al., 2000). Large emissions of acetone or acetone precursors (e.g. monoterpenes) can occur from vegetation and/or decaying litter in the tropical rainforests (Warneke et al., 1999; P¨oschl et al., 2001). This is evident from the relatively high ace-tone mixing ratios observed during LBA-CLAIRE. Carbon monoxide has predominantly anthropogenic sources, which explains the lack of correlation between acetone and CO in areas with strong biogenic emissions. Shallow and deep con-vective clouds, which were prevalent over the rain forest dur-ing the entire measurement period, transported the biogenic emissions to the free troposphere, hence, also the air in the free troposphere was strongly influenced by biogenic emis-sions and no significant correlation between acetone and CO was found. Measurements in the marine boundary layer, off
the coast of Surinam, and in a biomass burning plume, which was encountered during one flight in the upper free tropo-sphere (Andreae et al., 2001; Williams et al, 2001), were not included in the calculation of the linear relation between acetone and CO. These data points are displayed as open cir-cles in Fig. 5a and b. It can clearly be seen that air masses with a different origin, as the biomass burning plume, show a different correlation. Although the biomass burning plume was encountered during a relatively short time period, yield-ing only a few data points, a correlation between acetone and CO can be envisioned. The slope of the linear rela-tion is 18.2 pptv acetone/ppbvCO (R2=0.19), similar to the slope which has been found in the free troposphere during other experiments. Andreae et al. (2001) calculated an en-hancement ratio of 19.5±1.6 pptvacetone/ppbvCO for this biomass burning plume. The high acetone mixing ratios ob-served in the marine boundary layer might result from the production of acetone by the ocean or long range transport of continental air over the ocean.
A summary of the observed correlations during the above described measurement campaigns is given in Table 2.
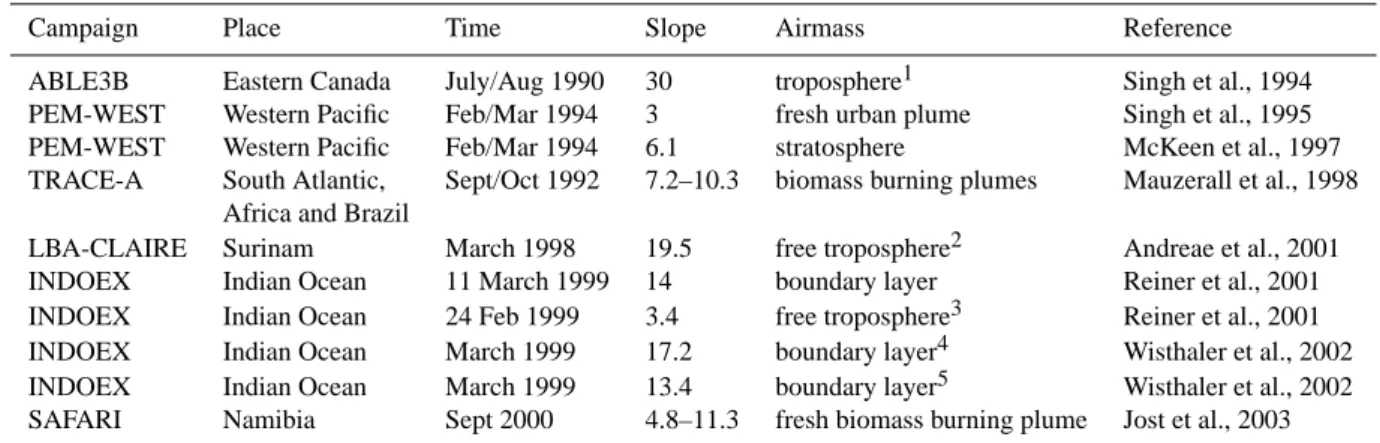
Table 3. Slope of the linear correlation between acetone and CO reported in the literature (in pptvacetone/ppbvCO)
Campaign Place Time Slope Airmass Reference ABLE3B Eastern Canada July/Aug 1990 30 troposphere1 Singh et al., 1994 PEM-WEST Western Pacific Feb/Mar 1994 3 fresh urban plume Singh et al., 1995 PEM-WEST Western Pacific Feb/Mar 1994 6.1 stratosphere McKeen et al., 1997 TRACE-A South Atlantic, Sept/Oct 1992 7.2–10.3 biomass burning plumes Mauzerall et al., 1998
Africa and Brazil
LBA-CLAIRE Surinam March 1998 19.5 free troposphere2 Andreae et al., 2001 INDOEX Indian Ocean 11 March 1999 14 boundary layer Reiner et al., 2001 INDOEX Indian Ocean 24 Feb 1999 3.4 free troposphere3 Reiner et al., 2001 INDOEX Indian Ocean March 1999 17.2 boundary layer4 Wisthaler et al., 2002 INDOEX Indian Ocean March 1999 13.4 boundary layer5 Wisthaler et al., 2002 SAFARI Namibia Sept 2000 4.8–11.3 fresh biomass burning plume Jost et al., 2003
1Measurements between 0 and 6 km altitude. 2Aged biomass burning plume.
3These measurements were partly performed in the southern hemisphere. 4Air masses originating from the west coast of India.
5Air masses originating from the Bay of Bengal.
4 Comparison with literature values
A positive correlation between acetone and CO has been de-scribed by several authors. Singh et al. (1994) were the first to show a strong correlation between acetone and CO mixing ratios in the atmosphere. They derived a linear relation be-tween acetone and CO with a slope of 30 pptvacetone/ppbv CO during the Arctic Boundary Layer Experiment (ABLE-3B) between 0 and 6 km altitude. The authors also noted the striking difference between the enhancement ratio in indus-trial plumes and in aged air masses, due to the secondary production of acetone from hydrocarbons.
The slope, which has been used frequently to initialise acetone mixing ratios in model calculations, is 6.1 pptv acetone/ppbv CO (e.g. McKeen et al., 1997; Keim et al., 1999; Frost et al., 2002), and has been observed in the strato-sphere during PEM-WEST B. This slope is based on data published by Singh et al. (1997), however, the linear rela-tion is described by McKeen et al. (1997). During the same experiment an enhancement ratio of 3 pptvacetone/ppbvCO was found in a plume of relatively fresh Asian emissions over the western Pacific (Singh et al., 1995).
Some values for the slope of the linear relation between acetone and CO are published for the INDOEX campaign. Reiner et al., (2001) observed a slope of 14 pptvacetone/ppbv CO for a measurement flight of the NCAR-C130 aircraft in the marine boundary layer during INDOEX. Another flight in the free troposphere, which was for a large part conducted in the southern hemisphere, indicated a slope of 3.4 pptv acetone/ppbv CO. In a third case study they analysed the acetone-CO relation for the residual boundary layer, a pol-luted layer between 2 and 4 km altitude, containing
rela-tively fresh biomass and fossil fuel burning emissions. In this layer, the slope ranged between 8.8 and 11 pptvacetone/ppbv CO, which is comparable to the acetone-CO enhancement ratio observed in biomass burning plumes during TRACE-A (Mauzerall et al., 1998).
A large range of enhancement factors have been observed in biomass burning plumes, depending on the age of the plume. In laboratory experiments very young plumes can be investigated, and hence, direct emissions from biomass burning can be determined. Holzinger et al. (1999) found an enhancement factor of 5.4 pptvacetone/ppbvCO from a laboratory biomass burning experiment. Jost et al. (2003) performed in-situ measurements over a very young biomass burning plume in Namibia, with a plume age up to about 2 hours. They found the acetone enhancement ratio to increase with air mass age from 4.8 pptv acetone/ppbv CO directly over the fire to 11.3 pptvacetone/ppbvCO in a biomass burn-ing plume with an age of about 2 hours, indicatburn-ing the im-portance of secondary production of acetone in the biomass burning plume. More aged biomass burning plumes, which were analysed in the boundary layer and free troposphere over the tropical south Atlantic Ocean showed an enhance-ment ratio of 7.2–10.3 pptv acetone/ppbv CO for plumes which were between 0.5 and about 6 days old, whereas no significant enhancement was observed in a very young plume (Mauzerall et al., 1998). An even older biomass burning plume was investigated by Andreae et al. (2001) in the upper free troposphere over the Amazonian rainforest. They cal-culated the acetone enhancement factor to be 19.5±1.6 pptv acetone/ppbvCO and the plume age 9–10 days.
Wisthaler et al. (2002) presented shipborne measurements in the marine boundary layer over the northern Indian Ocean
3000 2000 1000 0
Acetone (ppt
v)
200 150 100 50 0CO (ppb
v)
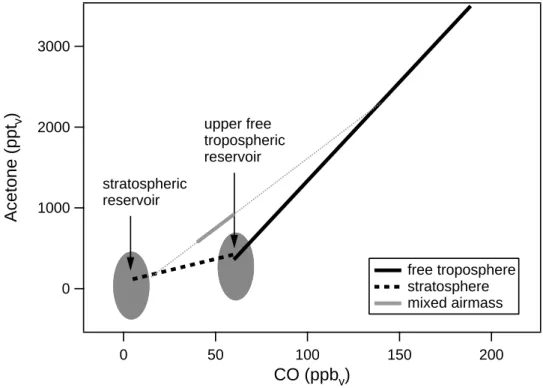
free troposphere stratosphere mixed airmass upper free tropospheric reservoir stratospheric reservoirFig. 6. Acetone-CO correlations observed during STREAM98. The grey solid line represents the acetone-CO correlation which was found in
stratospheric air masses with a strong tropospheric influence (mixed air masses). The grey dashed line shows the mixing line corresponding to these air masses.
during INDOEX. They subdivided the data into air masses originating from the west-coast of India and from the Bay of Bengal and found a slope of 17.2 and 13.4 pptvacetone/ppbv CO, respectively. Table 3 gives a summary of the slope of the acetone-CO correlation found in the literature.
5 Discussion
A striking result of this study is the comparable slope of the linear acetone-CO relation in the anthropogenically in-fluenced free troposphere and marine boundary layer, in very different regions of the world and at very different time peri-ods of the year.
First of all we have to address the question why a corre-lation between acetone and CO is observed at all. The most simple explanation is that in anthropogenically polluted ar-eas, although CO and acetone might have different physical sources, the emission distribution is very similar, leading to a good correlation between acetone and CO mixing ratios. This has also been observed in fresh urban emission plumes (Singh et al., 1995). Fresh anthropogenic and biomass burn-ing emissions, however, show a much smaller slope than aged plumes, indicating the importance of secondary acetone production from higher hydrocarbons, which is discussed in detail below. In order to maintain a good correlation, these hydrocarbons should have similar source patterns as CO.
Moreover, mixing of air masses, originating from very dif-ferent “reservoirs”, can also cause a linear relation between two trace gases. To illustrate this, the linear correlations which we observed during the STREAM98 campaign are plotted in Fig. 6. The observed correlation between acetone and CO in the stratosphere can be explained by mixing an air mass from the stratospheric reservoir, containing low ace-tone and CO mixing ratios, with an air mass from the upper free tropospheric reservoir, which contains higher acetone and CO mixing ratios. Moreover, the acetone-CO correlation in the mixed air masses, which have been described in Sect. 3 and are shown as open circles in Fig. 3b, can be explained by mixing of a stratospheric air mass with a free tropospheric air mass originating from much lower altitude. However, for the troposphere no clear reservoirs exist which could explain the observed slopes in the marine boundary layer and the free troposphere (see Fig. 8).
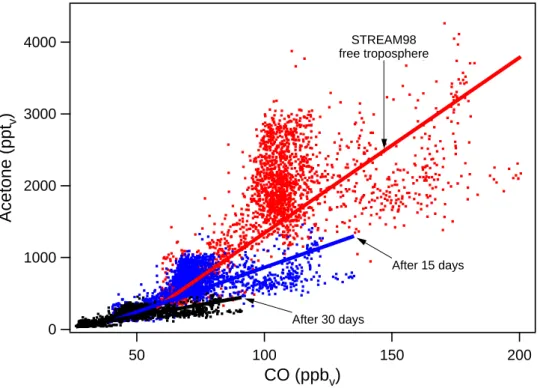
Due to the difference in lifetime of acetone and CO, espe-cially in the free troposphere, the slope of the linear relation should decrease with air mass age. To illustrate this we cal-culated the change in the slope of the linear acetone-CO re-lation observed in the free troposphere during STREAM98, considering a CO and acetone lifetime of 38 and 14 days, re-spectively. These lifetimes have been calculated based on the depletion of CO and acetone through their reaction with OH, assuming an OH concentration of 1.7·106molecules/cm3, and the destruction of acetone through photolysis. The OH
4000 3000 2000 1000 0
Acetone (ppt
v)
200 150 100 50CO (ppb
v)
STREAM98 free troposphere After 15 days After 30 daysFig. 7. Acetone-CO correlation observed in the free troposphere during STREAM98 (red line and markers). Acetone-CO correlation after
15 (blue) and 30 days (black), assuming a lifetime of CO and acetone of 38 and 14 days, respectively.
reaction rates have been adopted from DeMore et al. (1997) and Wollenhaupt et al. (2000), the photolysis rates from Br¨uhl and Crutzen (1989). An exponential decay has been assumed using the lifetime as e-folding time. The results are shown in Fig. 7. The observed slope of the acetone-CO relation in the free troposphere during STREAM98 was 24.4 pptv acetone/ppbv CO. After 15 days this slope has decreased to 11.7 pptv acetone/ppbv and after 30 days to 6.3 pptv acetone/ppbv CO, which is close to the observed slope in the stratosphere. Note that only depletion of both gases is considered and no production or additional emission has been taken into account.
The air mass age of the free tropospheric air masses ob-served during INDOEX, STREAM98 and MINOS ranged between 4 and 15 days. According to the calculations above, there should be an additional source of acetone in the free troposphere to prevent the slope of the linear acetone-CO re-lation from decreasing with air mass age. This additional acetone source should be stronger in the tropics compared to mid-latitudes, since the acetone photolysis rates are higher in the tropics (Singh et al., 2000), suggesting that this ace-tone source might be dependent on radiation as well. The secondary production of acetone from different hydrocar-bons, which are co-emitted with acetone and CO (Singh et al., 1994), and the direct release of acetone from organic aerosols (Ellison et al., 1999) have been suggested. The C3-C5 isoalkanes (propane, isobutene, isopentane) are consid-ered the major anthropogenic atmospheric precursors of ace-tone (Jacob et al., 2002).
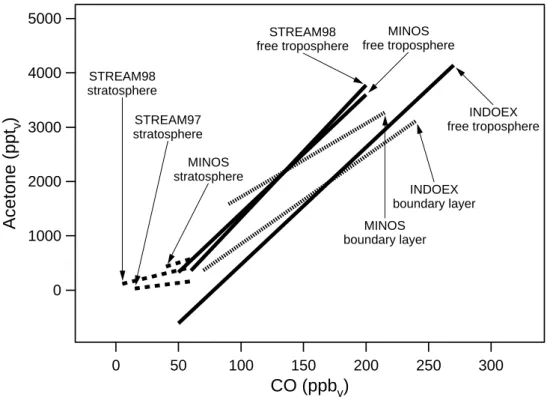
A summary of all linear acetone-CO relations obtained in this study is presented in Fig. 8. When comparing the acetone-CO relations derived in the marine boundary layer and the free troposphere during INDOEX it can be seen that at low CO mixing ratios acetone in the marine boundary layer is enhanced compared to the free troposphere, while at high CO mixing ratios acetone mixing ratios are lower in the marine boundary layer. This might be an indication for the release of acetone from the ocean in relatively clean re-gions and the uptake of acetone by the ocean in more pol-luted areas. This rather speculative conclusion is supported by model simulations with the ECHAM global chemistry-climate model performed by de Laat et al. (2001). They had to include an oceanic source of acetone in order to simulate the observed acetone mixing ratios in the marine boundary layer during INDOEX at low CO mixing ratios. At the same time they overestimate the acetone mixing ratios at CO mix-ing ratios exceedmix-ing 100 ppbv, indicating a missing acetone sink. A similar pattern has been observed over the Mediter-ranean Sea during MINOS, hence, this effect is not limited to the Indian Ocean.
The observations in the lower stratosphere indicate a ten-dency in the slope of the acetone-CO correlation with dis-tance above the tropopause. During STREAM97, measure-ments were performed at high latitudes during wintertime, when the tropopause was situated below 10 km altitude, and ozone mixing ratios up to 700 ppbv were observed. The STREAM98 measurements were performed at mid-latitudes during summertime, when the tropopause was located at
5000 4000 3000 2000 1000 0
Acetone (ppt
v)
300 250 200 150 100 50 0CO (ppb
v)
INDOEX boundary layer INDOEX free troposphere STREAM98 free troposphere MINOS boundary layer MINOS free troposphere MINOS stratosphere STREAM98 stratosphere STREAM97 stratosphereFig. 8. All linear acetone-CO correlations derived in this study.
much higher altitudes (10–14 km) and the maximum ob-served O3 mixing ratio was 500 ppbv. Over the Mediter-ranean region in summer, the tropopause is generally lo-cated at 15–16 km, well above the maximum cruising altitude of the aircraft. During MINOS stratospheric measurements were performed during one flight, when the tropopause was depressed to about 10 km in a tropopause fold, and O3 mix-ing ratios up to 280 ppbvwere observed.
Based on the observed O3 mixing ratios and tropopause heights, the measurements during STREAM97 were per-formed deepest into the stratosphere and showed the smallest slope of the linear relation between acetone and CO (3.1 pptv acetone/ppbvCO). The stratospheric MINOS measurements were performed closest to the tropopause and show the high-est slope (7.1 pptv acetone/ppbv CO). Hence, the slope of the acetone-CO relation decreases with distance from the tropopause, probably due to the longer lifetime of CO com-pared to acetone in the lower stratosphere and the decreas-ing influence of free tropospheric air (mixdecreas-ing) with increas-ing distance from the tropopause. The longer lifetime of CO compared to acetone in the lower stratosphere is a re-sult of the increasing photolytic destruction of acetone with altitude and the decreasing chemical destruction of CO by its reaction with OH, due to the decreasing OH mixing ratio with altitude. Moreover, CO is continuously produced from methane, whereas acetone has no significant sources in the lower stratosphere.
The intercepts of the linear relations between acetone and CO are displayed in Table 2. If we assume that biogenic emissions only significantly enhance the acetone mixing ra-tio in the atmosphere and not the CO mixing rara-tio, the dif-ferent intercepts might be an indication for the background acetone mixing ratio caused by biogenic emissions. In the free troposphere, the intercept increases from INDOEX to STREAM98 and MINOS, which can be explained by the fact that eastern Europe and Canada are much more heavily veg-etated areas compared to the Indian subcontinent. Assuming a background CO mixing ratio, due to methane chemistry, in the free troposphere of 60 ppbv, the background acetone mix-ing ratio would be 546 pptv, 359 pptvand −396 pptvfor MI-NOS, STREAM98 and INDOEX, respectively. For MINOS and STREAM98 this is comparable to the background ace-tone mixing ratio of 500 pptv, observed in the northern hemi-sphere by Singh et al. (1995). In the marine boundary layer a background acetone mixing ratio of 1179 and 202 pptvcan be found at a CO mixing ratio of 60 ppbvfor MINOS and IN-DOEX, respectively. The relatively high background acetone mixing ratio in the marine boundary layer over the Mediter-ranean could be an indication for recent biogenic emissions during MINOS, which has also been suggested by Salisbury et al. (2003). This discussion shows the importance of esti-mating an acetone background mixing ratio, when using the acetone-CO correlation to initialise acetone mixing ratios in model calculations.
We have to note that most of our measurements took place downwind of large continents during summertime. Exten-sive measurements in the continental boundary layer, in the southern hemisphere and measurements during other seasons will be necessary to complete the picture of the relation be-tween acetone and CO in the atmosphere.
6 Summary and conclusions
The correlation between acetone and CO has been inves-tigated for five aircraft measurement campaigns, at mid-latitudes, polar and tropical regions, showing common slopes for different layers of the atmosphere. Acetone measure-ments were performed using a proton-transfer-reaction or chemical ionisation mass spectrometer with a total uncer-tainty ranging from 28 to 50%. CO was measured using a tunable diode laser absorption spectrometer (TDLAS) with a total uncertainty ranging between 1.4 and 14%.
Air masses which were influenced by anthropogenic pol-lution and biomass burning show a strong correlation be-tween acetone and CO. This is caused by the co-emission of acetone, CO and hydrocarbons by anthropogenic and biomass burning sources, and the secondary production of acetone from the oxidation of various hydrocarbons. In the marine boundary layer, the slope of the linear relation between acetone and CO ranged between 13 and 16 pptv acetone/ppbv CO, while it was between 21 and 25 pptv acetone/ppbvCO in the free troposphere. The difference in slope can be explained by the emission of acetone from the ocean in relatively clean air masses and the uptake of acetone by the ocean in polluted areas.
Close to biogenic sources no correlation between acetone and CO was observed, which is due to the strong biogenic emission of acetone and its precursor gases, and small coin-cident biogenic CO emissions.
At further distance from biogenic and anthropogenic sources, for example in the stratosphere or in the southern hemisphere, a strong correlation between acetone and CO was observed as well. Measurements in the lower strato-sphere indicate a slope between 3 and 7 pptv acetone/ppbv CO. Measurements over the Indian Ocean in the south-ern hemisphere 3.4 pptvacetone/ppbvCO. This is probably caused by the relatively longer lifetime of CO compared to acetone, which causes the slope of the acetone-CO correla-tion to decrease with air mass age.
The slopes of the linear relation between acetone and CO, presented in this study, may be used in model calculations. However, different slopes have to be considered for marine boundary layer, free tropospheric and lower stratospheric air masses, and a distinction has to be made between northern and southern hemispheric air. The acetone-CO correlation can, however, not be used in areas with high biogenic emis-sions, since no significant correlation between acetone and CO was observed in these areas. Moreover, an acetone
back-ground mixing ratio has to be assumed in order to use the acetone-CO correlation in model calculations.
The acetone-CO correlation may also be useful for the identification of source regions that have affected the air mass.
Acknowledgements. The STREAM project was financially
sup-ported by the European Union (DG XII). Support by the Max Planck Society is also gratefully acknowledged (MINOS, INDOEX and LBA-CLAIRE).
References
Andreae, M. O., Artaxo, P., Fischer, H., Freitas, S. R., Gregoire, J. M., Hansel, A., Hoor, P., Kormann, R., Krejci, R., Lange, L., Lelieveld, J., Lindinger, W., Longo, K., Peters, W., de Reus, M., Scheeren, B., Silva Dias, M. A. F., Str¨om, J., van Velthoven, P. F. J., and Williams, J.: Transport of biomass burning smoke to the upper troposphere by deep convection in the equatorial region, Geophys. Res. Lett., 28, 951–954, 2001.
Arnold, F., B¨urger, V., Droste-Fanke, B., Grimm, F., Krieger, A., Schneider, J., and Stilp, T.: Acetone in the upper troposphere and lower stratosphere: Impact on trace gases and aerosols, Geophys. Res. Lett., 24, 3017–3020, 1997.
Br¨uhl, C. and Crutzen, P. J.: On the disproportionate role of tropo-spheric ozone as a filter against solar UV-B radiation, Geophys. Res. Lett., 16, 703–706, 1989.
Crutzen, P. J., Williams, J., P¨oschl, U., Hoor, P., Fischer, H., Warneke, C., Holzinger, R., Hansel, A., Lindinger, W., Scheeren, B., and Lelieveld, J.: High spatial and temporal resolution mea-surements of primary organics and their oxidation products over the tropical forests of Surinam, Atm. Env., 34, 1161–1165, 2000. de Gouw, J. A., Warneke, C., Scheeren, H. A., van der Veen, C., Bolder, M., Scheele, M. P., Williams, J., Wong, S., Lange, L., Fischer, H., and Lelieveld, J.: Overview of the trace gas mea-surements onboard the Citation aircraft during the intensive field phase of INDOEX, J. Geophys. Res., 106, 28 453–28 467, 2001. de Laat, A. T. J., de Gouw, J. A., Lelieveld, J., and Hansel, A.: Model analysis of trace gas measurements and pollution impact during INDOEX, J. Geophys. Res., 106, 28 469–28 480, 2001. De More, W. B., Sander, S. P., Golden, D. M., Hampson, R. F.,
Kurylo, M. J., Howard, C. J., Ravishankara, A. R., Kolb, C. E., and Molina, M. J.: Chemical kinetics and photochemical data for use in stratospheric modeling, Evaluation Number 12, Jet Propul-sion Laboratory publication no. 97-4, Pasadena, CA, 1997. de Reus, M., Krejci, R., Williams, J., Fischer, H., Scheele, R., and
Str¨om, J.: Vertical and horizontal distribution of the aerosol num-ber concentration and size distribution over the northern Indian Ocean, J. Geophys. Res., 106, 28 629–28 641, 2001.
Ellison, G. B., Tuck, A. F., and Vaida, V.: Atmospheric processing of organic aerosols, J. Geophys. Res., 104, 11 633–11 641, 1999. Fischer, H., Wienhold, F. G., Hoor, P., Bujok, O., Schiller, C., Siegmund, P., Ambaum, M., Scheeren, H. A., and Lelieveld, J.: Tracer correlations in the northern high latitude lowermost strato-sphere: Influence of cross-tropopause mass exchange, Geophys. Res. Lett., 27, 97–100, 2000.
Fischer, H., Brunner, D., Harris, G. W., Hoor, P., Lelieveld, J., McKenna, D. S., Rudolph, J., Scheeren, H. A., Siegmund, P., Wernli, H., Williams, J., and Wong, S.: Synoptic tracer
gradients in the upper troposphere over central Canada during the Stratosphere-Troposphere Experiments by Aircraft Measure-ments 1998 summer campaign, J. Geophys. Res., 107(D8), 4064, doi: 10.1029/2000JD000312, 2002.
Frost, G. J., Fried, A., Lee, Y.-N., Wert, B., Henry, B., Drummond, J. R., Evans, M. J., Fehsenfeld, F. C., Goldan, P. D., Holloway, J. S., H¨ubler, G., Jakoubek, R., Jobson, B. T., Knapp, K., Kuster, W. C., Roberts, J., Rudolph, J., Ryerson, T. B., Stohl, A., Stroud, C., Sueper, D. T., Trainer, M., and Williams, J.: Comparison of box model calculations and measurements of formaldehyde from the 1997 North Atlantic Regional Experiment, J. Geophys. Res., 107(D8), 4060, doi:10.1029/2001JD000896, 2002.
Holzinger, R., Warneke, C., Hansel, A., Jordan, A., and Lindinger, W.: Biomass burning as a source of formaldehyde, acetaldehyde, methanol, acetone, acetonitrile and hydrogen cyanide, Geophys. Res. Lett., 26, 1161–1164, 1999.
Hoor, P., Fischer, H., Lange, L., Lelieveld, J., and Brun-ner, D.: Seasonal variations of a mixing layer in the low-ermost stratosphere as identified by the CO-O3 correlation from in situ measurements, J. Geophys. Res., 107(D5), 4044, doi:10.1029/2000JD000289, 2002.
Jacob, D. J., Field, B. D., Jin, E. M., Bey, I., Li, Q., Logan, J. A., Yantosca, R., and Singh, H. B.: Atmospheric budget of acetone, J. Geophys. Res., 107(D10), 4100, doi:10.1029/2001JD000694, 2002.
Jost, C., Trentmann, J., Sprung, D., Andreae, M. O., McQuaid, J. B., and Barjat, H.: Trace gas chemistry in a young biomass burn-ing plume over Namibia: Observations and model simulations, J. Geophys. Res.,108(D13), 8482, doi:10.1029/2002JD002431, 2003.
Keim, E. R., McKeen, S. A., Gao, R. S., Donnelly, S. G., Wamsley, R. C., Del Negro, L. A., Fahey, D. W., Hanisco, T. F., Lanzen-dorf, E. J., Proffitt, M. H., Margitan, J. J., Hintsa, E. J., Jaegle, L., Webster, C. R., May, R. D., Scott, D. C., Salawitch, R. J., Wilson, J. C., McElroy, C. T., Atlas, E. L., Flocke, F., and Bui, T. P.: NOypartitioning from measurements of nitrogen and
hydro-gen radicals in the upper troposphere, Geophys. Res. Lett., 26, 51–54, 1999.
Kormann, R., Fischer, H., Gurk, C., Helleis, F., Kl¨upfel, T., Kowal-ski, K., K¨onigstedt, R., Parchatka, U., and Wagner, V.: Appli-cation of a multi-laser tunable diode laser absorption spectrom-eter for atmospheric trace gas measurements at sub-ppbvlevels,
Spectrochim. Acta A, 58, 2489–2498, 2002.
Lelieveld, J., Crutzen, P. J., Ramanathan, V., Andreae, M. O., Bren-ninkmeijer, C. A. M., Campos, T., Cass, G. R., Dickerson, R. R., Fischer, H., de Gouw, J. A., Hansel, A., Jefferson, A., Kley, D., de Laat, A. T. J., Lal, S., Lawrence, M. G., Lobert, J. M., Mayol-Bracero, O., Mitra, A. P., Novakov, T., Oltmans, S. J., Prather, K. A., Ramanathan, V., Reiner, T., Rodhe, H., Scheeren, H. A., Sikka, D., and Williams, J.: The Indian Ocean Experi-ment: Widespread air pollution from South and Southeast Asia, Science, 291, 1031–1036, 2001.
Lelieveld, J., Berresheim, H., Borrmann, S., Crutzen, P. J., Den-tener, F. J., Fischer, H., Feichter, J., Flatau, P. J., Heland, J., Holzinger, R., Kormann, R., Lawrence, M. G., Levin, Z., Markowicz, K., Mihalopoulos, N., Minikin, A., Ramanthan, V., de Reus, M., Roelofs, G. J., Scheeren, H. A., Sciare, J., Schlager, H., Schulz, M., Siegmund, P., Steil, B., Stephanou, E. G., Stier, P., Traub, M., Warneke, C., Williams, J., and Ziereis, H.: Global
air pollution crossroads over the Mediterranean, Science, 298, 794–799, 2002.
Lindinger, W., Hansel, A., and Jordan, A.: On-line monitoring of volatile organic compounds at pptvlevels by means of
Proton-Transfer-Reaction Mass Spectrometry (PTR-MS): Medical ap-plications, food control and environmental research, Int. J. Mass Spectrom. Ion Processes, 173, 191–241, 1998.
Mauzerall, D. L., Logan, J. A., Jacob, D. J., Anderson, B. E., Blake, D. R., Bradshaw, J. D., Heikes, B., Sachse, G. W., Singh, H., and Talbot, B.: Photochemistry in biomass burning plumes and implications for tropospheric ozone over the tropical South At-lantic, J. Geophys. Res., 103, 8401–8423, 1998.
McKeen, S. A., Gierczak, T., Burkholder, J. B., Wennberg, P. O., Hanisco, T. F., Keim, E. R., Gao, R. S., Liu, S. C., Ravishankara, A. R., and Fahey, D. W.: The photochemistry of acetone in the upper troposphere: A source of odd-hydrogen radicals, Geophys. Res. Lett., 24, 3177–3180, 1997.
M¨ohler, O., Reiner, T., and Arnold, F.: A novel aircraft-based tan-dem mass spectrometer for atmospheric ion and trace gas mea-surement, Rev. Sci. Instrum., 64, 1199–1207, 1993.
P¨oschl, U., Williams, J., Hoor, P., Fischer, H., Crutzen, P. J., Warneke, C., Holzinger, R., Hansel, A., Jordan, A., Lindinger, W., Scheeren, H. A., Peters, W., and Lelieveld, J.: High ace-tone concentrations throughout the 0–12 km altitude range over the tropical rainforest in Surinam, J. Atm. Chem., 38, 115–132, 2001.
Press, W. H., Teukolsky, S. A., Vetterling, W. T., and Flannery, B. P.: Numerical Recipes in C: the Art of Scientific Computing, 2nd edition, Cambridge University Press, New York, pp. 994, 1992. Reiner, T., Sprung, D., Jost, C., Gabriel, R., Mayol-Bracero, O.
L., Andreae, M. O., Campos, T. L., and Shetter, R. E.: Chemi-cal characterization of pollution layers over the tropiChemi-cal Indian Ocean: Signatures of emissions from biomass and fossil fuel burning, J. Geophys. Res., 106, 28 97–28 510, 2001.
Salisbury, G., Williams, J., Holzinger, R., Gros, V., Mihalopou-los, N., Vrekoussis, M., Sarda-Est`eve, R., Berresheim, H., von Kuhlmann, R., Lawrence, M., and Lelieveld, J.: Ground-based PTR-MS measurements of reactive organic compounds dur-ing the MINOS campaign in Crete, July–August 2001, Atmos. Chem. Phys., 3, 925–940, 2003.
Scheeren, H. A., Lelieveld, J., Roelofs, G. J., Williams, J., Fis-cher, H., de Reus, M., de Gouw, J. A., Warneke, C., Holzinger, R., Schlager, H., Kl¨upfel, T., Bolder, M., van der Veen, C., and Lawrence, M.: The impact of monsoon outflow from In-dia and South-East Asia in the upper troposphere over the east-ern Mediterranean, Atmos. Chem. Phys. Discuss., 3, 2285–2330, 2003.
Schneider, J.: Aircraft-based mass spectrometric measurements of trace gas distributions in the tropopause region: Implications for stratosphere-troposphere exange, ozone chemistry and global biomass burning, PhD. thesis, Heidelberg University, Germany, 132 p., 1997.
Singh, H. B., O’Hara, D., Herlth, D., Sachse, W., Blake, D. R., Bradshaw, J. D., Kanakidou, M., and Crutzen, P. J.: Acetone in the atmosphere: distribution, sources, and sinks, J. Geophys. Res., 99, 1805–1819, 1994.
Singh, H. B, Kanakidou, M., Crutzen, P. J., and Jacob, D. J.: High concentrations and photochemical fate of oxygenated hydrocar-bons in the global troposphere, Nature, 378, 50–54, 1995.
Singh, H. B., Chen, Y., Gregory, G. L., Sachse, G. W., Talbot, R., Blake, D. R., Kondo, Y., Bradshaw, J. D., Heikes, B., and Thorn-ton, D.: Trace chemical measurements from the northern midlat-itude lowermost stratosphere in early spring: Distributions, cor-relations and fate, Geophys. Res. Lett., 24, 127–130, 1997. Singh, H., Chen, Y., Tabazadeh, A., Fukui, Y., Bey, I., Yantosca,
R., Jacob, D., Arnold, F., Wohlfrom, K., Atlas, E., Flocke, F., Blake, D., Blake, N., Heikes, B., Snow, J., Talbot, R., Gre-gory, G., Sachse, G., Vay, S., and Kondo, Y.: Distribution and fate of selected oxygenated organic species in the troposphere and lower stratosphere over the Atlantic, J. Geophys. Res., 105, 3795–3805, 2000.
Sprung, D., Jost, C., Reiner, T., Hansel, A., and Wisthaler, A.: Acetone and acetonitrile in the tropical Indian Ocean bound-ary layer and free troposphere: aircraft-based intercomparison of AP-CIMS and PTR-MS measurements, J. Geophys. Res., 106, 28 511–28 527, 2001.
Traub, M., Fischer, H., de Reus, M., Kormann, R., Heland, J., Ziereis, H., Schlager, H., Holzinger, R., Williams, J., Warneke, C., de Gouw, J., and Lelieveld, J.: Chemical characteristics as-signed to trajectory clusters during the MINOS campaign, At-mos. Chem. Phys., 3, 459–468, 2003.
Warneke, C., Karl, T., Judmaier, H., Hansel, A., Jordan, A., Lindinger, W., and Crutzen, P. J.: Acetone, methanol, and other partially oxidized volatile organic emissions from dead plant matter by abiological processes: Significance for atmospheric HOxchemistry, Global Biogeochem. Cycles, 13, 9–17, 1999.
Warneke, C. and de Gouw, J. A.: Organic trace gas composition of the marine boundary layer over the northwest Indian Ocean in April 2000, Atm. Env., 35, 5923–5933, 2001.
Warneke, C., van der Veen, C., Luxembourg, S., de Gouw, J. A., and Kok, A.: Measurements of benzene and toluene in ambi-ent air using proton-transfer-reaction mass spectrometry: cali-bration, humidity dependence, and field intercomparison, Int. J. Mass Spectrom., 207, 167–182, 2001.
Wienhold, F. G, Fischer, H., Hoor, P., Wagner, V., K¨onigstedt, R., Harris, G. W., Anders, J., Grisar, R., Knothe, M., Riedel, W. J., L¨ubken, F. J., and Schilling, T.: TRISTAR – a tracer in situ TDLAS for atmospheric research, Appl. Phys. B., 67, 411–417, 1998.
Williams, J., Fischer, H., Hoor, P., P¨oschl, U., Crutzen, P. J., An-dreae, M. O., and Lelieveld, J.: The influence of the tropical rainforest on atmospheric CO and CO2as measured by aircraft
over Surinam, South America, Chemosphere – Global Change Science, 3, 157–170, 2001.
Wisthaler, A., Hansel, A., Dickerson, R. R., and Crutzen, P. J.: Organic trace gas measurements by PTR-MS dur-ing INDOEX 1999, J. Geophys. Res., 107(D19), 8024, doi:10.1029/2001JD000576, 2002.
Wohlfrom, K. H., Hauler, T., Arnold, F., and Singh, H.: Acetone in the free troposphere and lower stratosphere: Aircraft-based CIMS and GC measurements over the North Atlantic and a first comparison, Geophys. Res. Lett., 26, 2849–2852, 1999. Wollenhaupt, M., Carl, S. A., Horowitz, A., and Crowley, J. N.:
Rate coefficients for reaction of OH with Acetone between 202 and 395 K, J. Phys. Chem. A, 104, 2695–2705, 2000.