HAL Id: hal-00297552
https://hal.archives-ouvertes.fr/hal-00297552
Submitted on 28 Apr 2006
HAL is a multi-disciplinary open access
archive for the deposit and dissemination of
sci-entific research documents, whether they are
pub-lished or not. The documents may come from
teaching and research institutions in France or
abroad, or from public or private research centers.
L’archive ouverte pluridisciplinaire HAL, est
destinée au dépôt et à la diffusion de documents
scientifiques de niveau recherche, publiés ou non,
émanant des établissements d’enseignement et de
recherche français ou étrangers, des laboratoires
publics ou privés.
C2-C10 hydrocarbon emissions from a boreal wetland
and forest floor
H. Hellén, H. Hakola, K.-H. Pystynen, J. Rinne, S. Haapanala
To cite this version:
H. Hellén, H. Hakola, K.-H. Pystynen, J. Rinne, S. Haapanala. C2-C10 hydrocarbon emissions from a
boreal wetland and forest floor. Biogeosciences, European Geosciences Union, 2006, 3 (2), pp.167-174.
�hal-00297552�
www.biogeosciences.net/3/167/2006/ © Author(s) 2006. This work is licensed under a Creative Commons License.
Biogeosciences
C
2
-C
10
hydrocarbon emissions from a boreal wetland
and forest floor
H. Hell´en1, H. Hakola1, K.-H. Pystynen1, J. Rinne2, and S. Haapanala2
1Finnish Meteorological Institute, PL 503, 00101 Helsinki, Finland
2University of Helsinki, Department of Physical Sciences, Helsinki, Finland
Received: 29 September 2005 – Published in Biogeosciences Discuss.: 23 Novermber 2005 Revised: 15 February 2006 – Accepted: 3 March 2006 – Published: 28 April 2006
Abstract. Emissions of various C2-C10 hydrocarbons
(VOCs) and halogenated hydrocarbons (VHOCs) from a bo-real wetland and a Scots pine forest floor in south-western Finland were measured by the static chamber technique. Isoprene was the main non-methane hydrocarbon emitted by the wetland, but small emissions of ethene, propane, propene, 1-butene, 2-methylpropene, butane, pentane and hexane were also detected. The isoprene emission from the wetland was observed to follow the commonly-used isoprene emission algorithm. The mean emission poten-tial of isoprene was 224 µg m−2h−1 for the whole season. This is lower than the emission potentials published ear-lier; that is probably at least partly due to the cold and cloudy weather during the measurements. No emissions were detected of monoterpenes or halogenated hydrocar-bons from the wetland. The highest hydrocarbon emis-sions from the Scots pine forest floor were measured in spring and autumn. However, only a few measurements were conducted during summer. The main compounds emit-ted were monoterpenes. Isoprene emissions were negligi-ble. The total monoterpene emission rates varied from zero to 373 µg m−2h−1. The results indicated that decaying plant litter may be the source for these emissions. Small emis-sions of chloroform (100–800 ng m−2h−1), ethene, propane, propene, 2-methylpropene, cis-2-butene, pentane, hexane and heptane were detected. Comparison with Scots pine emissions showed that the forest floor may be an important monoterpene source, especially in spring.
Correspondence to: H. Hell´en
1 Introduction
C2-C10 hydrocarbons (VOCs) have an impact on
atmo-spheric chemistry in many ways. In the atmosphere they are oxidized by hydroxyl radicals, ozone and nitrate radi-cals, and they contribute to the production of tropospheric ozone (Atkinson, 2000). In their reactions carbonyls and acids are produced, and therefore they may make a contribu-tion to the organic content and acidity of precipitacontribu-tion. One important aspect is that the reaction products of VOCs may also take part in formation and growth of new particles, with possible consequents for climate (Griffin et al., 1999; Hoff-mann et al., 1997). Globally, biogenic sources (e.g., trees and other vegetation) (Guenther et al., 1995) are the main source of VOCs for the atmosphere. However, these sources are not well characterized. Halogenated hydrocarbons (VHOCs) with long atmospheric lifetimes contribute to the destruction of stratospheric ozone. Some of the VOCs and VHOCs are also harmful or toxic to both humans and the environment.
The boreal zone covers large areas in the northern hemi-sphere and is the largest forested region on Earth. In addition to forests, wetlands are a typical feature of this zone. While the VOC emissions from boreal forest ecosystems have been studied quite intensively (e.g. Janson 1993, Hakola et al., 1998, 2001, 2003, 2006; Rinne et al., 2000; Janson and De Serves, 2001; Tarvainen at al., 2005), data on the wet-lands are scarce. Janson et al. (1999), Jansson and De Serves (1998) and Haapanala et al. (2006) have shown that the bo-real wetlands are a significant source of isoprene. In a study by Rinnan et al. (2004) various VOCs, emitted from wetland microcosm samples taken from a wetland in Finland, were identified, but not quantified.
Studies on the VOC emissions from forest ecosystems have mostly been concentrated on the emissions from tree canopies, as the emissions from e.g. decaying leaf and needle litter has been assumed to be small compared to the canopy
168 H. Hell´en et al.: Boreal wetland and forest floor VOC emission
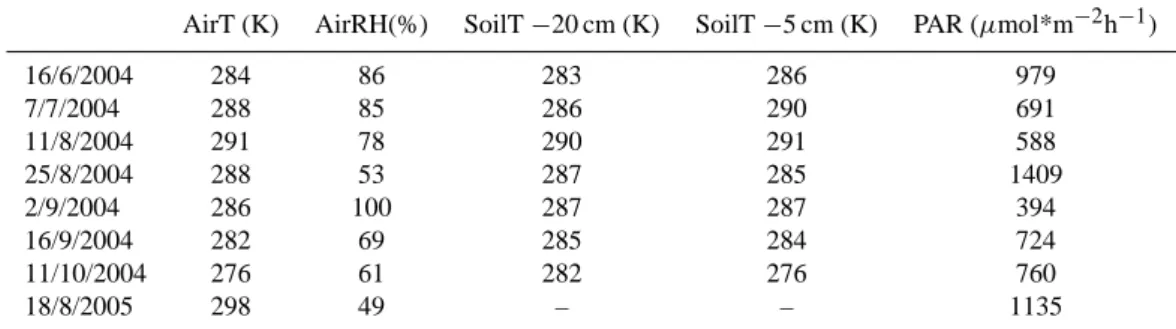
Table 1. The environmental conditions occurring during the sampling; Average local air temperature (Air T) and relative humidity (AirRH),
soil temperature at depth of 20 cm (SoilT-20cm) and 5 cm (SoilT-5cm) below the surface and average photosynthetically active radiation (PAR).
AirT (K) AirRH(%) SoilT −20 cm (K) SoilT −5 cm (K) PAR (µmol*m−2h−1)
16/6/2004 284 86 283 286 979 7/7/2004 288 85 286 290 691 11/8/2004 291 78 290 291 588 25/8/2004 288 53 287 285 1409 2/9/2004 286 100 287 287 394 16/9/2004 282 69 285 284 724 11/10/2004 276 61 282 276 760 18/8/2005 298 49 – – 1135
emissions. This has also been demonstrated in the stud-ies by Janson (1993), Janson et al. (1999), and Hayward et al. (2001), who found monoterpene emissions from the for-est floor in summer to be insignificant compared to the emis-sions from trees. However, during other seasons the forest floor may have an important role. Isidorov et al. (2003, 2005) have found in their laboratory studies that decomposing leaf litter emits several different VOCs. These emissions would occur during autumn and again in spring after the snow has melted and the ground thawed out.
Wetlands and the forest floor may also be a significant source for halogenated hydrocarbons that have been ob-served to be emitted e.g. by wetlands and the forest floor in Ireland (Dimmer et al., 2001), by coastal salt marshes in Cal-ifornia (Rhew et al., 2000) and by forest floors in Denmark and the Netherlands (Haselmann et al., 2000 and Hoekstra et al., 2001). Soil emissions have been estimated to be major contributor to the atmospheric chloroform burden (Laturnus et al., 2002). However, due to the lack of emission data, es-timates are still highly uncertain. To our knowledge data for the boreal zone are very limited.
The purpose of this study was to identify the emissions of various different C2-C10 hydrocarbons and halogenated
hydrocarbons from a boreal wetland and forest floor, and to estimate their importance and fluxes to the atmosphere. Ear-lier studies conducted on boreal wetlands have concentrated on isoprene only and have ignored emissions of other VOCs (Haapanala et al., 2006; Janson et al., 1999, and Janson and De Serves, 1998). In this study the fluxes of other hydrocar-bons were also quantified. As already mentioned, there are some earlier studies conducted on forest floor emissions in summer, but other seasons may be more important. Spring is of special interest at the measurement location, since VOCs may be precursors of secondary organic aerosols and most of the new particle formation events occur in spring (M¨akel¨a et al., 2000) This study is therefore concentrated on spring and autumn with the emphasis on evaluating the relative impor-tance of the ground emissions to the emissions of the Scots
pines (the main local trees). The boreal zone may also be a significant source for halogenated hydrocarbons, but no data exist to shed light on this question. For this reason the present study is also aimed at studying the emissions of halogenated hydrocarbons.
2 Materials and methods
The forest floor measurements were conducted at the Hyyti¨al¨a SMEAR II measurement station (61◦510N, 24◦170E, 180 m a.s.l.) in the south boreal zone of south-ern Finland, while the wetland measurements were carried out at the Siikaneva fen located a few kilometres west of the SMEAR II station. The forest at the forest floor mea-surement site is dominated by Scots pine (Pinus sylvestris L.) with some deciduous trees, such as the European as-pen (Populus tremula) and birches (Betula as-pendula and B.
pubescens). The ground vegetation consists mainly of shrubs
(Vaccinium myrtillus, V. vitis-idaea, Oxalis acetosella). The forest floor at the site is covered with mosses (Dicranum
polysetum, Pleurozium schreberi, Hylocomium splendens).
The soil type is Haplic Podzol. In addition to mosses, both plots contained some shrubs and some litter from the sur-rounding trees and other vegetation. Siikaneva is an open aapa fen and its vegetation is dominated by mosses
(Sphag-num balticum, S. papillosum, S. magellanicum and S. majus),
sedges (Carex rostrata, C. limosa and Eriophorum
vagina-tum) and Rannoch-rush (Scheuchzeria palustris). The fen
is surrounded by coniferous forests. The plots at Siikaneva contained both mosses and sedges. The measurements at Si-ikaneva were performed between June and October 2004 and at Hyyti¨al¨a between April and October in 2004 and between April and June in 2005. Because of the lack of warm and sunny days in the 2004 data, one additional measurement was conducted at Siikaneva on the 18 August 2005. Details of the environmental conditions occurring during the sampling are shown in Table 1.
According to the statistics of the Finnish Meteorologi-cal Institute, April 2004 was very dry, with precipitation amounts far below the long-term average. Summer 2004 was exceptionally rainy, with the record high precipitation amounts in southern and central Finland in July. May, June and July were also cloudier than the long-term average, and September was again quite rainy. Spring 2005 was a little colder and drier than the long-term average.
Measurements were conducted using the static cham-ber technique on five different stainless steel collars (60 cm×60 cm) at Siikaneva and on two different collars at Hyyti¨al¨a. The collars were installed randomly on the ground about six months prior to the measurements and re-mained undisturbed throughout the measurement periods. Two different chambers were used; one with dimensions of 60 cm×60 cm×50 cm and another with dimensions of 60 cm×60 cm×25 cm. One chamber was made of stain-less steel frames and the other of aluminum frames. Both chambers were covered inside with transparent Teflon film and therefore had transparent walls and roof. A Teflon-membrane pump was used to circulate the air in the chamber. The emission rate was determined from the increase in the concentration in the chamber during the closure. Three sam-ples were taken and analyzed during each closure. The con-centration increase was normalized to the plot area and time. The time intervals between the three samples were varied from 5 minutes to 50 min in order to find the optimum sam-pling time. In most cases, 10 min was found to be the best compromise. If the linearity of the concentration increase was poor (i.e., the correlation coefficient (R2)between con-centration and time was less than 0.8), the results were not used in flux calculations. Because the sampling interval for some of the samples at the beginning of the measurement period in 2004 was too long, emissions had to be calculated using only the first two samples in these cases.
Some of the VOCs, such as the monoterpenes, are very reactive towards ozone, which can pose problems in emis-sion measurements. However, in the studies of Janson et al. (1999) ozone has been found to disappear by dry depo-sition within 1 min after the closure of a Teflon chamber. Therefore, even though no ozone removal techniques were used in this study, ozone should not be a problem. In 2005, comparisons were conducted with a dynamic chamber sys-tem, where ozone was removed with MnO2 coated copper
nets. The VOC emissions measured by these two systems were at same level, and this gave further confirmation that ozone was not a problem in the static chamber measure-ments.
The air temperature in the chambers was observed to in-crease during the closure. In the studies in Ireland, Dimmer et al. (2001) measured increases of air temperature in the chambers from 5◦C to 15◦C, but the maximum increase in soil temperature at a depth of 10 cm was only 0.2◦C. In our study the increase in air temperature was found to be signif-icant (>2◦C) only on sunny and warm days. As the summer
of 2004 was exceptional cold and rainy this was not a serious problem for most of the measurements in this study.
The VOC and VHOC samples from the chambers were taken using Tenax TA-Carbopack B adsorbent tubes and 0.85 L stainless steel canisters. For adsorbent samples, critical orifices with membrane pumps were used. Flow rates were ca. 50 ml min−1. From the adsorbent tubes C5-C10 hydrocarbons (alkanes, alkenes, aromatic HC’s,
and terpenes) and some halogenated hydrocarbons (1,2-dichloroethane, chloroform, 1,1,1-trichloroethane, tetra-chloroethane, trichloroethene, tetrachloroethene) were anal-ysed using a Perkin Elmer ATD-400 thermal desorption unit together with a gas chromatograph (HP-5890) with an HP-1 column (60 m, i.d. 0.25 mm) and a mass spectrometer (HP-5972). In 2004 samples were analysed in SCAN mode, but in 2005 the more sensitive SIM (selective ion monitor-ing) mode was used. The detection limits therefore in 2005 were lower than in 2004. Lighter C2-C6 and halogenated
hydrocarbons were analysed from the canisters using a gas chromatograph (HP-6890) with an Al2O3/KCl PLOT
col-umn. After the column, the sample flow was split into two different detectors: C2-C7 hydrocarbons were detected
us-ing a flame ionization detector (FID) and a halogenated hy-drocarbon (chloromethane) with an electron capture detec-tor (ECD). Before the analysis, water and CO2 were
re-moved using a K2CO3/NaOH drier. Subsequently the
sam-ple (c.a. 500 ml) was concentrated using two liquid nitrogen traps. For adsorbent samples, a five-point calibration was performed using liquid standards in a methanol solution. For the canister samples, gas-phase standards from the NPL (Na-tional Physical Laboratory, UK) for VOCs and from NOAA (National Oceanic and Atmospheric Administration, USA) for VHOCs were used.
A blank test was conducted by covering a collar with Teflon film and placing the measurement chamber on it. Three samples were taken from the chamber at 10 minutes intervals; similar sampling lines and pumps were used as for the real samples. The concentrations in the chamber did not change during the enclosure and no production or degrada-tion of measured compounds was detected.
Isoprene emissions from vegetation are light- and temperature-dependent. This dependence can be described by the algorithms presented by Guenther et al. (1993) and Guenther (1997). The standard emission potential can be ob-tained by linearly fitting the emission rates to the light and temperature activity factors (CT*CL) of the isoprene
170 H. Hell´en et al.: Boreal wetland and forest floor VOC emission y = 223.82x R2 = 0.69 0 20 40 60 80 100 120 0 0.05 0.1 0.15 0.2 0.25 0.3
Light and temperature activity factor (CL*CT)
Is op re ne fl ux ( g m -2 h -1)
Fig. 1. Light and temperature dependence of measured isoprene
emission rates on Siikaneva fen.
3 Results and discussion 3.1 Wetland emissions
3.1.1 VOC emissions from the Siikaneva fen
The main VOC emitted by the Siikaneva fen was isoprene. However, small emissions of ethene, propane, propene, bu-tane, 1-butene, 2-methylpropene, pentane and hexane were also detected (Table 2). Summer 2004 was very rainy and cold at Siikaneva, and the measured emission rates were relatively low, the highest measured emission rate being 53 µg m−2h−1. In 2005, when measurements were con-ducted only on one warm and sunny day, emission rates var-ied between 50 and 103 µg m−2h−1.
The standard emission potential of the isoprene emission was 224 µg m−2h−1(Fig. 1). The coefficient of correlation
between measured emission rates and the light and tempera-ture activity factor (CT*CL) of the Guenther algorithm was
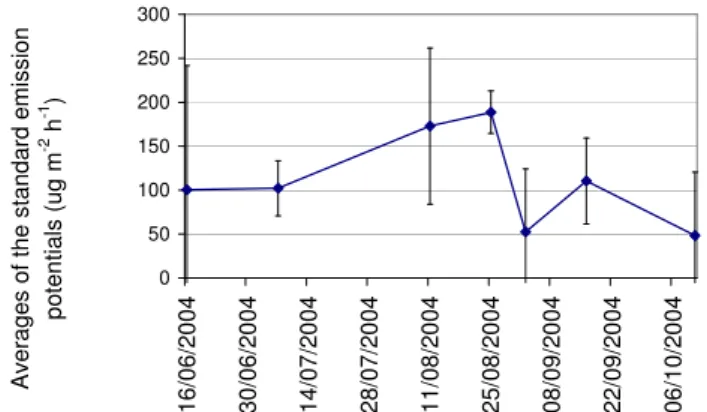
0.69 (Fig. 1). While temperature and PAR explain much of the variation, other factors can also have an effect. For example, the seasonal growth pattern and water content of the moss or other vegetation may explain part of the varia-tion (Janson and De Serves, 1998). Standard (T=30◦C and PAR=1000 µmol m−2s−1)emission potentials for isoprene were calculated for each measurement separately using the isoprene emission algorithm. Daily average values are shown in Fig. 2. The results indicate that the highest standard emis-sion potentials are measured in August. However, more mea-surements are needed to verify this conclusion.
In a VOC flux study by the REA technique at Siikaneva in 2004 and 2005, the average standard emission potential for isoprene was found to be 680 µg m−2h−1 (Haapanala et al., 2006), which is several times higher than that found in this study. However, Haapanala et al. (2006) observed that for low CT*CL values (<0.2), the emission potential
was lower, only 330 µg m−2 h−1. This value is closer to the emission potential obtained in this study, in which the CT*CL values were low. Another possible reason for
dif-0 50 100 150 200 250 300 16 /0 6/ 20 04 30 /0 6/ 20 04 14 /0 7/ 20 04 28 /0 7/ 20 04 11 /0 8/ 20 04 25 /0 8/ 20 04 08 /0 9/ 20 04 22 /0 9/ 20 04 06 /1 0/ 20 04 A ve ra ge s of th e st an da rd e m is si on po te nt ia ls (u g m -2 h -1 )
Fig. 2. Standard (30◦C and 1000 µmol m−2h−1)emission poten-tials of the isoprene on the Siikaneva fen in 2004. (Dots=daily av-erages and Error bars=2×Standard error of mean).
ferences in the measured emissions is that the REA tech-nique measures flux from much larger area than the cham-ber technique. If the footprint of the REA measurements is not totally homogeneous, comparison with the small plots from the area may give different results. However, Jan-son and De Serves (1998) also found higher emission po-tentials (700±400 µg m−2h−1)using the chamber technique on Sphagnum fens in Sweden and Finland in June–August 1997, but their measurements were also conducted in warm and sunny conditions.
No clear emissions of monoterpenes, aromatic hydrocar-bons or other larger volatile organic compounds (>C5)were
detected, although Rinnan et al. (2004) found the emission of 45 different C4-C10volatile organic compounds, including
aromatic hydrocarbons and monoterpenes, from microcosms taken from a Finnish wetland. However, they did not quan-tify the emissions, and they themselves raised the question of possible contamination of the microcosms during transporta-tion.
To study the origin of the VOC emissions, all sedges were removed from one of the plots. This did not change the magnitude of the emissions. The standard emission poten-tial of isoprene from the plot containing mosses only was 127 µg m−2h−1, which is close to the average value for the other plots (110 µg m−2h−1)on same day. From the
plot from which both green mosses and sedges were re-moved, almost no emissions were detected (emission poten-tial <1 µg m−2h−1). This indicates that the Sphagnum moss is the main source of the isoprene emitted by the fen.
3.1.2 VHOC emissions from the Siikaneva fen
Despite the special efforts made, no emissions of halo-genated hydrocarbons were detected. In the studies of Dim-mer et al. (2001), significant emissions of CH3Cl, CH3Br,
CH3I and CHCl3 were found to be emitted from wetlands
and the forest floor in Ireland, while Varner et al. (1999) have
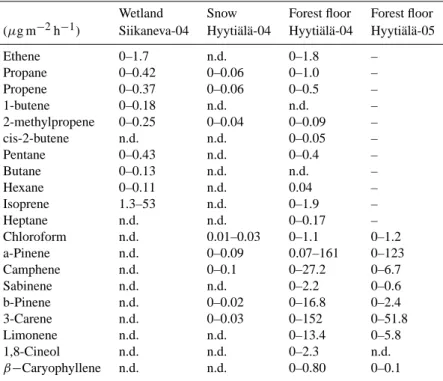
Table 2. Range of the measured emission rates on the Siikaneva fen and the forest floor at Hyyti¨al¨a in spring, summer and autumn of 2004
and in spring and early summer 2005.
Wetland Snow Forest floor Forest floor (µg m−2h−1) Siikaneva-04 Hyyti¨al¨a-04 Hyyti¨al¨a-04 Hyyti¨al¨a-05
Ethene 0–1.7 n.d. 0–1.8 – Propane 0–0.42 0–0.06 0–1.0 – Propene 0–0.37 0–0.06 0–0.5 – 1-butene 0–0.18 n.d. n.d. – 2-methylpropene 0–0.25 0–0.04 0–0.09 – cis-2-butene n.d. n.d. 0–0.05 – Pentane 0–0.43 n.d. 0–0.4 – Butane 0–0.13 n.d. n.d. – Hexane 0–0.11 n.d. 0.04 – Isoprene 1.3–53 n.d. 0–1.9 – Heptane n.d. n.d. 0–0.17 – Chloroform n.d. 0.01–0.03 0–1.1 0–1.2 a-Pinene n.d. 0–0.09 0.07–161 0–123 Camphene n.d. 0–0.1 0–27.2 0–6.7 Sabinene n.d. n.d. 0–2.2 0–0.6 b-Pinene n.d. 0–0.02 0–16.8 0–2.4 3-Carene n.d. 0–0.03 0–152 0–51.8 Limonene n.d. n.d. 0–13.4 0–5.8 1,8-Cineol n.d. n.d. 0–2.3 n.d. β−Caryophyllene n.d. n.d. 0–0.80 0–0.1
reported emissions of CH3Cl and CH3Br from two wetlands
in the Northeastern United States, both dominated by
Sphag-num and Carex species. One reason for the lack of emissions
may be that Siikaneva is located far away from sea areas, which are sources of chlorine. In addition to this, the salinity of the closest sea (the Baltic Sea) is lower than that of most major seas in the world. Foltescu et al. (2005) for example have shown that the average seasalt deposition flux in parti-cles is much higher in Ireland, where Dimmer et al. (2001) conducted their measurements, than in Finland.
3.2 Forest floor emissions
3.2.1 VOC emissions from the forest floor
The highest emissions from the forest floor were measured in spring and autumn. The main emitted compounds were monoterpenes (Table 2). The isoprene emissions were small compared to its emissions from the Siikaneva fen. The highest monoterpene emissions were measured in spring af-ter the snow had melted at the beginning of April (Fig. 3). Emissions dropped in the summer and increased again in the autumn. However, more measurements are needed to verify these results. The sum of the measured monoter-pene emission rates varied from below the detection limit to 373 µg m−2h−1. The most abundantly-emitted monoterpene was α-pinene followed by 13-carene, camphene, limonene and β-pinene. Emissions were also found to increase in
au-tumn in the study by Janson et al. (1993), conducted in Scots pine forests in Sweden. In those measurements, emission rates varied between 2.6 and 232 µg m−2h−1. In the study by Hayward et al. (2001), the average monoterpene emis-sions from the soil of a Sitka spruce forest in the UK were 34 µg m−2h−1. The measurements of Hayward et al. (2001) were conducted in the middle of summer, which may ex-plain the relatively low monoterpene emissions: lower emis-sion rates were also observed in the middle of the summer in Hyyti¨al¨a.
Warneke et al. (1999) suggested that the highest VOC emission rates by litter are observed at the beginning of au-tumn and in late spring. There have also been suggestions (Janson et al., 1993) that fine roots are a source for forest floor emissions. However, in the experiments by Hayward et al. (2001), in which emissions originating from different layers of the soil of a Sitka spruce forest in UK were de-termined, the emissions were found to be originating from the surface litter. Subsurface parts of the trees were found to emit significant quantities of monoterpenes only if dis-turbed, damaged or exposed to the atmosphere. The high emissions in spring and autumn indicated that litter may also be the source of monoterpenes in this study. Monoterpene emissions from living vegetation are known to be tempera-ture dependent (Guenther et al., 1993), so that the lack of temperature-dependence also gave support to the hypothesis that litter is the main source. In the Sitka spruce forest in
172 H. Hell´en et al.: Boreal wetland and forest floor VOC emission 2005 0 50 100 150 200 250 12/4 13/4 18/4 3/5 11/5 16/5 17/5 14/6 Fl ux ( g m -2 h -1 ) Forest floor Scots pine from Hakola et al. (2006)
n.a. n.a. n.a.<DLn.a. n.a.
2004 0 50 100 150 200 250 300 350 400 450 500 19.4. 4.5. 19.5. 8.7. 2.9. 16.9. 11.10. 21.10. F lu x ( g m -2 h -1 ) Forest floor Scots pine from Hakola et al. (2006)
n.a.
Fig. 3. Sum of the measured emission rates of the terpenes from
the forest floor and Scots pine (for biomass density 300 g m−2)at Hyyti¨al¨a in 2004 and 2005. The Scots pine results are from the study of Hakola et al. (2006). Data for Scots pine emissions on 16th of September 2004 were missing and in 2005 data were only available for 13 and 18 April and for 17 May. (Bars=daily average and error bars=standard deviations between the samples)
the UK, where measurements were conducted on three sum-mer days (Hayward et al., 2001), forest floor emissions were found to be temperature-dependent, but in this study sea-sonal factors were observed to have a greater effect. How-ever, daily or seasonal emissions might still be temperature-dependent.
The forest floor emissions of terpenes were compared to the emissions of a Scots pine canopy measured by Hakola et al. (2006) using branch chambers. The measured emissions were up-scaled to the canopy by assuming a needle biomass density of 300 g(dw) m−2(Fig. 3). In summer, the Scots pine
emissions were much higher than those of forest floor, but in spring and autumn the emissions were at the same level; sometimes even higher forest-floor emission was observed. This implies that in spring and autumn monoterpenes emitted from the forest floor can be a significant source of these com-pounds for the atmosphere. Springtime emissions from the forest floor are quite high even when compared to the sum-mertime emissions from the Scots pine canopy. This is
in-0 200 400 600 800 1000 1200 1400 1600 12/04 /2005 13/04 /2005 18/04 /2005 03/05 /2005 11/05 /2005 16/05 /2005 17/05 /2005 14/06 /2005 C hl or of or m fl ux (n g m -2 h -1 ) Collar 1 Collar 2
Fig. 4. Daily average (bars) and standard deviation (error bars) of
the measured emission rates of chloroform on different days from two different collars from the forest floor at Hyyti¨al¨a in 2005. On 12 and 13 April collar 2 was still covered with snow and no emissions were detected.
triguing, as terpenes are believed to participate in the forma-tion or growth processes of secondary organic aerosols, and the maximum in new particle formation event frequency in Northern European boreal regions is observed during spring-time (M¨akel¨a et al., 2000).
In April and May, when monoterpene emissions were at their highest, some emissions of sesquiterpenes (β-caryophyllene) were detected, their highest emission rates being 0.8 µg m−2h−2. In addition to the terpenes, small emissions of ethene, propane, propene, 2-methylpropene, cis-2-butene, pentane, hexane and heptane were also found (Table 2).
None of the studied compounds were emitted in sig-nificant amounts from the snow-covered forest floor. As shown in Table 2, only small emissions of propane, propene, 2-methylpropene, chloroform and monoterpenes were de-tected.
3.2.2 VHOC emissions from the forest floor
In 2005 when more sensitive selected ion monitoring (SIM) method was used to analyze the VHOC samples, chloro-form emission from the forest floor was detected on all measurement days, as shown in Fig. 4, except for collar 2 on the first two days, when the collar was still covered with snow. Daily average emission rates varied between 400 and 800 ng m−2h−1 for collar 1 and between 100 and
370 ng m−2h−1for collar 2. Emissions started after the snow had melted in April, and the emission rate also remained at the same level in May and June (Fig. 4). This implies that the main chloroform source is not the same as for the terpenes. However, Haselmann et al. (2002) found that the highest chloroform concentrations in the soil air of a Danish spruce forest are measured in spring and autumn. There are
many hypotheses as to how the chloroform is formed in the soil. Both biotic and abiotic processes have been suggested. These possible formation processes have been recently re-viewed by Laturnus et al. (2005). However, both the forma-tion and degradaforma-tion processes of chloroform in forest soils and the role of the forest as a sink and/or source of chlo-roform are still unclear. No emissions of other halogenated hydrocarbons were detected.
Hoekstra et al. (2001) found in their enclosure measure-ments in the Netherlands that a wood chip area and Dou-glas fir forest emit significant amounts of chloroform (up to 1000 ng m−2h−1), but that pine forest soil emits only 18–19 ng m−2h−1. Much higher emissions were found in this study. Haselmann et al. (2000) studied soil air from different soil layers at a Danish spruce forest site; the re-sults indicated that the main source of chloroform was bio-genic formation in the upper soil layer. The flux calcu-lated from the concentration gradients in the soil was 2.6– 160 ng m−2h−1, which is lower than the emissions observed at Hyyti¨al¨a. Even using this lower flux value Haselmann et al. (2000) estimated that emissions from the northern tem-perate forests (4.9 Gg) may be an important contributor to the atmospheric chloroform burden. However, Laturnus et al. (2002) estimated that the northern temperate forests are only a minor source globally. Using the average emis-sion rate measured at Hyyti¨al¨a (450 ng m−2h−1), and the area of boreal forests (1.6×10⁷km2)as given by Archibold (1995), the annual average emission from the boreal forests would be 48 Gg (10–195 Gg). This is in the same range as global anthropogenic emissions, as estimated by Latur-nus et al. (2002). However, more measurements at differ-ent locations and microsites are needed to really estimate the magnitude of the emissions. This is only intended to show that boreal forests might be an important chloroform source. Dimmer et al. (2001) measured halocarbon emissions from Irish peatland sites. The median of the measured chloroform emission rates was 525 ng m−2h−1. Emissions of chloro-form have also been measured from the rice fields in China (Khalil et al., 1998), where seasonally-averaged emissions varied from 600 to 4400 ng m−2h−1. In the Irish peatland, emissions were at the same level as in the Scots pine forest in this study, while rice-field emissions were a little higher.
The difference between the two collars in their emissions of chloroform is quite high, even though they are spatially close to each other (25 m apart). Substantial variations in chloroform and other halocarbon emissions between forest floor positions just a few metress apart have also been ob-served by Dimmer et al. (2001) and Hoekstra et al. (2001). Dimmer et al. (2001) explained the variations by the very local production of halocarbons by wood-rotting fungi and other microorganisms. This also shows that more measure-ments are needed to better describe the chloroform emissions from the boreal forest floor.
4 Conclusions
Isoprene was the dominant non-methane hydrocarbon emit-ted from the fen growing Sphagnum moss. Other compounds with detectable emissions were propane, pentane, hexane, butane, ethene, propene, 1-butene and 2-methylpropene. No emissions were detected of monoterpenes or halogenated hy-drocarbons from the Siikaneva fen. The mean isoprene emis-sion potential was 224 µg m−2h−1, with the highest emis-sion potentials measured in August. The emisemis-sion potential obtained here is lower than values published earlier; most probably this is at least partly caused by the cloudy and cold weather during the measurements. Sphagnum moss was probably the main source of isoprene on the Siikaneva fen.
The highest VOC emissions from the forest floor were measured in spring and autumn. However, more measure-ments are needed to verify these results. The main com-pounds emitted were monoterpenes. The emission rate of the sum of the monoterpenes varied between 0 and 373 µg m−2h−1. The most abundantly-emitted monoterpene
was α-pinene, followed by 13-carene, camphene, limonene and β-pinene. Isoprene emissions were small compared to the emission measured from the Siikaneva fen. Com-pared to the monoterpene emissions from the Scots pine canopy, the forest floor was found to be a significant source of monoterpenes in both spring and autumn. Small emis-sions (<2 µg m−2h−1) of ethene, propane, propene, 2-methylpropene, cis-2-butene, pentane, hexane and heptane from the forest floor were also detected.
In 2005, when the more sensitive SIM method was used, chloroform emission was detected from the forest floor on all measurement days. Emissions started after the snow had melted in April and the emission rate also remained at same level in May and June. This implies that the main chloroform source is not the same as for the terpenes.
Acknowledgements. We acknowledge the financial support from
Maj and Tor Nessling Foundation and the Academy of Finland (project 209216). We thank Terhi Riutta for providing us meteoro-logical data.
Edited by: T. Laurila
References
Archibold, O. W.: Ecology of World Vegetation, Chapman & Hall, London, 510pp., 1995.
Atkinson, R.: Atmospheric chemistry of VOCs and NOx, Atmos.
Environ., 34, 2063–2101, 2000.
Dimmer, C. H., Simmonds, P. G., Nickless, G., and Bassford, M. R.: Biogenic fluxes of halomethanes from Irish peatland ecosystems, Atmos. Environ., 35, 321–330, 2001.
Foltescu, V. L., Pryor, S. C., and Bennet, C.: Sea salt generation, dispersion and removal on the regional scale, Atmos. Environ., 39, 2123–2133, 2005.
174 H. Hell´en et al.: Boreal wetland and forest floor VOC emission
Griffin, R. J., Cocker III, D. R., Seinfeld, J. H., and Dabdub, D.: Estimate of global atmospheric organic aerosol from oxi-dation of biogenic hydrocarbons, Geophys. Res. Lett., 26, 2721– 2724,1999.
Guenther, A., Zimmerman, P. R., Harley, P. C., Monson, R. K., and Fall, R.: Isoprene and monoterpene emission rate variability: Model evaluations and sensitivity analyses, J. Geophys. Res., 98, 12 609–12 617, 1993.
Guenther, A., Hewitt, C. N., Erickson, D., Fall, R., Geron, C., Graedel, T., Harley, P., Klinger, L., Lerdau, M., McKay, W. A., Pierce, T., Scholes, B., Steinbrecher, R., Tallamraju, R., Taylor, J., and Zimmerman, P.: A Global model of natural organic com-pounds emissions, J. Geophys. Res., 100, 8873–8892, 1995. Guenther, A.: Seasonal and spatial variations in natural volatile
or-ganic compound emissions, Ecol. Appl., 7, 34–45, 1997. Haapanala, S., Rinne, J., Pystynen, K.-H., Hell´en, H., Hakola, H.,
and Riutta, T.: Measurements of hydrocarbon emissions from a boreal fen using the REA technique, Biogeosciences, 3, 103– 112, 2006.
Hakola, H., Rinne, J., and Laurila, T.: The hydrocarbon emission rates of Tea-leafed willow (Salix phylicifolia), Silver birch (Be-tula pendula) and European aspen (Populus termula), Atmos. En-viron., 32, 1825–1833, 1998.
Hakola, H., Laurila, T., Lindfors, V., Hell´en, H., Gaman, A., and Rinne, J.: Variation of the VOC emission rates of birch species during the growing season, Boreal. Environ. Res., 6, 237–249, 2001.
Hakola, H., Tarvainen, V., Laurila, T., Hiltunen, V., Hell´en, H., and Keronen, P.: Seasonal variation of VOC concentrations above a boreal coniferous forest, Atmos. Environ. 37, 1623–1634, 2003. Hakola, H., B¨ack, J., Hell´en, H., Hari, P., and Kulmala, M.: VOC emission rates from new and old needles of Scots Pine, Biogeo-sciences, 3, 93–101, 2006.
Haselmann, K. F., Ketola, R. A., Laturnus, F., Lauritsen, F. R., and Gron, C.: Occurrence and formation of chloroform at Danish forest sites, Atmos. Environ., 34, 187–193, 2000.
Haselmann, K. F., Laturnus, F., and Gon, C.: Formation of chlo-roform in soil. A year-rond study at a Danish spruce forest site, Water Air Soil Pollut., 139, 35–41, 2002.
Hayward, S., Muncey, R. J., James, A. E., Halsall, C. J., and Hewitt, C. N.: Monoterpene emissions from soil in Sitka spruce forest, Atmos. Environ., 35, 4081–4087, 2001.
Hoekstra, E. J., Duyzer, J. H., Leer, E. W. B., and Brinkman, U. A. Th.: Chloroform-concentration gradients in soil air and atmo-spheric air, and emission fluxes from soil, Atmos. Environ., 35, 61–70, 2001.
Hoffman, T., Odum, J. R., Bowman, F., Collins, D., Klockow, D., Flagan, R. C., and Seinfeld ,J. H.: Formation of organic aerosols from the oxidation of biogenic hydrocarbons, J. Atm. Chem., 26, 189–222, 1997
Isidorov, V. A., Vinogorova, V. T., and Rafalowski, K.: HP-SPME analysis of volatile organic compounds of coniferous needle lit-ter, Atmos. Environ., 37, 4645–4650, 2003.
Isidorov, V. A., Vinogorova, V. T., and Rafalowski, K.: Gas Chromatographic Determination of Extractable Compounds and Emission Rate of Volatile Terpenes from Larch Needle Litter, J. Atmos. Chem., 50, 263–278, 2005.
Janson, R.: Monoterpene emissions from Scots Pine and Norwegian Spruce, J. Geophys. Res., 98, 2839–2850, 1993.
Janson, R. and De Serves, C.: Isoprene emissions from boreal wetlands in Scandinavia, J. Geophys. Res., 103, 25 513–25 517, 1998.
Janson, R., De Serves, C., and Romero, R.: Emission of isoprene and carbonyl compounds from a boreal forest and wetland in Sweden, Agricult. Forest Meteorol., 98–99, 671–681, 1999. Janson, R. and De Serves, C.: Acetone and monoterpene emissions
from the boreal forest in northern Europe, Atmos. Environ., 35, 4629–4637, 2001.
Khalil, M. A. K., RAsmussen, R. A., Shearer, M. J., Chen, Z.-L., Yao, H., and Yang, J.: Emissions of methane, nitrous oxide and other trace gases from rice fields in China, J. Geophys. Res., 103, 25 241–25 250, 1998.
Laturnus, F., Haselmann, K. F., Borch, T., and Gron, C.: Terrestial natural sources of trichloromethane (chloroform, CHCl3)– an
overview, Biogeochem., 60, 121–139, 2002.
Laturnus, F., Fahimi, I., Gryndler, M., Hartmann, A., Heal, M. R., Matucha, M., Sch¨oler, H. F., Schroll, R., and Svensson, T.: Nat-ural formation and degradation of chloroacetic acids and volatile organochlorides in forest soil, Environ. Sci. & Pollut. Res. (on-line first), 1–12, 2005.
M¨akel¨a, J. M., Dal Maso, M., Pirjola, L., Keronen, P., Laakso, L., Kulmala, M., and Laaksonen, A.: Characteristics of the atmo-spheric particle formation events observed at a boreal forest site in southern Finland, Boreal Environ. Res., 5, 299–313, 2000. Rhew, R. C., Miller, B. R., and Weiss, R. F.: Natural methyl
bro-mide and methyl chloride emissions from coastal salt marshes, Nature, 403, 292–295, 2000.
Rinnan, R., Rinnan, ˚A., Holopainen, T., Holopainen, J. K., and Pasanen, P.: Emission of non-methane volatile organic com-pounds (VOCs) from boreal peatland microcosms-effects of ozone exposure, Atmos. Environ., 39, 921–930, 2004.
Rinne, J., Hakola, H., Laurila, T., and Rannik, ¨U.: Canopy scale monoterpene emissions of Pinus sylvestris dominated forests, Atmos. Environ., 34, 1099–1107, 2000.
Tarvainen, V., Hakola, H., Hell´en, H., B¨ack, J., Hari, P., and Kul-mala, M.: Temperature and light dependence of the VOC emis-sions of Scots pine, Atmos. Chem. Phys., 5, 989–998, 2005. Varner, R. K., Crill, P. M., and Talbot, R. W.: Wetlands: a
po-tentially significant source of atmospheric methyl bromide and methyl chloride, Geophys. Res. Lett., 26, 2433–2436, 1999. Warneke, C., Karl, T., Judmaier, H., Hansel, A., Jordan, A.,
Lindinger, W., and Crutzen, P. J.: Acetone, methanol and other partially oxidized volatile organic emissions from dead plant matter by abiological processes: Significance for atmospheric HOx chemistry, Glob. Biogeochem. Cycl., 13, 9–17, 1999.