HAL Id: hal-00297456
https://hal.archives-ouvertes.fr/hal-00297456
Submitted on 13 May 2008
HAL is a multi-disciplinary open access
archive for the deposit and dissemination of
sci-entific research documents, whether they are
pub-lished or not. The documents may come from
teaching and research institutions in France or
abroad, or from public or private research centers.
L’archive ouverte pluridisciplinaire HAL, est
destinée au dépôt et à la diffusion de documents
scientifiques de niveau recherche, publiés ou non,
émanant des établissements d’enseignement et de
recherche français ou étrangers, des laboratoires
publics ou privés.
Air mass origin and its influence over the aerosol size
distribution: a study in SE Spain
M. Cabello, J. A. G. Orza, V. Galiano
To cite this version:
M. Cabello, J. A. G. Orza, V. Galiano. Air mass origin and its influence over the aerosol size
distri-bution: a study in SE Spain. Advances in Science and Research, Copernicus Publications, 2008, 2,
pp.47-52. �hal-00297456�
Adv. Sci. Res., 2, 47–52, 2008 www.adv-sci-res.net/2/47/2008/
© Author(s) 2008. This work is distributed under the Creative Commons Attribution 3.0 License.
Advances in
Science and
Research
EMS
Annual
Meeting
and
8th
Eur
opean
Confer
ence
on
Applications
of
Meteor
olo
gy
2007
Air mass origin and its influence over the aerosol size
distribution: a study in SE Spain
M. Cabello, J. A. G. Orza, and V. Galiano
SCOLAb, F´ısica Aplicada, Universidad Miguel Hern´andez, Elche, Spain
Received: 2 January 2008 – Revised: 31 April 2008 – Accepted: 2 May 2008 – Published: 13 May 2008
Abstract. A k-means cluster analysis of 96 hour trajectories arriving in Southeast (SE) Spain at 3000, 1500 and 500 m for the 7-year period 2000–2006 has been performed to identify and describe the main flows arriving at the study area. The dependence of the aerosol size distribution on the air mass origin has been studied by using non-parametric statistics. There are statistically significant differences on aerosol size distribution and meteorological variables at surface level according to the identified clusters.
1 Introduction
Backward trajectory analysis is a commonly used method to identify synoptic-scale atmospheric transport patterns and/or determine the air pollutants origin (e.g., Dorling et al., 1992; Brankov et al., 1998; Cape et al., 2000; Stohl et al., 2002; Jorba et al., 2004; Salvador et al., 2004). The errors associa-ted to trajectory calculation are on the order of 15–20% of the distance travelled but the accuracy of the trajectory analy-sis increases when a set of large number of trajectories with similar characteristics is considered (Stohl, 1998), so back-trajectory cluster analysis is a suitable technique to classify air masses arriving at a study site.
In this study, the number particle size distribution is re-lated to different long range and regional/local contributions according to the identified air flows.
Cluster analysis is a multivariate statistical technique de-signed to classify a large data set into non-predefined domi-nant groups called clusters. However, clustering involves some subjective non-trivial decisions: the number of clusters to use, the selection of centroids in the initialization stage, etc. To determine the appropriate number of clusters and handle the sensitivity of the method to the initial centroids selection we have followed the procedures described by Dor-ling et al. (1992) and Mattis (2001) and considered some modifications to them in order to get smaller (better) values of the total Root Mean Square Deviation (RMSD), the clus-tering figure of merit.
Correspondence to: J. A. G. Orza
2 Methodology
96-h backward air trajectories arriving at 12:00 UTC at the study site for the period 2000–2006 were computed using the HYbrid Single Particle Lagrangian Integrated Trajectory (HYSPLIT) model v.4 with the FNL meteorological data, from the final run in the series of NCEP operational model runs, available at the NOAA ARL (Draxler and Rolph, 2003). Hourly latitude and longitude were used as input variables in the clustering procedures.
The trajectory classification has been performed by a k-means cluster analysis. We have followed the procedure des-cribed by Dorling et al. (1992) to reduce the subjectivity in the selection of the appropriate number of clusters: the algo-rithm was run for a range of cluster numbers k between 30 and 2, and the percentage change in the total RMSD (i.e. the sum of the RMSD of each cluster) when the number of clus-ters is reduced from k to k−1 was used to find out the proper number of clusters. Unlike Dorling et al. (1992), we define it as the smallest number of clusters for which the smallest total RMSD change is found.
Different approaches have been considered a) for the re-duction from k to k−1 clusters, and b) to deal with the depen-dence of the final cluster solution on the initial centroids. The details of the clustering methodology we have followed and its comparison with the procedures of Dorling et al. (1992) and Mattis (2001) will be published elsewhere. Here we note that these authors reduce the number of clusters from k to
k−1 by merging the two closest clusters, while we compute
100 000 k-means analysis for each k and then retain the so-lution with the smallest total RMSD. Calculations for the k clusters solution do not depend on the k+1 cluster solution as the initial centroids are taken from randomly chosen real
48 M. Cabello et al.: Air mass origin and aerosol size distribution trajectories. This approach can provide smaller total RMSDs
and hence better clustering solutions than the obtained using the Dorling and Mattis procedures.
Aerosol size distributions were measured on the roof of a building of the municipality of Agost, Spain (38.44◦N,
0.64◦W), a village of 4000 inhabitants located 18 km from
the Mediterranean coast. The main activities in Agost are re-lated to extractive operations, brick manufacturing and grape cultivation. Measurements were taken every ten minutes from January to May 2006 with a GRIMM 190 aerosol spec-trometer. Measured size distributions range from 0.25 to greater-than-32 µm diameter in 31 size channels.
A varimax rotated principal components analysis (PCA) has been applied to the normalized aerosol size channels to reduce the 31 intercorrelated variables to a smaller set of independent factors that accounted for most of the ob-served variance. Each factor is a linear combination of the original variables and the coefficients of the linear combi-nations (factor loadings) represent the degree of correlation between the variables and the factor. This method allows detection of the modes of the size distribution; moreover it decomposes the distribution into size intervals that behave in a similar way (show significant correlations) upon changes in aerosol sources and meteorological conditions (Chan and Mozurkewich, 2007; Pugatshova et al., 2007).
To detect statistically significant differences in aerosol size distribution and meteorological variables at surface level ac-cording to the identified clusters (Brankov et al., 1998), the Kruskal-Wallis test and the pairwise Mann-Whitney test have been used. We conservatively adjusted p-values αt=0.05 in
the latter using the Dunn-Sid´ak correction for multiple com-parisons to α=1−(1−αt)1/n, where n is the number of
pair-wise comparisons done between k categories.
A number of information sources were utilized to es-timate when African dust outbreaks (ADOs) occur: the study of the backtrajectory pathways, the evaluation of daily maps of surface and column-integrated aerosol con-centration from the DREAM, NAAPS and SKIRON aerosol dispersion models: DREAM (http://www.bsc.es/projects/ earthscience/DREAM), NAAPS (http://www.nrlmry.navy. mil/aerosol/) and SKIRON (http://forecast.uoa.gr), as well as the inspection of the NASA SeaWiFS project satellite images (http://seawifs.gsfc.nasa.gov/SEAWIFS.html).
3 Results and discussion
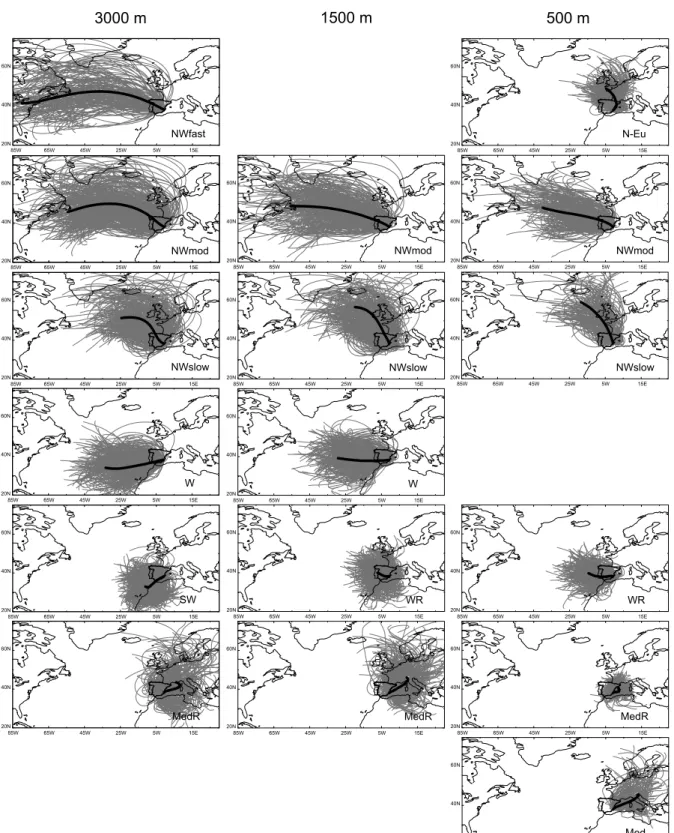
Trajectories arriving at 3000 and 500 m are found to be clus-tered into 6 groups, while for 1500 m the number of clusters is 5 (Fig. 1). Most of the 3000 m trajectories correspond to westerly flows, identified as northwesterlies (NW) of differ-ent length, southwesterlies (SW) and zonal (W) flows. At 1500 and 500 m there is an elevated occurrence of slow flows. Although computed trajectories cannot resolve mesoscale phenomena, clusters composed of short trajectories are
asso-ciated to the absence of marked advective components due to low pressure gradient situations that last several days. Such weak synoptic forcing leads to situations where sea-breeze regime develops and it is intensified by the topography and the Iberian thermal low, thus inducing mesoscale recircula-tions as reported in (Millan et al., 1997). Stagnant situa-tions are also associated to the slow flows. The correspond-ing flows include mainly regional Mediterranean recircula-tions (MedR), and slow westerlies (WR) and short trajecto-ries coming from the North (N-Eu), respectively.
A short description of the identified air masses and flows is given in the following:
NWfast: Advection of polar maritime fast air masses
start-ing in Canada and/or northern USA. This cluster is identified only for trajectories arriving at 3000 m. It is the smallest cluster in number of trajectories (7%). Almost 50% of the cases occur in wintertime.
NWmod: Advection of polar maritime air masses entering
in the western Iberian Peninsula or coming from other coun-tries in Western Europe (UK, France). It accounts for 13% of the trajectories arriving at 3000 m, 11.6% for 1500 and 9.5% at 500 m. More than 40% of them occur in wintertime.
NWslow: Slow NW advections or slow flows from
West-ern Europe. 15% of the back-trajectories at 3000 and 1500 m, and 7% at 500 m fall in this cluster.
W: Advection of Atlantic tropical maritime air masses
(around 17%). Cluster not identified at 500 m.
SW: Air masses composed by moderately short W-SW
tra-jectories, many of them passing over the western coast of Morocco and the Straits of Gibraltar. 52% of its trajectories are associated with African dust intrusions. This cluster is identified only for trajectories arriving at 3000 m, being the major cluster in number of trajectories (30%), most of them occur in summertime.
N-EU: Composed by continental slow NE/N flows from
Western Europe, and several Arctic and polar maritime air masses. This cluster is identified only for trajectories arriving at 500 m (19%).
MedR: Composed by trajectories recirculating over the
Mediterranean Sea, and by slow advections from western Eu-rope and northern Africa (3000 and 1500 m). These flows are associated with African dust intrusions (27% of its trajecto-ries at 3000 m, 33% at 1500 m, 41% at 500 m). It is the major cluster at 500 m (29%).
WR: Western recirculations composed by aged air masses
coming from the western Iberian Peninsula or from north of Morocco. This cluster is not identified for trajectories arri-ving at 3000 m. Most of these trajectories are associated to days with African dust outbreaks (51% at 500 m and 39% at 1500 m).
Med: Mixed Mediterranean and continental European
flows. This cluster is identified only at 500 m (11%). The study of the influence of the air mass on the aerosol size distribution was simplified by a PCA that reduced the 31 size channels to four factors, accounting for 93.8% of the
65W 45W 25W 5W 15E 85W 60N 20N 40N MedR 65W 45W 25W 5W 15E 85W 60N 20N 40N NWmod 65W 45W 25W 5W 15E 85W 60N 20N 40N NWslow 65W 45W 25W 5W 15E 85W 60N 20N 40N N-Eu 65W 45W 25W 5W 15E 85W 60N 20N 40N Med 65W 45W 25W 5W 15E 85W 60N 20N 40N WR 65W 45W 25W 5W 15E 85W 60N 20N 40N NWmod 65W 45W 25W 5W 15E 85W 60N 20N 40N NWslow 65W 45W 25W 5W 15E 85W 60N 20N 40N W 65W 45W 25W 5W 15E 85W 60N 20N 40N MedR 65W 45W 25W 5W 15E 85W 60N 20N 40N SW 65W 45W 25W 5W 15E 85W 60N 20N 40N NWfast 65W 45W 25W 5W 15E 85W 60N 20N 40N NWmod 65W 45W 25W 5W 15E 85W 60N 20N 40N NWslow 65W 45W 25W 5W 15E 85W 60N 20N 40N W 65W 45W 25W 5W 15E 85W 60N 20N 40N WR 65W 45W 25W 5W 15E 85W 60N 20N 40N MedR 3000 m 1500 m 500 m
Figure 1.Clusters identified for 3000 m (left), 1500 m (center) and 500 m (right) for the 7-year study period. The representative centroid of each cluster is drawn as bold line while the single backtrajectories appear in grey.
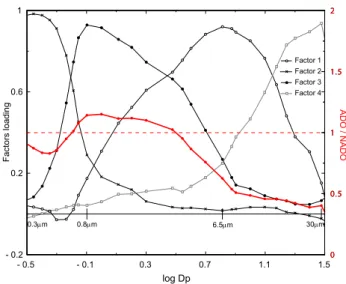
50 M. Cabello et al.: Air mass origin and aerosol size distribution - 0.1 0.3 0.7 1.1 1.5 log Dp - 0.2 0.2 0.6 1 - 0.5 0.3mm 0.8mm 6.5mm 30mm Factor 1 Factor 2 Factor 3 Factor 4 0 0. 5 1 1. 5 2 0 0. 5 1 1. 5 2 AD O / N AD O F a ct o rs lo a d in g
Figure 2. Factor loadings from the varimax rotated PCA analy-sis. Four representative size channels (0.3–0.35 µm, 0.8–1 µm, 6.5– 7.5 µm and >30 µm) are selected. The ratio between the mean par-ticle concentration on ADOs and NADOs for each size channel is shown in red; a ratio equal to one is drawn as a dashed line.
total variance. The factor loadings (Fig. 2) indicate that these factors correspond to four particulate size intervals, so the size channel with the highest loading in each factor is re-garded as its representative size. Then the 0.3–0.35 µm, 0.8– 1 µm, 6.5–7.5 µm, and >30 µm channels have been related to the results of the clustering analysis.
The autocorrelation function of the selected representative size channels shows stronger one-week periodicity (anthro-pogenic) the smaller the particle size; no periodicity is found for the >30 µm size.
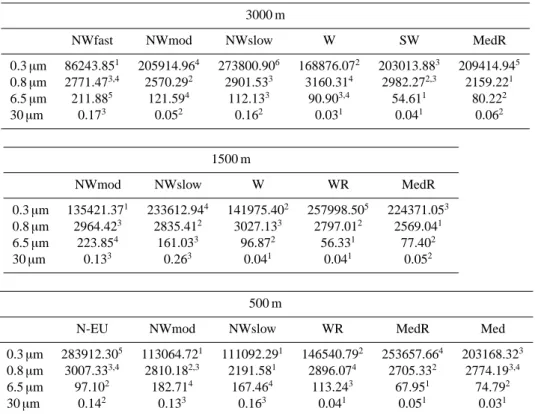
The variation of the particle concentration on these size channels according to the different clusters is significant as shown by the Kruskal-Wallis test. After detection of pairwise significant differences by the corrected Mann-Whitney test air flows were grouped and labeled with a superscript number by increasing particle concentration. In each row in Table 1 (i.e. for each representative particle size), mean values not sharing the same superscript denote significant differences between particle concentration by air flow.
NW fast (3000 m) and moderate (1500, 500 m) advections are associated to the renovation of the air masses at the study site due to the entrance of clean air flows, thus the fine frac-tion (0.3 and 0.8 µm factors) shows low concentrafrac-tion levels. These situations correspond to the highest surface winds that promote local suspension of soil dust with the highest levels in the coarse fraction (6.5 and >30 µm factors).
Slow flows and regional recirculations, however, are re-lated to smaller concentrations of the coarse fraction, while they show the highest fine fraction levels. There is an ele-vated number of days with such slow flows (54% of the days
for trajectories arriving at 1500 m and 72% at 500 m), that re-sult in the accumulation of aerosols either at a regional level (by mesoscale recirculations occurring mainly in the March– October term) or at a local level (in stagnant conditions that occur mainly in the November–February term) (Rodr´ıguez et al., 2003). We note that in coastal SE Spain the mean number of sea-breeze days is found to be between 15 and 20 a month in the study period: January–April and some days in May, as shown in (Azor´ın-Molina and Mart´ın–Vide, 2007).
African dust is transported to the Western Mediterranean basin in layers at altitudes between 1500 and 5000 m (Rodr´ıguez et al., 2001). SW flows arriving at 3000 m are closely related to ADOs. At lower altitude (500 m), a high percentage of the MedR flows corresponds also to days with African outbreaks, but in these cases trajectories do not pass over Africa. In this respect we note that on days with ADO there is also accumulation of aerosols due to the absence of advection at low altitude.
The contribution of African dust events is observed in the range 0.65–2 µm in diameter as shown in Fig. 2, where the ra-tio between the mean particle concentrara-tions for ADOs and that for non African dust outbreaks (NADO) for each size channel is plot. From the daily contribution of each factor (not shown) it is obtained that Factor 3 (0.8 µm) is the only one that contributes positively to days with ADOs and nega-tively to NADOs. African dust intrusions are therefore re-lated to the factor labeled as 0.8 µm. Lyamani et al. (2005) found a mode centered at a radius of 0.6 µm in the num-ber size distribution under two ADOs in Granada, southern Spain, with a sun photometer. We note that most of the SW trajectories arriving in our study site at 3000 m have passed previously over Granada, which is 300 km away from the study area. Blanco et al. (2003), from size and shape mea-surements made by scanning electron microscopy, found a mode in 2 µm in diameter for two ADOs in Lecce, southern Italy. We believe that the contribution of ADOs to larger par-ticle sizes in the study area might be hampered by the high crustal dust load due to the brick industry.
4 Conclusions
We have identified the main flows arriving at SE Spain at 3000, 1500 and 500 m by means of cluster analysis of back-trajectories for a 7-year period. In spite of the relative sim-plicity of the single-particle Lagrangian model utilized, that is based on the mean flow field and that considers neither de-position nor growth nor chemical processes on the aerosol particles, significant differences in particle size distribution have been found according to the main flows. Such differ-ences indicate that flows of distinct origin, arriving at dif-ferent heights at the study site, contribute difdif-ferently to the aerosol load at surface level.
While the arrival of loaded air masses contribute to an increase of PM according to its typical particulate size, the
Table 1.Mean particle number concentrations (particles cm−3) corresponding to the different air flows identified at each height. Mean values
within a row with unlike superscript numbers are significantly different as stated from the corrected Mann-Whitney test. 3000 m
NWfast NWmod NWslow W SW MedR
0.3 µm 86243.851 205914.964 273800.906 168876.072 203013.883 209414.945
0.8 µm 2771.473,4 2570.292 2901.533 3160.314 2982.272,3 2159.221
6.5 µm 211.885 121.594 112.133 90.903,4 54.611 80.222
30 µm 0.173 0.052 0.162 0.031 0.041 0.062
1500 m
NWmod NWslow W WR MedR
0.3 µm 135421.371 233612.944 141975.402 257998.505 224371.053
0.8 µm 2964.423 2835.412 3027.133 2797.012 2569.041
6.5 µm 223.854 161.033 96.872 56.331 77.402
30 µm 0.133 0.263 0.041 0.041 0.052
500 m
N-EU NWmod NWslow WR MedR Med
0.3 µm 283912.305 113064.721 111092.291 146540.792 253657.664 203168.323
0.8 µm 3007.333,4 2810.182,3 2191.581 2896.074 2705.332 2774.193,4
6.5 µm 97.102 182.714 167.464 113.243 67.951 74.792
30 µm 0.142 0.133 0.163 0.041 0.051 0.031
arrival of clean air masses (NWs) is related in the study area to moderately high surface wind speeds that increase the con-centration of the coarse particles (those are entrained by the wind) and dilute the finest ones. Slow flows produced under weak synoptic forcing and stable conditions are associated to mesoscale recirculations and stagnant situations, respec-tively, that lead to an increase in the smallest particles while the concentration of the coarse ones decreases.
Acknowledgements. The authors acknowledge early discus-sions with Oriol Jorba (BSC), and thank Paul Nordstrom for his assistance. Work supported by the Spanish MEC under the CGL2004-04419/CLI (RESUSPENSE) project.
Edited by: S. Joffre
Reviewed by: two anonymous referees
References
Azor´ın-Molina, C. and Mart´ın-Vide, J.: Methodological approach to the study of the daily persistence of the sea breeze in Alicante (Spain), Atm´osfera, 20, 57–81, 2007.
Blanco, A., Dee Tomasi, F., Filippo, E., Manno, D., Perrone, M. R., Serra, A., Tafuro, A. M., and Tepore, A.: Characterization of African dust over southern Italy, Atmos. Chem. Phys., 3, 2147– 2159, 2003,
http://www.atmos-chem-phys.net/3/2147/2003/.
Brankov, E., Rao S. T., and Porter, P. S.: A trajectory-clustering-correlation methodology for examining the long-range transport of air pollutants, Atmos. Environ., 32, 1525–1534, 1998. Cape, J. N., Methven, J., and Hudson, L. E.: The use of
trajec-tory cluster analysis to interpret trace gas measurements at Mace Head, Ireland, Atmos. Environ., 34, 3651–3663, 2000.
Chan, T. W. and Mozurkewich, M.: Simplified representation of atmospheric aerosol size distributions using absolute principal component analysis, Atmos. Chem. Phys., 7, 875–886, 2007, http://www.atmos-chem-phys.net/7/875/2007/.
Dorling, S. R., Davies, T. D., and Pierce, C. E.: Cluster analysis: A technique for estimating the synoptic meteorological controls on air and precipitation chemistry-Method and applications, At-mos. Environ., 26, 2575–2581, 1992.
Draxler, R. R. and Rolph, G. D.: HYSPLIT Model access via NOAA ARL READY Website (http://www.arl.noaa.gov/ready/ hysplit4.html), NOAA Air Resources Laboratory, 2003. Jorba, O., P´erez, C., Rocadenbosch, F., and Baldasano, J. M.:
Clus-ter analysis of 4-day back trajectories arriving in the Barcelona Area, Spain, from 1997 to 2002, J. Appl. Meteorol., 43, 887–901, 2004.
Lyamani, H., Olmo, F. J., and Alados-Arboledas, L.: Saharan dust outbreak over southeastern Spain as detected by sun photometer, Atmos. Environ., 39, 7276–7284, 2005.
Mattis, I.: Compilation of trajectory data. EARLINET: A European Aerosol Research Lidar Network to Establish an Aerosol Clima-tology, Scientific Report for the period Feb. 2000 to Jan. 2001, J. B¨osenberg, Max Planck Inst. f¨ur Meteorologie, 26–29, 2001,
52 M. Cabello et al.: Air mass origin and aerosol size distribution
available at: http://lidarb.dkrz.de/earlinet/scirep1.pdf, 2005. Mill´an, M. M., Salvador, R., Mantilla, E., and Kallos, G.:
Photo-oxidant dynamics in the Mediterranean basin in summer: results from European research projects, J. Geophys. Res., 102, 8811– 8823, 1997.
Pugatshova, A., Reinart, A., and Tamm, E.: Features of the multi-modal aerosol size distribution depending on the air mass origin in the Baltic region, Atmos. Environ., 41, 4408–4422, 2007. Rodr´ıguez, S., Querol, X., Alastuey, A., Kallos, G., and
Kakak-liagou, O.: Saharan dust contributions to PM10 and TSP levels in Southern and Eastern Spain, Atmos. Environ., 35, 2433–2447, 2001.
Rodr´ıguez, S., Querol, X., Alastuey, A., Viana, M. M., and Mantilla, E.: Events affecting levels and seasonal evolution of airborne particulate matter concentrations in the Western Mediterranean, Environ. Sci. Technol., 37, 216–222, 2003.
Salvador, P., Art´ı˜nano, B., Alonso, D. G., Querol, X., and Alastuey, A.: Identification and characterisation of sources of PM10 in Madrid (Spain) by statistical methods, Atmos. Environ., 38, 435– 447, 2004.
Stohl, A.: Computation, accuracy and applications of trajectories – a review and bibliography, Atmos. Environ., 32, 947–966, 1998. Stohl, A., Eckhardt, S., Forster, C., James, P., Spichtinger, N., and Seibert, P.: A replacement for simple back trajectory calcula-tions in the interpretation of atmospheric trace substance mea-surements, Atmos. Environ., 36, 4635–4648, 2002.