HAL Id: hal-00295327
https://hal.archives-ouvertes.fr/hal-00295327
Submitted on 16 Sep 2003
HAL is a multi-disciplinary open access
archive for the deposit and dissemination of
sci-entific research documents, whether they are
pub-lished or not. The documents may come from
teaching and research institutions in France or
abroad, or from public or private research centers.
L’archive ouverte pluridisciplinaire HAL, est
destinée au dépôt et à la diffusion de documents
scientifiques de niveau recherche, publiés ou non,
émanant des établissements d’enseignement et de
recherche français ou étrangers, des laboratoires
publics ou privés.
the Atlantic and Indian Oceans
A. Maßling, A. Wiedensohler, B. Busch, C. Neusüß, Philip Quinn, T. Bates,
D. Covert
To cite this version:
A. Maßling, A. Wiedensohler, B. Busch, C. Neusüß, Philip Quinn, et al.. Hygroscopic properties of
different aerosol types over the Atlantic and Indian Oceans. Atmospheric Chemistry and Physics,
European Geosciences Union, 2003, 3 (5), pp.1377-1397. �hal-00295327�
www.atmos-chem-phys.org/acp/3/1377/
Chemistry
and Physics
Hygroscopic properties of different aerosol types over the Atlantic
and Indian Oceans
A. Maßling1, A. Wiedensohler1, B. Busch1, C. Neus ¨uß1, P. Quinn2, T. Bates2, and D. Covert3
1Institute for Tropospheric Research, Permoserstr. 15, 04318 Leipzig, Germany
2Northern Organization Atlantic Administration/Pacific Marine Environmental Laboratory (NOAA/PMEL), 7600 Sand Point
Way NE, Seattle, WA 98115, USA
3Department of Atmospheric Science, University of Washington, Box 354235, Seattle, WA 98195-4235, USA
Received: 8 October 2002 – Published in Atmos. Chem. Phys. Discuss.: 10 January 2003 Revised: 20 August 2003 – Accepted: 25 August 2003 – Published: 16 September 2003
Abstract. Hygroscopic properties of atmospheric particles
were studied in the marine tropospheric boundary layer over the Atlantic and Indian Oceans during two consecutive field studies: the Aerosols99 cruise (Atlantic Ocean) from 15 Jan-uary to 20 FebrJan-uary 1999, and the INDOEX cruise (Indian Ocean Experiment) from 23 February to 30 March 1999. The hygroscopic properties were compared to optical and chem-ical properties, such as absorption, chemchem-ical inorganic com-position, and mass concentration of organic and elemental carbon, to identify the influence of these parameters on hy-groscopicity.
During the two field studies, four types of aerosol-sampling instruments were used on board the NOAA (Na-tional Oceanic and Atmospheric Administration) Research Vessel Ronald H. Brown: Hygroscopicity Tandem Differen-tial Mobility Analyzer (HTDMA), seven-stage cascade im-pactor, two-stage cascade imim-pactor, and Particle Soot Ab-sorption Photometer (PSAP). The HTDMA was used to de-termine the hygroscopic properties of atmospheric particles at initial dry sizes (Dp) of 50, 150, and 250 nm and at relative humidities (RH ) of 30, 55, 75, and 90%. Simultaneously, a seven-stage cascade impactor of which 3 stages were in the sub-µm size range was used to determine the molar com-position of the major inorganic ions such as ammonium and sulfate ions. A two-stage cascade impactor (1 in the sub-µm size range, 1 in the sup-µm size range) was used to determine the mass concentration of organic and elemental carbon. The PSAP was used (at a wavelength of 565 nm) to measure the light absorption coefficient of the aerosol.
During the two field studies, air masses of several differ-ent origins passed the ship’s cruise path. The occurrence of different air masses was classified into special time periods signifying the origin of the observed aerosol.
Correspondence to: A. Maßling ([email protected])
All time periods showed a group of particles with high hygroscopic growth. The measured average hygroscopic growth factors defined by the ratio of dry and wet particle diameter at 90% RH ranged from 1.6 to 2.0, depending on the dry particle size and on the type of air mass. Particles with low hygroscopic growth occurred only when continen-tally influenced air masses arrived at the ship’s position. Dis-tinctions in hygroscopic growth of particles of different air masses were more significant for small relative humidities (30% or 55% RH ). High concentrations of elemental carbon corresponded with high light absorption coefficients and with the occurrence of less-hygroscopic and nearly hydrophobic particle fractions in the hygroscopic growth distributions.
A key finding is that clean marine air masses that had no land contact for five to six days could clearly be distinguished from polluted air masses that had passed over a continent several days before reaching the ship.
1 Introduction
Aerosol particles influence the radiative budget of the earth directly by scattering and absorbing the incoming sun-light and indirectly by serving as cloud condensation nuclei (CCN), (Charlson et al., 1992; Twomey et al., 1977). Al-though the greenhouse effect caused by greenhouse gases can be estimated fairly well, knowledge about the direct and in-direct effect of aerosols has been limited up to now. The influence of aerosols on the radiative budget of the earth is estimated to be on the same order of magnitude as the radia-tive forcing of greenhouse gases, but of opposite sign (IPCC, 2001). The determination of physical and chemical proper-ties of aerosol particles is therefore necessary to understand direct and indirect forcing, and thus lead to a reduction in the uncertainties in global climate models. A critical physical characteristic of an aerosol particle is its hygroscopic behav-ior. Hygroscopic properties of soluble atmospheric particles
significantly influence the size of the particles at ambient relative humidity, and thus influence the scattering capabil-ity and residence time of these particles in the atmosphere (Ogren et al., 1992). For that reason, hygroscopic data to-gether wit dry particle number size distributions are often re-quired to calculate microphysical aerosol properties such as size distribution or scattering at ambient conditions.
Furthermore, knowledge of hygroscopic aerosol proper-ties is needed because they determine the number of CCN, and thus determine the resulting droplet size distribution of a cloud, which in turn affects cloud albedo (Twomey, 1974). The impact of aerosol particles in the marine boundary layer is potentially high, because the oceans cover a large area of the earth and because clouds in this layer are estimated to control about one-third of the earth’s albedo (Charlson et al., 1987). The radiative properties of marine clouds are known to be susceptible to changes in their aerosol composition due to anthropogenic influence (Taylor and McHaffie, 1993). In addition, aerosol hygroscopicity measurements provide in-formation about the mixing state and the chemical compo-nents of aerosol particles.
Hygroscopic behavior of aerosol particles has been in-vestigated at different locations; e.g., Los Angeles by Mc-Murry and Stolzenburg (1989), Po Valley by Svenningsson et al. (1992), Pacific and Southern Oceans by Berg et al. (1998), and eastern Northern Atlantic Ocean by Swietlicki et al. (2000). Comprehensive field studies in the past in-clude the Aerosol Characterization Experiments ACE 1 and ACE 2, which determined the physical, chemical, and optical properties of aerosols in the marine boundary layer over the Pacific and Southern Oceans and over the eastern Northern Atlantic Ocean (Berg et al., 1998; Swietlicki et al., 2000). However, up to now, no such investigations have been done for the Southern Atlantic Ocean or the Indian Ocean.
In this study, hygroscopic properties of atmospheric par-ticles were measured during two consecutive field studies. The first study, Aerosols99 cruise (Fig. 1a: Atlantic Ocean), occurred from 15 January to 20 February 1999, and trav-eled from Norfolk, USA, via Cape Town, South Africa, to Port Louis, Mauritius. The second study, INDOEX cruise (Fig. 1b: Indian Ocean), occurred from 23 February to 30 March 1999, and traveled from Port Louis, Mauritius, to Male, Maldives, and in the region of the Maldives Islands. The hygroscopic properties were determined for different air masses encountered during the two field studies. The air masses were classified according to their origin, age, and pollution level. The hygroscopic properties were then com-pared to measured optical and chemical properties, such as absorption, chemical inorganic composition, and mass con-centration of organic and elemental carbon, to identify the implication of these parameters on hygroscopicity.
2 Field studies
Chemical, optical, and physical aerosol properties were mea-sured in the marine boundary layer over the Atlantic and Indian Oceans during two field studies onboard the Amer-ican Research Vessel Ronald H. Brown. The Aerosols99 field study, which studied the Atlantic Ocean, was divided into two parts: Leg 1 was from Norfolk, USA (37◦N
lati-tude, 76◦W longitude, 15 day of year, DOY), to Cape Town,
South Africa (34◦S latitude, 18◦E longitude, DOY 40), and
Leg 2 from Cape Town, South Africa (34◦S latitude, 18◦E longitude, DOY 42), to Port Louis, Mauritius, (21◦S lati-tude, 57◦E longitude, DOY 51). The INDOEX field study, which studied the Indian Ocean, was divided into three parts: Leg 3 was from Port Louis, Mauritius (DOY 54), to Male, Maledives (20◦S latitude, 57◦E longitude, DOY 60), Leg 4 was from Male (DOY 63) into the region of the Maledives and back to Male (DOY 82), and Leg 5 was from Male (DOY 85) into the region of the Bay of Bengal and back to Male (DOY 89). In Figs. 1a and b, the cruise tracks of both field studies are shown by the black lines. During the route from Norfolk to Male, aerosols of different age and origin that identified various polluted air masses passed the ship’s cruise path. Clean marine air masses (no land contact for five to six days) from the northern Atlantic Ocean, southern At-lantic Ocean, and Indian Ocean, as well as continentally in-fluenced air masses (passed over a continent several days be-fore reaching the ship or coming directly from the continent) from northern and western Africa, Indian Subcontinent, and Middle East were observed. The different air masses were categorized by using air-mass back-trajectory analysis, mea-sured aerosol number concentrations and meamea-sured size dis-tributions. The trajectories were calculated four times daily (06.00, 12.00, 18.00, and 24.00 h local time) for three alti-tudes (950, 750, and 500 mbar), (Bates et al., 2001; Quinn et al., 2002). The two field studies involved a combined total of 13 consecutive time periods, ranging from one to six days each. Table 1 summarizes the different types of air masses encountered during the two field studies.
For 6 of the 13 time periods, air masses dominated by a clean marine aerosol prevailed. These air masses were clas-sified into different subtypes, based on their origin in differ-ent regions of the Atlantic and Indian Oceans (Bates et al., 2001; Quinn et al., 2002). Air masses dominated by Saharan mineral dust and biomass burning of the west African coast were encountered only near the equator and the Inter Trop-ical Convergence Zone (ITCZ). Emissions from the Indian Subcontinent and Middle East were only found in air masses in the Northern Hemisphere portion of the Indian Ocean. In Figs. 1a and b, calculated 950 mbar back trajectories are pre-sented for certain time periods.
The data presented here is divided into five parts: Legs 1 and 2 of Aerosols99 (Atlantic Ocean) and Legs 3 to 5 of INDOEX (Indian Ocean). The x-axis for all figures is day of year (DOY), where 1 January (12.00 noon) is 1.5. The
(a)
(b)
Fig. 1. Picture of the cruise tracks including air-mass back-trajectories for two different ship positions: (a) Aerosols99, (b) INDOEX.
interesting time periods 2, 3, 4 (continental influence during Aerosols99) and 9 (strong continental influence during IN-DOEX) will be discussed in detail.
3 Chemical and physical measurements
3.1 Chemical inorganic composition
The chemical inorganic ionic composition was obtained from a seven-stage cascade Berner impactor of which 3 stages plus a back-up filter were in the sub-µm size range (Berner et al., 1979). The major ions were analyzed by ion chromatography (Quinn et al., 1998). The detection limit of each impactor stage was determined from blank samples taken several times during the cruise (Quinn et al., 2001, 2002).
3.2 Total aerosol mass
The total aerosol mass was obtained from a two-stage cas-cade Berner impactor of which one stage was in the sub-µm size range and one stage in the sup-µm size range (Berner
et al., 1979). The total aerosol mass was then determined by gravimetric analysis (Quinn et al., 2001, 2002).
3.3 Carbonaceous aerosol
Samples from a two-stage cascade Berner impactor were used for the carbon analysis (Berner et al., 1979). The mass concentrations of elemental carbon (EC) and organic carbon (OC) in the sub-µm and sup-µm size ranges were determined using a thermo-desorption-method (Neus¨uß et al., 2002). This thermographic method was applied using a temperature of 590◦C to volatilize the OC fraction within 8 min under nitrogen. Based on the field blank mean val-ues taken several times during the field studies, the detection limits (95% confidence level) were 0.16 µg/m3 for OC and 0.07 µg/m3 for EC for a typical day/night sampling period (Neus¨uß et al., 2002).
The aerosol particles were sampled with a time resolution of 12 hours for inorganic components, and 12 or 24 hours (depending on the particle concentration) for EC and OC. The filters were changed daily at 06.00 h and 18.00 h local time. All impactors were placed in a climate box so that the
Table 1. Classification and aerosol properties of different air masses observed during Aerosols99 (Atlantic Ocean) and INDOEX (Indian
Ocean) field studies
Leg1 Time period DOY Total aerosol mass Concentration of Concentration of Absorption coefficient Air mass type/origin3 concentration of elemental carbon organic carbon in for particles <10µm
0–1 µm particles of particles <1µm particles <1µm [Mm−1] [µg/m3]+/− sd [µg/m3]+/− sd [µg/m3]+/− sd
1 1 17.5–23.0 1.47 NA4 0.17 NA2 Northern Atlantic marine
+/−1.94 +/−0.18 air mass
1 2 23.0–25.0 5.39 NA NA5 NA African dust air mass
+/−0.57
1 3 25.0–27.0 5.45 0.30 NA 5.00 Mixed: African dust and +/−1.69 +/−0.13 biomass burning in the ITZC 1 4 27.0–29.8 4.83 0.43 0.28 5.95 Biomass burning in the ITZC
+/−0.71 +/−0.14 +/−0.06
1 5 29.8–36.0 1.02 NA NA NA Southern Atlantic tropical/
+/−0.32 temperate marine air mass
2 6 43.0–48.5 0.72 NA NA NA Southern Atlantic subtropical
+/−0.12 marine air mass
2 7 48.5–50.9 0.67 NA NA NA Indian Ocean marine air mass
+/−0.11
3/4 8 54.00–56.60 1.13 NA NA NA Southern Hemisphere/
78.25–79.50 +/−0.17 Marine Indian Ocean
4 9 63.50–66.50 18.44 1.64 0.81 15.80 Indian Subcontinent and +/−4.34 +/−0.26 +/−0.09 directly to the ship 4 10 67.00–68.00 9.24 0.54 0.59 5.44 Mixed: Indian Subcontinent
70.60–76.00 +/−2.00 +/−0.36 +/−0.55 and Middle East 4 11 76.00–78.25 3.18 0.13 NA 2.31 Northern Hemisphere/
79.75–81.25 +/−0.31 +/−0.04 Marine Indian Ocean 4/5 12 81.25–82.00 7.33 0.36 0.25 5.66 Arabian Sea/Coastal India
85.00–88.75 +/−2.48 +/−0.12 +/−0.12
5 13 88.75–89.5 13.35 0.74 0.46 11.68 Bay of Bengal and +/−0.50 +/−0.11 +/−0.02 directly to the ship
1Legs 1 and 2 were during Aerosols99, and Legs 3–5 during INDOEX.
2Data not available because the value was below the detection limit of the PSAP (0.34 Mm−1). 3Classification determined by air-mass back-trajectory analysis.
4Data not available because the value was below the detection limit of 0.07 µg/m3. 5Data not available because the value was below the detection limit of 0.16 µg/m3.
sampling was done under stable conditions at 55% +/− 5% RH(Quinn et al., 2001, 2002; Neus¨uß et al., 2002).
3.4 Light absorption
Additionally, the light absorption coefficient for particles smaller than 10 µm in diameter was measured using a Parti-cle Soot Absorption Photometer (PSAP) operated at a wave-length of 565 nm and at 55% +/− 5% RH . During the IN-DOEX field study, the PSAP was operated in combination with a cut-off filter, thus yielding the light absorption coeffi-cient for particles smaller than 1 µm. The PSAP determines the absorption coefficient by monitoring the change in trans-mission through a filter. The data were corrected according to the manufacturer’s calibration, scattering artifacts, flow rate
through the PSAP, and deposit diameter (Quinn et al., 2001, 2002). The PSAP sampled the aerosol with a time resolu-tion of 15 minutes. The detecresolu-tion limit of the PSAP was 0.34 Mm−1.
3.5 Hygroscopicity
The HTDMA system was used for the hygroscopic growth measurements. This system consists of two DMAs (Dif-ferential Mobility Analyzer) and a humidifier between the DMAs (Liu et al., 1978). The first DMA selects a monodis-perse particle fraction from the atmospheric aerosol and is operated at values <5% RH . This monodisperse particle fraction is passed through a humidity conditioner operated at an air flow humidified to 90% RH . This technique yields an
aerosol flow with RH greater than 85%. The humidity of the sheath air flow of the second DMA is regulated by mixing dry air (<5% RH ) and humid air (∼95% RH ), and thus can then be adjusted between 30 to 90% RH .
Because the humidity of the sheath air flow and the aerosol flow can be adjusted separately, deliquescence as well as ef-florescence behavior can be studied with the HTDMA. The aerosol humidity as well as the RH of the sheath air were continuously measured by calibrated capacitive sensors and were adjusted after each scan to the desired RH .
The altered size distribution due to a possible uptake of water was then determined by using the second DMA and a Condensation Particle Counter (CPC), resulting in a hygro-scopic growth distribution at that particle size and humid-ity. The hygroscopic growth factor gf(RH ) of each particle fraction in the hygroscopic growth distribution was then de-termined by the ratio of the particle size measured at that specific RH and dry particle size following Eq. (1):
gf (RH ) = Dp(RH )
Dp(dry). (1)
The number fraction of each hygroscopic group in the dis-tribution was determined by the ratio of the number fraction of that group (determined by its peak area) to the sum of the number fractions of all groups occurring in the hygroscopic growth distribution.
The flow in the HTDMA is extremely reliable and stable; fluctuations in the aerosol flow or sheath air flow were less than 2.5%. The RH within the humidity conditioner as well as in all flow rates within the system were controlled and adjusted during the entire measurement. The HTDMA was size-calibrated with latex spheres under ambient conditions (i.e., no humidification). Differences in size selection by the first and second DMAs were characterized by determining a calibration function, which was then used to correct all data for this effect of size-selection difference. The humidity sen-sors used in the HTDMA were calibrated using the deliques-cence behavior of three different salts, namely, sodium chlo-ride (NaCl), ammonium sulfate (NH4)2SO4, and potassium
chloride (KCl). The measured deliquescence RH of these three salts were within +/−0.5% RH of data reported by Se-infeld and Pandis (1998).
A temperature gradient between the humidity regulation sensor and the DMA itself can sometimes not be eliminated. Therefore, the RH inside the second DMA was determined four times each day by a salt calibration to obtain the real RH during the measurement. The growth factors measured at 90% RH were corrected for this temperature-gradient ef-fect. Nevertheless, the error in hygroscopic growth was cal-culated based on estimated uncertainties in RH within the HTDMA. The estimated uncertainty in measurements be-tween 30% and 90% RH was +/−1% RH . For measurement of the hygroscopic growth of an ammonium bisulfate parti-cle determined with the HTDMA, this uncertainty results in
a relative uncertainty of less than 5% for growth factors mea-sured between 30% and 90% RH .
When the HTDMA is used without humidity regulation, the monodisperse aerosol distribution after the first DMA broadens due to the width of the transfer function of the sec-ond DMA. Therefore, before the data was analyzed, all dis-tributions were inverted using a Tandem Differential Mobil-ity Analyzer inversion algorithm by Voutilainen et al. (2000) to account for this broadening.
The HTDMA was operated continuously except for short periods (about 60 minutes each day) when the system was recalibrated. Hygroscopic growth factors were determined for particles with initial dry sizes (Dp) of 50, 150, and 250 nm. The distributions were obtained at 30, 55, 75, and 90% RH . The aerosol was humidified to RH >85% for all measurements before coming into contact with the sheath air in the second DMA, so that all particles had exceeded their deliquescence point by the time they reached the sec-ond DMA. The acquisition of each distribution took about 20 minutes because particle concentrations were sometimes small (<250#/cm3).
During both field studies, all instruments were set up in a container placed on deck of the ship. The aerosol was sam-pled at 18 m above sea level by using an 6-m-high inlet tower (Quinn et al., 2001, 2002). When the measurements were influenced by emissions from the ship itself (evidenced by extremely high particle concentrations), the inlet was then closed. Because of local pollution, all data obtained within 250 km of the harbors of Norfolk, Cape Town, Port Louis, and Male were not included in the data evaluation.
4 Results and Discussion
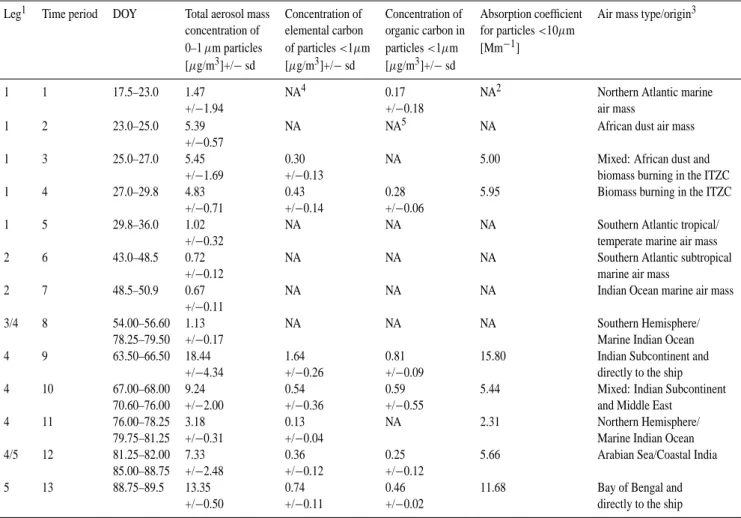
4.1 Chemical inorganic composition
Figure 2 shows the molar composition of the major in-organic ions measured for 80 nm<Dae<184 nm (first
im-pactor stage) and for 184 nm<Dae<308 nm (second
im-pactor stage). These two stages cover the size range that was also determined by the HTDMA-measurements. At the beginning of Leg 1 as well as during Leg 3, a significant number of sodium and chloride ions were sometimes de-tected in both size ranges. During Leg 2, this observation was only made for the second impactor stage. These con-centrations can be assigned to sea salt particle production during periods of high wind speeds (>10 m/s2) in the days preceding those measurements. During time periods 2 and 3 (Aerosols99, Leg 1: DOY 23–DOY 27), small concentra-tions of calcium were found in the second impactor stage indicating that air masses influenced by dust were observed. During time periods 3 and 4 (Aerosols99, Leg 1: DOY 25– DOY 30), air masses influenced by biomass burning were en-countered. For these two time periods, high concentrations of potassium were detected, indicating that the observed air
Fig. 2. Molar composition of the major inorganic ions for particles with (a) 80 nm<Dae<184 nm (collected on the first impactor stage) and (b) 184 nm<Dae<308 nm (second impactor stage) measured during Aerosols99 (Atlantic Ocean) and INDOEX (Indian Ocean).
masses were anthropogenically influenced by biomass burn-ing (Philip et al., 1999). However, for all other time periods, ammonium and sulfate ions dominated the molar composi-tion for both size ranges, assuming that the major inorganic components of the aerosol were a mixture of ammonium sul-fate, ammonium bisulsul-fate, and sulfuric acid. The residual ions were chlorine, nitrate, methanesulfonate, sodium, potas-sium, magnepotas-sium, and calcium. Especially for Legs 4 and 5 during INDOEX, residual ions were only 15% for particles of 80 nm<Dae<184 nm (first impactor stage, Fig. 2) and 10%
for 184 nm<Dae<308 nm (second impactor stage, Fig. 2).
Figure 3 shows the molar ratio of ammonium ions to sul-fate ions calculated for particles in these two size ranges. During Aerosols99 (Atlantic Ocean, Legs 1–2), for all time periods, the ratio for particles of 80 nm<Dae<184 nm
was smaller than 0.8, whereas during INDOEX (Indian Ocean, Legs 3–5), it ranged between 0.8 and 1.2. During both field studies, this ratio was most of the time higher for particles of 184 nm<Dae<308 nm than for particles of
80 nm<Dae<184 nm. One reason for this higher ratio might
be aging processes. Particles with larger diameters might have resided longer in the atmosphere, and thus water sol-uble material might have condensed on them or they might have been cloud processed and thereby became more neutral-ized. Here, “cloud processed” means the activation of a par-ticle to a cloud droplet and the condensation of condensable material onto the particle. The results from higher impactor stages support this conclusion.
For Aerosols99 and INDOEX, the ion balance was calcu-lated taking into account all measured cations and anions and their charges following Eq. (2):
ion − balance =P a × (n(cation
a+)) −P b × (n(anionb−)) P a × (n(cationa+)) +P b × (n(anionb−)). (2)
The parameter n is here the amount of substance and a and b are the charges of cations and anions. The ion balance for both impactor stages is presented in Fig. 4. For most time periods during both experiments, the ion balance shows a negative value assuming that H+was a main component of the observed aerosol. This tendency is more pronounced for the first impactor stage.
The ratio of ammonium ions to sulfate ions together with the presented ion balance indicate that especially for the first impactor stage the inorganic fraction of the aerosol over the Atlantic Ocean (Figs. 3 and 4, Aerosols99, Legs 1–2) was mainly composed of sulfuric acid, whereas the aerosol over the Indian Ocean (Figs. 3 and 4, INDOEX, Legs 3–5) was composed of a mixture of ammonium sulfate and ammonium bisulfate.
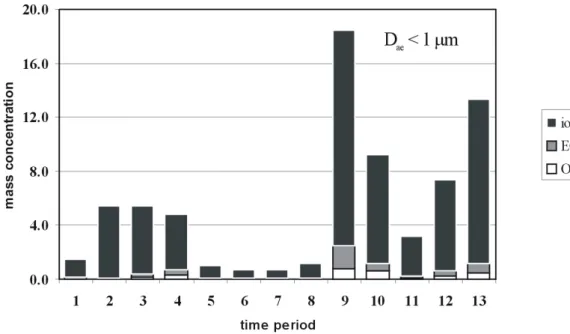
4.2 Total aerosol mass
Table 1 lists the total aerosol mass concentration and the mass concentrations of EC (elemental carbon mass) and OC (organic carbon mass) for particles of Dae<1 µm, and Fig. 5
Fig. 3. Molar ratio of ammonium ions to sulfate ions for particles with 80 nm<Dae<184 nm (collected on the first impactor stage) and for 184 nm<Dae<308 nm (second impactor stage) measured during Aerosols99 (Atlantic Ocean) and INDOEX (Indian Ocean).
Fig. 4. Ion balance of all inorganic ions for particles with 80 nm<Dae<184 nm (collected on the first impactor stage) and for
184 nm<Dae<308 nm (second impactor stage) measured during Aerosols99 (Atlantic Ocean) and INDOEX (Indian Ocean).
two field studies. The total aerosol mass concentration was significantly higher for those air masses that were continen-tally influenced (e.g., time periods 2, 3, 4, 9, 10, 12, 13).
During Aerosols99, the highest aerosol mass concentra-tion (5.45 µg/m3) occurred in time period 3 (DOY 25–27), when air masses polluted by African dust and biomass burn-ing reached the ship. High aerosol mass concentrations ex-ceeding 4 µg/m3also occurred in time period 2 (DOY 23– 25, African dust air mass) and time period 4 (DOY 27–29.8, biomass burning in the ITCZ), whereas concentrations lower than 1.5 µg/m3were detected when marine air masses were
encountered. Here, during time period 2, it is shown that mineral dust is extending into the fine aerosol fraction.
During INDOEX in time period 9 (DOY 63.5–66.5), air masses influenced by the Indian Subcontinent arrived at the ship, evidenced by an increase in total aerosol mass concen-tration up 18.44 µg/m3. In general, the highest concentration of aerosol mass occurred in this time period 9, which was characterized by air masses that had crossed the Indian Sub-continent 12 to 36 hours before they reached the ship.
Fig. 5. Mass concentration of elemental carbon (EC), organic carbon (OC), and inorganic ions in µg/m3 for particles with Dae<1 µm
measured during Aerosols99 and INDOEX.
4.3 Carbonaceous aerosol
Time period 3 (DOY 25–27) shows a mixture of air masses from northern and western Africa, as evidenced by the higher mass concentration of EC (Table 1). Time period 4 (DOY 27–29.8) was exclusively influenced by biomass burn-ing (Bates et al., 2001). For the time period influenced by mixed air masses (time period 3, DOY 25–27), the mass concentration of EC reached 0.30 µg/m3 in the sub-µm size range (Table 1). The increase in EC concentration to 0.43 µg/m3during the subsequent time period 4 (DOY 27– 29.8) indicates a change in air mass to one that is influenced only by biomass burning. For both time periods, an increase in mass concentration of OC was also detected (0.12 µg/m3 and 0.28 µg/m3, respectively). Lower OC concentrations of 0.1 µg/m3 OC were typical in the sub-µm size range for clean marine air masses that had no land contact for five to six days (Table 1). Here, based on the field blank mean val-ues taken several times during the field studies, the detection limits (95% confidence level) were 0.16 µg/m3 for OC and 0.07 µg/m3 for EC for a typical day/night sampling period (Neus¨uß et al., 2002). Therefore, all of the OC and EC con-centrations for clean marine air masses during Aerosols99 were close to the detection limits.
The highest concentration of EC in the sub-µm size range (1.64 µg/m3) occurred in time period 9, when air masses from the Indian Subcontinent reached the ship (INDOEX, DOY 63.5–66.5, Table 1). Here, individual values of about 2.0 µg/m3 were detected. In contrast to the analysis of the major inorganic ions, the analysis of OC and EC in the col-lected samples showed significant variations, which can be
explained by differently polluted air masses encountered dur-ing the field studies. A key result of this EC and OC analysis is that mass concentrations of EC were detected only for con-tinentally influenced air masses (Table 1). It is evident, that also air masses that had land contact several days before they reached the ship show increased values of aerosol mass and particularly of elemental carbon mass concentration. 4.4 Light absorption
In Table 1, the mean values of the light absorption coefficient measured with the PSAP are listed. The measured coeffi-cients correlate well with the data obtained for EC; increas-ing mass concentrations of EC correspond with increasincreas-ing absorption coefficients. For INDOEX, Neus¨uß et al. found an absorption efficiency of around 14 m2/g for all air masses except the most polluted cases (Indian Subcontinent and di-rectly to the ship) (2002). For time period 3 (mixed air mass: African dust and biomass burning, Aerosols99, DOY 25–27), the light absorption coefficient reached individual values of 8 Mm−1, for time period 4 (biomass burning, Aerosols99, DOY 25–27.8) 13 Mm−1, and for time period 9 (Indian
Sub-continent and directly to the ship, INDOEX, DOY 63.5– 66.5) 20 Mm−1. In contrast, the coefficients for clean
ma-rine air masses were near or less than the detection limit of 0.34 Mm−1 (Quinn et al., 2001, 2002). Thus, the EC con-centration together with the measured light absorption coef-ficient indicate that time periods 2, 3, 4, 9, 10, 12, and 13 were mainly continentally influenced. This indication is sup-ported by the back-trajectory analysis done by Bates et al. (2001) and Quinn et al. (2002).
4.5 Hygroscopicity
In this presentation, all particles were classified into three different groups appearing as three different modes in the hygroscopic growth distributions: nearly hydrophobic, less-hygroscopic, and more-hygroscopic.
The hygroscopic properties as determined by the HT-DMA are presented here as two parameters: the hygroscopic growth factor for each of the observed growth groups as a function of RH and the initial dry sizes, and the particle number fraction in each group.
4.5.1 Growth factors of different aerosol types measured at 90% RH
More-hygroscopic particles
Figure 6 shows the hygroscopic growth factors measured at 90% RH for particles with initial dry sizes of 50, 150, and 250 nm for each time period of the field studies. In general, a more- hygroscopic fraction of aerosol particles was detected at 90% RH for all time periods and for all sizes. The average growth factors for this fraction at 90% RH ranged between 1.66 and 1.74 for 50 nm particles, between 1.80 and 1.93 for 150 nm particles, and between 1.84 and 2.03 for 250 nm par-ticles. The mean values averaged for the different time peri-ods are listed in Tables 2–4 and 6–8. These values agree with those for marine aerosols measured during ACE 1 (Aerosol Characterization Experiment 1) over the Pacific Ocean and Southern Ocean, namely, 1.66 for 50 nm particles and 1.78 for 150 nm particles (Berg et al., 1998). The smallest aver-age growth factors for the more-hygroscopic particle group at 90% RH occurred for the air mass influenced by biomass burning in the ITCZ during time period 4 (Aerosols99, Fig. 6, DOY 27–29.8), namely, 1.68 (50 nm particles), 1.8 (150 nm), and 1.84 (250 nm). In contrast, the average growth factors for the clean marine air masses ranged between 1.66 and 1.74 (50 nm), 1.86 and 1.93 (150 nm), and 1.91 and 2.03 (250 nm). The highest average growth factors occurred during time pe-riod 6 (Aerosols99, Fig. 6, DOY 43–48.5), when southern Atlantic marine air masses were encountered, namely, 1.93 (150 nm) and 2.03 (250 nm). These high growth factors can be explained by the chemical composition of the particles, which show small concentrations of sodium and chloride at this size, implying that sea salt particles were included in the measurements. In general, highest growth factors for accu-mulation mode particles were found during Leg 1–3, when marine air masses were encountered and sometimes small concentrations of sea salt were detected.
During INDOEX, the change in air mass from time period 8 (Southern Hemisphere portion of the Marine Indian Ocean, Fig. 6, DOY 54–56.6 and 78.25–79.5) to time period 9 (Indian Subcontinent and directly to the ship, Fig. 6, DOY 63.5–66.5) corresponds with the change in hygroscopic growth factors from 1.89 to 1.82 (150 nm) and from 1.98 to 1.89 (250 nm).
Less-hygroscopic particles
For both field studies, less-hygroscopic particle fractions were detected only during those time periods when the ship encountered continentally influenced air masses (e.g., time periods 3, 4, 9, 10, 12, 13). This corresponds with increasing EC concentrations, which were detected only during those time periods.
For Aerosols99, less-hygroscopic particle fractions were detected only during time periods 3 and 4 (Fig. 6, DOY 25– 27, 27–29.8), when the air masses were affected by biomass burning. For these two time periods, the average growth fac-tors for the less-hygroscopic particle group were between 1.44 and 1.50 (50 nm), between 1.45 and 1.47 (150 nm), and between 1.30 and 1.39 (250 nm). During INDOEX, the smallest growth factors of less-hygroscopic particles (150 nm and 250 nm) were detected during time period 9 (Fig. 6, DOY 63.5–66.5), when Indian Subcontinent air masses with a transport time between 12 and 36 hours were encountered. In this time period, average growth factors reached 1.54 for the 150nm particles and 1.59 for the 250 nm particles.
In contrast, the growth factor for the less-hygroscopic par-ticles during ACE 1 were between 1.24 and 1.39 (50 nm) and between 1.33 and 1.36 (165 nm) and also occurred only for polluted air masses (Berg et al., 1998).
Generally, growth factors of less-hygroscopic particles indicate that these particles were composed of both soluble and insoluble material. This mixture suggests that these particles were emitted by anthropogenic sources and altered during their transport between the continent and the ship. This result indicates that aging processes play a major role in hygroscopic properties of aerosol particles and their effect on climate.
Hydrophobic particles
During Aerosols99, a third mode of particles with growth factors smaller than 1.3, which might be classified as nearly hydrophobic particles, were not detected for any time period. The reason is that only aged aerosols (cloud processing, con-densation of soluble material) were encountered.
In contrast, during time period 9 (INDOEX, Fig. 6, DOY 63.5–66.5), when air masses from the Indian Subcon-tinent arrived at the ship, three types of particle fractions were detected (less-hygroscopic, more-hygroscopic, and nearly hydrophobic). In this case, particles with growth factors smaller than 1.3 were labeled as nearly hydrophobic particles. For this time period, the highest light absorption coefficient as well as the highest EC concentration were measured. The nearly hydrophobic particle group had growth factors between 1.15 and 1.3.
Fig. 6. Averaged hygroscopic growth factors measured at 90% RH and number fractions of less-hygroscopic particles for particles with dry
Table 2. Average growth factors of more- and less-hygroscopic particle groups and number fraction of less-hygroscopic particle group of
particles with an initial dry size of 50nm for observed air masses with different origin during Aerosols99
Time Relative humidity, Hygroscopic growth factor Hygroscopic growth factor Number of observations Number fraction of less-hygroscopic period RH[%] (more-hygroscopic fraction) +/− sd (less-hygroscopic fraction) +/− sd (more/less-hygroscopic fraction) particles +/− sd
1 90 1.66+/−0.03 – 14/– – 75 1.35+/−0.01 – 16/– – 55 1.19+/−0.01 – 12/– – 30 1.08+/−0.01 – 15/– – 2 90 1.74+/−0.04 – 10/– – 75 1.36 – 1/– – 55 1.20+/−0.01 – 2/– – 30 1.08+/−0.01 – 2/– – 3 90 1.73+/−0.03 1.50+/−0.08 5/5 0.22+/−0.08 75 1.37+/−0.01 1.20+/−0.02 7/6 0.19+/−0.08 55 1.17+/−0.01 – 6/– – 30 1.07+/−0.01 – 6/– – 4 90 1.68+/−0.05 1.44+/−0.07 14/9 0.49+/−0.17 75 1.32+/−0.02 1.19 4/1 0.19 55 1.15+/−0.02 – 4/– – 30 1.06+/−0.02 – 2/– – 5 90 1.74+/−0.02 – 15/– – 75 1.39+/−0.02 – 11/– – 55 1.22+/−0.02 – 10/– – 30 1.11+/−0.02 – 12/– – 6 90 1.72+/−0.05 – 28/– – 75 1.40+/−0.03 – 9/– – 55 1.24+/−0.01 – 9/– – 30 1.12+/−0.01 – 9/– – 7 90 1.70+/−0.03 – 9/– – 75 1.37+/−0.03 – 3/– – 55 1.22+/−0.01 – 4/– – 30 1.11+/−0.01 – 3/– – Number fractions
The average number fraction of less-hygroscopic parti-cles was about 22% (50 nm) and 46% (150 nm) for time period 3 (mixed: African dust and biomass burning in the ITZC, Aerosols99, DOY 25–27) and increased to approx-imately 49% (50 nm) and 66% (150 nm) for time period 4 (biomass burning in the ITZC, Aerosols99, DOY 27–29.8). The higher fraction in time period 4 corresponds with a much higher EC concentration in time period 4 (0.43 µg/m3) than in time period 3 (0.30 µg/m3) for sub-µm particles, although the total aerosol mass decreased. This correspondence indi-cates that less-hygroscopic particles were mainly composed of EC.
The number fraction of less-hygroscopic particles for time period 9 (INDOEX, DOY 63.5–66.5) averaged between 35 and 41% depending on dry particle size, the number fraction of nearly hydrophobic particles averaged between 5 to 7%. In this time period, these particles were from Indian Subconti-nent air masses arriving at the ship. The back-trajectory anal-ysis shows a travel time of 12 to 36 hours for these air masses
to reach the ship from the continent. These high number frac-tions correspond to the highest measured EC-concentration (1.64 µg/m3) during the cruise. As high number fractions were also detected during other continentally polluted time periods during INDOEX, only a few observations of less-hygroscopic particles were made during these time periods. Time periods 10, 12, and 13 show travel times of several days for the air masses between the ship and the continent and thus the occurrence of less-hygroscopic particles was more infre-quent, because the particles probably changed their compo-sition by aging (cloud processing, condensation from the gas phase, accumulation).
Overall, continentally influenced marine air masses could be identified during both field studies by the occurrence of less-hygroscopic and nearly hydrophobic groups of aerosol particles. A strong continental influence was indicated to in-creased concentrations of sub-µm elemental carbon related to high values of number fractions of less-hygroscopic parti-cles.
Table 3. Average growth factors of more- and less-hygroscopic particle groups and number fraction of less-hygroscopic particle group of
particles with an initial dry size of 150nm for observed air masses with different origin during Aerosols99
Time Relative humidity, Hygroscopic growth factor Hygroscopic growth factor Number of observations Number fraction of less-hygroscopic period RH[%] (more-hygroscopic fraction) +/− sd (less-hygroscopic fraction) +/− sd (more/less-hygroscopic fraction) particles +/− sd
1 90 1.86+/−0.05 – 11/– – 75 1.48+/−0.01 – 11/– – 55 1.30+/−0.01 – 12/– – 30 1.15+/−0.01 – 19/– – 2 90 1.90+/−0.03 – 9/– – 75 1.47 – 1/– – 55 1.26+/−0.03 – 2/– – 30 1.13+/−0.02 – 2/– – 3 90 1.90+/−0.03 1.47+/−0.13 5/5 0.46+/−0.19 75 1.44+/−0.02 1.17+/−0.03 6/5 0.46+/−0.18 55 1.18+/−0.04 – 4/– – 30 1.10+/−0.01 – 6/– – 4 90 1.80+/−0.05 1.45+/−0.06 10/10 0.66+/−0.09 75 1.25 – 1/– – 55 1.14+/−0.01 – 4/– – 30 1.08+/−0.01 – 3/– – 5 90 1.88+/−0.03 – 15/– – 75 1.48+/−0.02 – 11/– – 55 1.29+/−0.02 – 11/– – 30 1.17+/−0.03 – 12/– – 6 90 1.93+/−0.03 – 24/– – 75 1.51+/−0.03 – 10/– – 55 1.33+/−0.01 – 8/– – 30 1.19+/−0.01 – 9/– – 7 90 1.90+/−0.05 – 9/– – 75 1.50+/−0.04 – 4/– – 55 1.31+/−0.01 – 4/– – 30 1.18+/−0.01 – 4/– –
4.5.2 Growth factors of different aerosol types measured at 75% RH
For the hygroscopic growth factors measured at 75% RH , the trends are similar to those seen for the factors mea-sured at 90% RH (Fig. 6). Average growth factors of more-hygroscopic particles were between 1.32 and 1.40 (50 nm), between 1.25 and 1.51 (150 nm), and between 1.39 and 1.54 (250 nm). In contrast, less-hygroscopic particles mea-sured at 75% RH ranged between 1.17 and 1.20 (50 nm), 1.17 and 1.20 (150 nm), and 1.12 and 1.29 (250 nm) de-pending on the type of air mass. Nearly hydrophobic par-ticles and less-hygroscopic parpar-ticles could not be separated in two modes at 75% RH . The growth factors of the more-hygroscopic particle fraction correspond to the high growth factors measured at 90% RH for this particle fraction. This correspondence implies that these particles were composed of high amounts of hygroscopically active material, as dis-cussed earlier for the chemical inorganic composition that showed ammonium and sulfate dominating the molar dis-tribution. The less-hygroscopic particles measured at 75%
RHoccurred only when continentally influenced air masses were encountered, corresponding to increased mass concen-trations of EC (Table 1).
4.5.3 Growth factors of different aerosol types measured at 55% and at 30% RH
For the hygroscopicity measurements done at 30 and 55% RH, the hygroscopic growth distribution appeared in one mode, hence less-hygroscopic and more-hygroscopic parti-cles could not be distinguished. Figure 7 shows the hygro-scopic growth factors measured at 55% RH .
During Aerosols99, a remarkable decrease in hygroscopic growth at 55% RH occurred for continentally influenced air masses and for all three particle sizes (time periods 2–4, Figs. 7a, b and c, DOY 23–29.8). For Aitken mode particles (Dp=50 nm, Fig. 7a), the average growth factor for the ma-rine air masses ranged from 1.19 to 1.24, whereas that for the continentally influenced air masses ranged from 1.15 to 1.20. For accumulation mode particles (Dp=150 and 250 nm), this decrease in hygroscopic growth was greater (Figs. 7b and c).
Fig. 7. Averaged hygroscopic growth factors measured at 55% RH for particles with dry particle diameter Dp of (a) 50 nm, (b) 150 nm, and (c) 250 nm measured during Aerosols99 and INDOEX.
A reduction in hygroscopic growth for continentally influ-enced air masses also occurred at 30% RH . Although parti-cles generally absorb only small amounts of water at this low RH, the difference in hygroscopic growth was evident be-tween clean marine air masses and continentally influenced air masses (Table 1/Fig. 7).
One reason for this behavior might be the very complex chemical composition during these continentally influenced time periods. Besides ammonium and sulfate also potassium and calcium was found in these determined size ranges. The decrease in RH from 90% to 55% might cause recrystal-lization for some compounds in the particle that are at 90%
Table 4. Average growth factors of more- and less-hygroscopic particle groups and number fraction of less-hygroscopic particle group of
particles with an initial dry size of 250nm for observed air masses with different origin during Aerosols99
Time Relative humidity, Hygroscopic growth factor Hygroscopic growth factor Number of observations Number fraction of less-hygroscopic period RH[%] (more-hygroscopic fraction) +/− sd (less-hygroscopic fraction) +/− sd (more/less-hygroscopic fraction) particles +/− sd
1 90 – – – – 75 – – – – 55 – – – – 30 – – – – 2 90 – – – – 75 – – – – 55 – – – – 30 – – – – 3 90 1.91+/−0.03 1.30+/−0.03 9/9 0.54+/−0.01 75 1.41+/−0.06 1.12+/−0.01 4/4 0.49+/−0.15 55 – – – – 30 1.11+/−0.01 – 6 – 4 90 1.84+/−0.09 1.39+/−0.08 12/12 0.57+/−0.09 75 – – – – 55 1.13+/−0.01 – 3 – 30 1.09+/−0.01 – 4 – 5 90 1.96+/−0.04 – 16/– – 75 1.52+/−0.02 – 11/– – 55 1.32+/−0.03 – 11 – 30 1.17+/−0.03 – 10 – 6 90 2.03+/−0.02 – 2/– – 75 1.54+/−0.01 – 2/– – 55 1.37 – 1 – 30 1.14+/−0.03 – 4 – 7 90 1.93+/−0.09 – 8/– – 75 1.54+/−0.05 – 4/– – 55 1.35+/−0.01 – 3 – 30 1.20+/−0.01 – 4 –
RH completely water soluble. Tang and Munkelwitz found a very difficult deliquescence and recrystallization behavior for mixed salt particles (1993).
During INDOEX, a decrease in hygroscopic growth at 55% RH occurred between time period 8 (Southern Hemi-sphere portion of the Marine Indian Ocean, Fig. 7, DOY 54– 56.6) to time period 9 (Indian Subcontinent and directly to the ship, Fig. 7, DOY 63.5–66.5). This decrease was particu-larly evident for the accumulation mode particles. However, variations in hygroscopic growth during INDOEX at 30% and 55% RH between different air masses were small, and were only noticeable for the change in air mass between time period 8 (Southern Hemisphere portion of the Marine Indian Ocean) and time period 9 (Indian Subcontinent and directly to the ship) and for particles with initial dry sizes of 150 and 250 nm.
4.5.4 Parameterization of hygroscopic growth of more-hygroscopic particles
Information on hygroscopic growth of aerosol particles is critical in determining the influence of such particles on the
earth’s radiative budget. The increase in particle size due to the uptake of water is an important parameter for char-acterizing aerosol particles at ambient conditions. Models dealing with the impact of aerosol particles on the radiative balance need this information to calculate size distributions at ambient RH in the highly varying humidity field of the troposphere. Based on a parameterization by Swietlicki et al. (1999), we derived a parameterization of hygroscopic growth from the hygroscopic growth data measured at 90, 75, 55, and 30% RH for all measured particle sizes. There-fore, a simple function with two fit parameters (Eq. 3) has been adapted to the data obtained during Aerosols99 and IN-DOEX:
gf (RH ) = A × (1 − RH )γ. (3)
This parameterization is only valid for 30%≤RH ≤90%. In this equation, RH is not a percentage but rather a number between 0 and 1, defined as the ratio between the actual wa-ter vapor pressure and the saturation wawa-ter vapor pressure. The fit parameters, A and γ , were derived for the averaged growth factors of the more-hygroscopic particle fractions at 90% and at 75% RH and for the single hygroscopic growth
Fig. 8. Parametric fit of hygroscopic growth factors (more-hygroscopic particle fraction) measured at 30, 55, 75, and 90% RH for particles
with dry particle diameter Dp of (a) 50 nm, (b) 150 nm, and (c) 250 nm measured for a southern Indian Ocean marine air mass during Aerosols99. The error bars display the standard deviation of the averaged measured values.
Fig. 9. Parametric fit of hygroscopic growth factors (more-hygroscopic particle fraction) measured at 30, 55, 75 and 90% RH for particles
with dry particle diameter Dp=50 nm measured for different air masses during Aerosols99. The error bars display the standard deviation of the averaged measured values.
Table 5. Fit parameters derived using Eq. (3) for hygroscopic growth factors at 30, 55, 75, and 90% RH during Aerosols99
Time period Dry particle diameter, Dp=50 nm Dry particle diameter, Dp=150 nm Dry particle diameter, Dp=250 nm 1 A=0.9966+/−0.0028 A=1.0600+/−0.0086 –
γ=−0.2212+/−0.0017 γ=−0.2440+/−0.0049 – 2 A=0.9812+/−0.0141 A=1.0182+/−0.0081 –
γ=−0.2467+/−0.0087 γ=−0.2699+/−0.0047 –
5 A=1.1014+/−0.0084 A=1.0614+/−0.0109 A=1.0624+/−0.0092
γ=−0.2333+/−0.0050 γ=−0.2468+/−0.0062 γ=−0.2649+/−0.0052 6 A=1.0365+/−0.0043 A=1.0837+/−0.0134 A=1.0544+/−0.0324
γ=−0.2196+/−0.0025 γ=−0.2490+/−0.0075 γ=−0.2840+/−0.0182 7 A=1.0207+/−0.0100 A=1.0751+/−0.0084 A=1.1051+/−0.0067
γ=−0.2201+/−0.0060 γ=−0.2462+/−0.0047 γ=−0.2420+/−0.0037
Fig. 10. Hygroscopic growth factors of the less-hygroscopic particles with an initial dry size of 50 and 150 nm found during different time
periods. The error bars display the standard deviation of the averaged measured values.
mode found at 55% and at 30% RH . Figure 8 shows the parametric fits for dry particle sizes of 50, 150, and 250 nm for the Southern Indian Ocean marine air mass encountered in time period 7 during Aerosols99.
Generally, the calculated and measured hygroscopic growth factors increased with increasing dry particle size. The similarity in the shape of these curves shows that par-ticles exhibited similar behavior in hygroscopic growth, al-though the growth itself differed and this difference was greater between the 50 nm and 150 nm particles than be-tween the 150 nm and 250 nm particles. One reason for this difference is the Kelvin effect, which mainly affects parti-cles smaller than 100 nm in diameter. Based on a model by Tang and Munkelwitz (1994), a pure ammonium
sul-fate particle with a dry size of 50 nm shows a growth fac-tor of 1.65 at 90% RH and particles of dry sizes of 150 and 250 nm grow up to values of 1.71 and 1.72. This in-dicates that differences in growth between Aitken and accu-mulation mode particles can not only be explained by this effect for the given time period. Another reason might be that during this time period the accumulation mode particles (impactor stage two: 184 nm<Dae<308 nm) also included
sea salt as discussed in the chemistry section. This sea salt might lead to an increase in hygroscopic growth, especially at high RH . Thus, the difference in hygroscopic growth be-tween 150 nm and 250 nm particles is small for this given air mass (time period 7, Southern Indian Ocean marine air mass, Aerosols99). This behavior was generally observed
Table 6. Average growth factors of more-hygroscopic, less-hygroscopic, and nearly hydrophobic particle groups and number fraction of
less-hygroscopic particle group of particles with an initial dry size of 50nm for observed air masses with different origin during INDOEX Time Relative Hygroscopic growth factor Hygroscopic growth factor Hygroscopic growth factor Number of observations Number fraction of Number fraction of period humidity, (more-hygroscopic fraction) (less-hygroscopic fraction) (nearly hydrophobic fraction) (more-hygroscopic/ less-hygroscopic nearly hydrophobic
RH[%] +/− sd +/− sd +/− sd less-hygroscopic/ particles +/− sd particles +/− sd nearly hydrophobic fraction)
8 90 1.68+/−0.01 – – 10/–/– – – 75 1.36+/−0.02 – – 5/–/– – – 55 1.19+/−0.02 – – 4/–/– – – 30 1.09+/−0.02 – – 7/–/– – – 9 1.71+/−0.01 1.52+/−0.02 1.24+/−0.03 7/7/2 0.41+/−0.13 0.07+/−0.03 75 1.34+/−0.02 1.17+/−0.01 – 4/4/– 0.26+/−0.13 – 55 1.16+/−0.02 – – 4/–/– – – 30 1.07+/−0.01 – – 4/–/– – – 10 1.73+/−0.02 – – 42/–/– – – 75 1.37+/−0.02 – – 10/–/– – – 55 1.21+/−0.01 – – 10/–/– – – 30 1.10+/−0.01 – – 10/–/– – – 11 1.71+/−0.03 – – 20/–/– – – 75 1.35+/−0.02 – – 8/–/– – – 55 1.19+/−0.01 – – 9/–/– – – 30 1.09+/−0.01 – – 3/–/– – – 12 1.73+/−0.05 1.43+/−0.19 – 19/2/– 0.23+/−0.22 – 75 1.35+/−0.06 – – 5/–/– – – 55 1.18+/−0.01 – – 6/–/– – – 30 1.09+/−0.02 – – 8/–/– – – 13 – – – – – – 75 – – – – – – 55 – – – – – – 30 1.07 – – 1/–/– – –
during both field experiments for the marine air masses, be-cause Aitken mode particles principally are formed by dif-ferent mechanisms in the marine boundary layer in contrast to accumulation mode particles.
Figure 9 shows a comparison of parametric fits for 50 nm particles (more-hygroscopic) for clean marine air masses in time period 6 (South Atlantic marine air mass, Aerosols99) and time period 8 (Marine Indian Ocean air mass, INDOEX), and for the continentally polluted air masses in time period 4 (biomass burning in the ITCZ, Aerosols99). At low RH (≤75%), the difference in hygroscopic growth between the two types of air masses was significant, whereas at high RH (≥75%), the difference was small. These trends shown in Fig. 9 were independent of particle size. Indeed, these differ-ences disappear with increasing RH . A possible reason for this effect of RH could be that at high RH the growth factors for more- and less-hygroscopic particles are observed as sep-arate modes, whereas at low RH , these modes are no more resolved. This results in a common single mode growth tor which underestimates the more-hygroscopic growth fac-tor, and overestimates the less-hygroscopic one. On the other hand a considerable shift in growth between period 6 and pe-riod 8 was observed. This shift can be explained by the slight
difference in chemical composition for Aitken mode parti-cles. Only time period 8 was influenced by small concentra-tions of sodium and chloride ions in this size range leading to higher growth factors in this time period in contrast to time period 6.
The parametric fits explain well the hygroscopic behav-ior for the clean marine air masses. For the polluted air masses, the parametric fits do not always match the exper-imental value and its standard deviation. The parameteriza-tion using Eq. (3) is a good tool for describing hygroscopic growth of aerosol particles in unpolluted air masses at vari-ous RH . The fit results using A and γ as fit parameters for all marine time periods are listed in Tables 5 and 9.
4.5.5 Hygroscopic growth of less-hygroscopic particles Figure 10 shows the hygroscopic growth factors for the less-hygroscopic particles (50 nm and 150 nm) together with the single hygroscopic growth mode determined at 55% and at 30% RH during time period 4 (biomass burning in the ITCZ, Aerosols99) and 9 (Indian Subcontinent and directly to the ship, INDOEX). As was mentioned before, less- and more-hygroscopic particles could not be separated at low RH of
Table 7. Average growth factors of more-hygroscopic, less-hygroscopic, and nearly hydrophobic particle groups and number fraction of
less- hygroscopic particle group of particles with an initial dry size of 150nm for observed air masses with different origin during INDOEX Time Relative Hygroscopic growth factor Hygroscopic growth factor Hygroscopic growth factor Number of observations Number fraction of Number fraction of period humidity, (more-hygroscopic fraction) (less-hygroscopic fraction) (nearly hydrophobic fraction) (more-hygroscopic/ less-hygroscopic nearly hydrophobic
RH[%] +/− sd +/− sd +/− sd less-hygroscopic/ particles +/− sd particles +/− sd nearly hydrophobic fraction)
8 90 1.89+/−0.02 – – 10/–/– – – 75 1.45+/−0.04 – – 6/–/– – – 55 1.26+/−0.02 – – 5/–/– – – 30 1.15+/−0.03 – – 5/–/– – – 9 90 1.82+/−0.07 1.54+/−0.10 1.31+/−0.10 9/8/4 0.36+/−0.16 <0.05 75 1.37+/−0.02 1.20+/−0.07 – 3/2/– 0.33+/−0.19 – 55 1.19+/−0.02 – – 4/–/– – – 30 1.11+/−0.01 – – 4/–/– – – 10 90 1.88+/−0.04 1.71+/−0.03 1.36+/−0.01 38/8/2 0.42+/−0.09 <0.05 75 1.41+/−0.02 – – 10/–/– – – 55 1.24+/−0.01 – – 10/–/– – – 30 1.13+/−0.01 – – 9/–/– – – 11 90 1.88+/−0.03 1.60+/−0.03 – 23/3/– 0.13+/−0.06 – 75 1.42+/−0.03 1.18 – 6/1/– 0.13 – 55 1.24+/−0.01 – – 8/–/– – – 30 1.08+/−0.01 – – 6/–/– – – 12 90 1.85+/−0.06 1.70+/−0.03 – 19/3/– 0.52+/−0.10 – 75 1.39+/−0.03 – – 7/–/– – – 55 1.22+/−0.03 – – 7/–/– – – 30 1.12+/−0.02 – – 8/–/– – – 13 90 – – – – – – 75 1.35+/−0.03 – – 2/–/– – – 55 1.20+/−0.01 – – 2/–/– – – 30 1.11 – – 1/–/– – –
30 and 55%, and thus only one growth factor was measured, leading to a small overestimation of the hygroscopic growth of these less-hygroscopic particles.
The hygroscopic growth for less-hygroscopic particles sharply increased from 75% to 90% RH (Fig. 10). This im-plies that the soluble fraction of the particles was not only inorganic salts. One reason for the sharp increase in hygro-scopic growth from 75 to 90% RH of less-hygrohygro-scopic parti-cles might be the complex chemical composition during time periods that were influenced by continental air masses. Be-side having a high EC concentration mixed with soluble ma-terial, especially these less-hygroscopic particles might also contain organic material, which might influence the growth process. Organic material is known to show slight hygro-scopicity and the knowledge about hygroscopic behavior of mixed particles is very limited up to now. The OC concen-tration was 0.28 (Aerosols99) and 0.81 µg/m3 (INDOEX) for sub-µm particles during the time periods 4 and 9 (Ta-ble 1). Saxena et al. (1995) found that for aged, nonurban air masses, organics contribute to the water uptake by inorgan-ics, although the mechanism is not well understood.
5 Summary and Conclusions
Hygroscopic properties of aerosol particles were determined during two field studies, Aerosols99 (Atlantic Ocean) and INDOEX (Indian Ocean), on the U.S. Research Vessel Ronald H. Brown and were compared to concurrently mea-sured chemical and optical properties of the particles. The Aerosols99 field study covered the Northern and Southern Hemisphere portions of the Atlantic Ocean, whereas the INDOEX field study covered both hemispheres of the In-dian Ocean. During Aerosols99, marine air masses origi-nating from the northern and southern Atlantic Ocean and air masses continentally influenced by Saharan mineral dust or biomass burning from western Africa were encountered. During INDOEX, clean marine air masses that had no land contact for five to six days originating in the Indian Ocean as well as polluted air masses having crossed the Indian Sub-continent or Arabia were encountered. The field studies in-volved a total of 13 consecutive time periods, ranging from one to six days each.
Hygroscopic properties were measured using an HTDMA system for particles with initial dry sizes (Dp) of 50, 150, and 250 nm and at relative humidities (RH ) of 30, 55, 75, and
Table 8. Average growth factors of more-hygroscopic, less-hygroscopic, and nearly hydrophobic particle groups and number fraction of
less- hygroscopic particle group of particles with an initial dry size of 250nm for observed air masses with different origin during INDOEX Time Relative Hygroscopic growth factor Hygroscopic growth factor Hygroscopic growth factor Number of observations Number fraction of Number fraction of period humidity, (more-hygroscopic fraction) (less-hygroscopic fraction) (nearly hydrophobic fraction) (more-hygroscopic/ less-hygroscopic nearly hydrophobic
RH[%] +/− sd +/− sd +/− sd less-hygroscopic/ particles +/− sd particles +/− sd nearly hydrophobic fraction)
8 90 1.98+/−0.06 – – 4/–/– – – 75 1.48+/−0.04 – – 4/–/– – – 55 1.30+/−0.01 – – 2/–/– – – 30 1.16+/−0.03 – – 6/–/– – – 9 90 1.89+/−0.04 1.59+/−0.05 1.16+/−0.03 14/14/5 0.35+/−0.07 <0.05 75 1.42+/−0.01 1.29 – 2/1/– 0.42 – 55 1.22+/−0.02 – – 4/–/– – – 30 1.13+/−0.01 – – 4/–/– – – 10 90 1.88+/−0.05 1.66+/−0.08 – 34/11/– 0.49+/−0.22 – 75 1.41+/−0.03 1.26 – 7/1/– 0.25 – 55 1.23+/−0.02 – – 10/–/– – – 30 1.13+/−0.01 – – 10/–/– – – 11 90 1.91+/−0.04 1.63+/−0.15 – 20/2/– 0.18+/−0.03 – 75 1.44+/−0.03 1.15+/−0.02 – 7/5/– 0.08+/−0.02 – 55 1.25+/−0.01 – – 7/–/– – – 30 1.13+/−0.01 – – 6/–/– – – 12 90 1.88+/−0.06 1.67+/−0.04 – 8/7/– 0.44+/−0.12 – 75 1.40+/−0.01 1.18 – 3/1/– 0.12 – 55 1.23+/−0.02 – – 6/–/– – – 30 1.13+/−0.02 – – 7/–/– – – 13 90 – – – – – – 75 1.39 – – 1/–/– – – 55 1.21+/−0.01 – – 2/–/– – – 30 1.12+/−0.01 – – 2/–/– – –
Table 9. Fit parameters derived using Eq. (3) for hygroscopic growth factors at 30, 55, 75, and 90% RH during INDOEX
Time period Dry particle diameter, Dp=50 nm Dry particle diameter, Dp=150 nm Dry particle diameter, Dp=250 nm 8 A=0.9990+/−0.0063 A=1.0273+/−0.0210 A=1.0335+/−0.0268
γ=−0.2250+/−0.0038 γ=−0.2620+/−0.0122 γ=−0.2789+/−0.0154 11 A=0.9829+/−0.0192 A=0.9756+/−0.0169 A=1.0042+/−0.0229
γ=−0.2427+/−0.0118 γ=−0.2831+/−0.0102 γ=−0.2761+/−0.0135
90%. Three different types of hygroscopic growth (more-hygroscopic, less-(more-hygroscopic, nearly hydrophobic) could be distinguished at 90% RH , whereas just two groups could be distinguished at 75% RH and one type of hygroscopic growth at 30 and 55% RH .
A key finding is that clean marine air masses could clearly be distinguished from strongly polluted air masses by taking into account only the hygroscopic characteristics that iden-tify the occurrence of different hygroscopicity modes, the hygroscopic growth factors of these modes, and their number fractions. Another finding is that marine air masses that had passed over a continent several days before reaching the ship, showed significant differences in these parameters, compared with clean marine air masses.
In general, relatively high growth factors of more-hygroscopic particle fractions correspond well with the mea-sured chemical inorganic composition. For most time peri-ods, ammonium ions and sulfate ions dominated the molar distribution, signifying that the major inorganic compounds were hygroscopically active material, such as ammonium sulfate, ammonium bisulfate, and sulfuric acid.
The growth factors for the more-hygroscopic particle mode decreased slightly for accumulation mode particles (150 nm and 250 nm particles) during time periods when highly anthropogenically influenced air masses were encoun-tered. However, this decrease was much more significant for growth factors measured at lower RH (30 and 55%), rather than at higher RH (75 and 90%). The hygroscopicity data
obtained at 30, 55, 75 and 90% RH were used to parame-terize the growth factors of more-hygroscopic particles as a function of RH . This parameterization reflects the general relationship that differences in growth factors due to changes in air mass are more pronounced at lower RH (≤55%).
Continentally influenced air masses showed a strong in-crease in aerosol mass, which also corresponded with rather high amounts of carbonaceous material. In general, this oc-currence of carbonaceous material was correlated with the in-crease in light absorption coefficient and with the occurrence of less-hygroscopic and nearly hydrophobic particle fractions in the hygroscopic growth distributions.
Although more-hygroscopic particles with relatively high growth factors were always detected (regardless of air mass), less-hygroscopic particle groups were only detected during those time periods when continentally influenced air masses prevailed. Furthermore, growth factors of this particle group were generally greater for INDOEX (Indian Ocean) than for Aerosols99 (Atlantic Ocean), which can be explained by dif-ferent aging times during transport of the particles. Conti-nentally influenced air masses were encountered more fre-quently during INDOEX than during Aerosols99, resulting in more frequent observations of less-hygroscopic particles.
A nearly hydrophobic particle group appeared with growth factors between 1.16 and 1.36, depending on the particle size. The occurrence of these nearly hydrophobic particles indicates a high anthropogenic influence. Air-mass back tra-jectories showed a transport time between 12 and 36 hours between the continent and the ship for this time period. Fur-thermore, the maximum concentration of elemental carbon during both cruises occurred during this time period.
The number fractions of less-hygroscopic particles ranged from few percent up values higher than 60% depending on dry particle size and air mass type. In general, the high-est number fractions were found for the biomass burning air mass and for the continentally influenced Subcontinent air mass indicating high anthropogenic influence.
Less-hygroscopic particles showed a sharp increase in hy-groscopic growth factor from 75% to 90% RH . One reason for this increase might be the presence of organic material, which supposedly shows different hygroscopic growth than that of inorganic salts (Saxena et al., 1995).
Acknowledgements. We are grateful for the support and coopera-tion of the NOAA PMEL group, who gave us the opportunity to participate in these two field studies. We also thank the participants of the cruise from the University of Washington and PMEL for the brilliant teamwork during and after the cruise.
This work was supported by the “Bundesministerium f¨ur Bil-dung, Wissenschaft, Forschung und Technik” (BMBF), under the project title “Schließungs- und Charakterisierungs-Experiment am anthropogen beeinflussten Aerosol ¨uber dem Indischen Ozean”, and project-number 01 LA-9830/0.
References
Bates, T. S., Quinn, P. K., Coffman, D. J., Johnson, J. E., Miller, T. L., Covert, D. S., Wiedensohler, A., Leinert, S., Nowak, A., and Neus¨uß, C.: Regional physical and chemical properties of the marine boundary layer aerosol across the Atlantic during Aerosols99: An overview, J. Geophys. Res., 106, 20 767–20 782, 2001.
Berg, H. O., Swietlicki, E., and Krejci, R.: Hygroscopic growth of aerosol particles in the marine boundary layer over the Pa-cific and Southern Oceans during the First Aerosol Characteriza-tion Experiment (ACE 1), J. Geophys. Res., 103, 16 535–16 545, 1998.
Berner, A., Lurzer, C., Pohl, F., Preining, O., and Wagner, P.: The size distribution of the urban aerosol in Vienna, Sci. Total Envi-ron., 13, 245–261, 1979.
Charlson, R. J., Lovelock, J. E., Andreae, M. O., and Warren, S. G.: Oceanic phytoplankton, atmospheric sulphur, cloud albedo and climate, Nature, 326, 655–661, 1987.
Charlson, R. J., Schwartz, S. E., Hales, J. M., Cess, R. D., Coakley Jr., J. A., Hansen, J. E., and Hofmann, D. J.: Climate forcing by anthropogenic aerosols, Science, 255, 423–430, 1992.
Houghton, J. T., Ding, Y., Griggs, D. J., Noguer, M., van der Linden, P. J., and Xiaosu, D.: IPCC: Climate change 2001: The Scientific Basis, Cambridge University Press, 2001.
Kulmala, M., KoRH onen, P., Vesala, T., Hansson, H. C., Noone, K., and Svenningsson, B.: The effect of hygroscopicity on cloud droplet formation, Tellus, 48B, 347–360, 1996.
Liu, B. Y. H., Pui, D. Y. H., Whitby, K. T., Kittelson, D. B., Kousaka, Y., and McKenzie, R. L.: The aerosol mobility chro-matograph: a new detector for sulfuric acid aerosols, Atmos. En-viron., 12, 99–104, 1978.
McMurry, P. H. and Stolzenburg, M. R.: On the sensitivity of par-ticle size to relative humidity for Los Angeles aerosols, Atmos. Environ., 23, 497–507, 1989.
Neus¨uß, C., Gnauk, T., Plewka, A., Herrmann, H., and Quinn, P. K.: Carbonaceous aerosol over the Indian Ocean: OC/EC fractions and speciations from size-segregated samples taken onboard the R/V Ron Brown, J. Geophys. Res., in press 2002.
Ogren, J. A. and Charlson, R. J.: Implications for models and mea-surements of chemical inhomogeneities among cloud droplets, Tellus, 44B, 489–504, 1992.
Philip, J. S., Liu, D. Y., Noble, C. A., and Prather, K. A.: Size and chemical characterization of individual particles resulting from biomass burning of local Southern California species, Environ. Sci. Technol., 33 (18), 3068–3076, 1999.
Quinn, P. K., Coffman, D. J., Kapustin, V. N., Bates, T. S., and Covert, D. S.: Aerosol optical properties in the marine boundary layer during ACE 1 and the underlying chemical and physical aerosol properties, J. Geophys. Res., 103, 16 547–16 563, 1998. Quinn, P. K., Coffman, D. J., Bates, T. S., Miller, T. L., Johnson,
J. E., Voss, K., Welton, E. J., and Neus¨uß, C.: Dominant aerosol chemical components and their contribution to extinction during the Aerosols99 cruise across the Atlantic, J. Geophys. Res., 106, 20 783–20 810, 2001.
Quinn, P. K., Coffman, D. J., Bates, T. S., Miller, T. L., Johnson, J. E., Welton, E. J., Neus¨uß, C., Miller, M., and Sheridan, P. J.: Aerosol optical properties during INDOEX 1999: Means, Vari-ability, and controlling factors, J. Geophys. Res., in press 2002.
Saxena, P., Hildemann, L. M., McMurry, P. H., and Seinfeld, J. H.: Organics alter hygroscopic behavior of atmospheric particles, J. Geophys. Res., 100 (D9), 18 755–18 770, 1995.
Seinfeld, J. H. and Pandis, S. N.: Atmospheric chemistry and physics: From air pollution to climate change, Wiley & Sons Inc., New York, 508, 1998.
Svenningsson, B., Hansson, H. C., Wiedensohler, A., Ogren, J. A., Noone, K. J., and Hallberg, A.: Hygroscopic growth of aerosol particles in the Po Valley, Tellus, 44B, 556–569, 1992.
Svenningsson, B., Hansson, H. C., Martinsson, B., Wiedensohler, A., Swietlicki, E., Cederfelt, S.-I., Wendisch, M., Bower, K. N., Choularton, T. W., and Colvile, R. N.: Cloud droplet nucleation scavenging in relation to the size and hygroscopic behavior of aerosol particles, Atmos. Environ., 31 (6), 2463–2475, 1997. Swietlicki, E., Zhou, J., Berg, O. H., Martinsson, B. G., Frank, G.,
Cederfelt, S. I., Dusek, U., Berner, A., Birmili, W., Wieden-sohler, A., Yuskiewicz, B., and Bower, K. N.: A closure study of sub-micrometer aerosol particle hygroscopic behavior, Atmos. Research, 50, 205–240, 1999.
Swietlicki, E., Zhou, J., Covert, D. S., et al.: Hygroscopic properties of aerosol particles in the eastern Northern Atlantic during ACE-2, Tellus, 52B, 201–227, 2000.
Tang, I. N. and Munkelwitz, H. R.: Composition and tempera-ture dependence of the deliquescence properties of hygroscopic aerosols, Atmos. Environ., 27A, 467–473, 1993.
Tang, I. N. and Munkelwitz H. R.: Water activities, densities, and refractive indices of aqueous sulfate and sodium nitrate droplets of atmospheric importance, J. Geophys. Res., 99, 18 801–18 808, 1994.
Taylor, J. P. and McHaffie, A.: Measurements of Cloud Susceptibil-ity, J. Atmos. Sci., 51 (10), 1298–1306, 1993.
Twomey, S.: Pollution and planetary albedo, Atmos. Environ., 8, 1251–1256, 1974.
Twomey, S.: Atmospheric aerosols, Elsevier, New York, 279–287, 1977.
Voutilainen, A., Stratmann, F., and Kaipio, J. P.: A non-homogenous regularization method for the estimation of narrow aerosol size distribution, J. Aerosol Sci., 31 (12), 1433–1445, 2000.