HAL Id: insu-00720899
https://hal-insu.archives-ouvertes.fr/insu-00720899
Submitted on 6 Jan 2016
HAL is a multi-disciplinary open access
archive for the deposit and dissemination of
sci-entific research documents, whether they are
pub-lished or not. The documents may come from
teaching and research institutions in France or
abroad, or from public or private research centers.
L’archive ouverte pluridisciplinaire HAL, est
destinée au dépôt et à la diffusion de documents
scientifiques de niveau recherche, publiés ou non,
émanant des établissements d’enseignement et de
recherche français ou étrangers, des laboratoires
publics ou privés.
Building an 18 000-year-long paleo-earthquake record
from detailed deep-sea turbidite characterisation in
Poverty Bay, New Zealand
Hugo Pouderoux, Geoffroy Lamarche, Jean-Noël Proust
To cite this version:
Hugo Pouderoux, Geoffroy Lamarche, Jean-Noël Proust.
Building an 18 000-year-long
paleo-earthquake record from detailed deep-sea turbidite characterisation in Poverty Bay, New Zealand.
Natural Hazards and Earth System Sciences, European Geosciences Union, 2012, 12 (6),
pp.2077-2101. �10.5194/nhess-12-2077-2012�. �insu-00720899�
www.nat-hazards-earth-syst-sci.net/12/2077/2012/ doi:10.5194/nhess-12-2077-2012
© Author(s) 2012. CC Attribution 3.0 License.
and Earth
System Sciences
Building an 18 000-year-long paleo-earthquake record from detailed
deep-sea turbidite characterisation in Poverty Bay, New Zealand
H. Pouderoux1,2, G. Lamarche2, and J.-N. Proust11G´eosciences-Rennes, Universit´e de Rennes 1, UMR6118, Campus de Beaulieu, 35042, Rennes cedex, France
2National Institute of Water and Atmospheric Research (NIWA) Ltd, Private Bag 14-901, Wellington, 6241, New Zealand
Correspondence to: H. Pouderoux (h.pouderoux@yahoo.fr), G. Lamarche (g.lamarche@niwa.co.nz),
J.-N. Proust (jean-noel.proust@univ-rennes1.fr)
Received: 20 October 2011 – Revised: 23 May 2012 – Accepted: 25 May 2012 – Published: 27 June 2012
Abstract. Two ∼20 m-long sedimentary cores collected in
two neighbouring mid-slope basins of the Paritu Turbidite System in Poverty Bay, east of New Zealand, show a high concentration of turbidites (5 to 6 turbidites per meter), in-terlaid with hemipelagites, tephras and a few debrites. Tur-bidites occur as both stacked and single, and exhibit a range of facies from muddy to sandy turbidites. The age of each tur-bidite is estimated using the statistical approach developed in the OxCal software from an exceptionally dense set of tephrochronology and radiocarbon ages (∼1 age per meter). The age, together with the facies and the petrophysical prop-erties of the sediment (density, magnetic susceptibility and P-wave velocity), allows the correlation of turbidites across the continental slope (1400–2300 m water depth). We identify 73 synchronous turbidites, named basin events, across the two cores between 819 ± 191 and 17 729 ± 701 yr BP. Com-positional, foraminiferal and geochemical signatures of the turbidites are used to characterise the source area of the sedi-ment, the origin of the turbidity currents, and their triggering mechanism. Sixty-seven basin events are interpreted as orig-inated from slope failures on the upper continental slope in water depth ranging from 150 to 1200 m. Their earthquake trigger is inferred from the heavily gullied morphology of the source area and the water depth at which slope failures origi-nated. We derive an earthquake mean return time of ∼230 yr, with a 90 % probability range from 10 to 570 yr. The earth-quake chronology indicates cycles of progressive decrease of earthquake return times from ∼400 yr to ∼150 yr at 0– 7 kyr, 8.2–13.5 kyr, 14.7–18 kyr. The two 1.2 kyr-long inter-vals in between (7–8.2 kyr and 13.5–14.7 kyr) correspond to basin-wide reorganisations with anomalous turbidite depo-sition (finer deposits and/or non depodepo-sition) reflecting the
emplacement of two large mass transport deposits much more voluminous than the “classical” earthquake-triggered turbidites. Our results show that the progressive characteri-sation of a turbidite record from a single sedimentary sys-tem can provide a continuous paleo-earthquake history in re-gions of short historical record and incomplete onland paleo-earthquake evidences. The systematic description of each turbidite enables us to infer the triggering mechanism.
1 Introduction
Earthquake records need to include a large number of events so that meaningful statistical analysis can be undertaken and used for seismic hazard assessments. For large earthquakes with return intervals of hundreds to thousands of years, this implies the building of earthquake chronologies going back several thousands of years. While this may be achievable in regions where human occupation extends over a few thou-sands of years, like in the Mediterranean Basin (e.g. Gr`acia et al., 2010) and the Marmara Sea region (e.g. McHugh et al., 2006), this is not the case in Oceania where human set-tlements are more recent. Hence, the need to develop spe-cific methodologies and protocols to investigate past earth-quakes is critical for countries like New Zealand. There, less than 1000 yr of human occupation and limited histor-ical record covering only the last ∼170 yr mean that evi-dence of past large earthquakes along the plate boundary is scarce. Although paleo-earthquakes have been identified, the data are incomplete reflecting the fragmented nature of the terrestrial record upon which the paleoseismic history is based (Berryman, 1993; Cochran et al., 2006; Goff and
2078 H. Pouderoux et al.: Building an 18 000-year-long paleo-earthquake record
Dominey-Howes, 2009; Hayward et al., 2006; Wilson et al., 2006, 2007).
Submarine paleoseismology is a developing field of sci-ence that aims to characterise offshore earthquake sources and develop protocols and methodology to build earthquake histories from marine environments (Pantosti et al., 2011). This includes identifying and justifying the use of new paleo-earthquake proxies. Amongst those, gravity flow de-posits and turbidites have been successfully used as paleo-earthquake indicators in a number of environments includ-ing the Cascadia margin (Adams, 1990; Goldfinclud-inger et al., 2003, 2007), the northern San Andreas Fault (Goldfinger et al., 2008), the northern Ecuador Margin (Ratzov et al., 2010), the southwestern Iberian Margin (Gr`acia et al., 2010), Haiti (McHugh et al., 2011) and Japan (Huh et al., 2004; Nakajima and Kinai, 2000; Noda et al., 2008). Turbidite paleoseismol-ogy is a method essentially based on the identification of syn-chronous turbidity currents from different sedimentary sys-tems and the correlation with historical earthquakes. Many issues remain in using turbidites as paleo-earthquake proxy, in particular the need to identify the triggering mechanisms of the turbidites and extract the paleo-earthquake record from areas lacking significant historical records.
The Hikurangi Margin in New Zealand is an ideal location for turbidite paleoseismology studies. This is particularly valid in the Poverty Bay region (Fig. 1), where very high sed-iment delivery (∼15 Mt a−1; Hicks and Shankar, 2003; Hicks et al., 2004), high deposition on the continental shelf and slope (∼1 cm a−1; Foster and Carter, 1997; Miller and Kuehl, 2010; Rose and Kuehl, 2010), a very large number of tur-bidites (3.7–6.7 turtur-bidites kyr−1; Lewis and Pettinga, 2004;
Pouderoux et al., 2012), presence of well-dated tephras to underpin chronologies (Lowe et al., 2008) and intense earth-quake activity (∼4 Mw≥5 earthquakes per year since 1940;
geonet.co.nz; Doser and Webb, 2003; Reyners and McGinty, 1999; Webb and Anderson, 1998) provide the right environ-ment to apply and further develop such studies. Furthermore, onshore studies in the Hawke Bay–Poverty Bay region have provided a paleo-earthquake record to compare with over the last 9 ka based on uplifted marine terraces (Wilson et al., 2006; 2007), subsidence episodes (Cochran et al., 2006; Hay-ward et al., 2006), and tsunamis coastal deposits (Cochran et al., 2006; Goff and Dominey-Howes, 2009).
This study aims to show that the turbidite record from a turbidite system fed by a single source region can be used as a paleo-earthquake proxy over a 18 ka period, in order to define the age, frequency, source and impact of large and repetitive earthquakes. The objectives are to (1) provide a precise age of each turbidity currents that have flowed in the Paritu Tur-bidite System, demonstrated by the correlation of turTur-bidites over the system, (2) define the source area and the origin of the turbidity currents, (3) establish the earthquake trigger of these slope failures, and (4) propose a chronology of earth-quakes over an 18 ka period.
2 The northern Hikurangi Margin
2.1 Regional settings
The Hikurangi Margin is a region of intense tectonic and seismic activity associated with the oblique subduction of the Pacific Plate beneath the eastern North Island (Fig. 1). The margin divides in southern and northern segments at
∼39◦300S, in Hawke Bay. Along the northern segment, a 20–30 km-wide continental shelf, a steep sediment-starved inner trench wall, and the two large Poverty (Pedley et al., 2010) and Ruatoria (Collot et al., 1996; Collot et al., 2001; Lewis et al., 2004) morphological re-entrants together indi-cate large-scale tectonic erosion, but in presence of continu-ing high sediment accumulation.
The Poverty re-entrant covers an area of ∼1500 km2 of rough morphology characterised by gullies, ridges, troughs, channels and hummocks (Fig. 2a). The entrant is the re-sult of successive continental slope failures since ∼1500 ka (Pedley et al., 2010). It divides in two distinct morphological and sedimentary systems: the Poverty Canyon System to the south and the Paritu Turbidite System to the north (Orpin, 2004; Fig. 1). The present study focuses on the latter, which has characteristic morphological features(Fig. 2a): a heav-ily gullied upper slope at 150–1200 m water depth; the mid-slope east-west Paritu Trough at 1200–1500 m water depth; the margin-parallel North and South Paritu Ridges, which are separated by a NW–SE-trending Paritu Channel, that leads downslope into a NE–SW trending Lower Paritu Basin at 2300 m water depth (Orpin, 2004; Pedley et al., 2010). The Paritu Trough covers approximately 250 km2. Its hummocky seafloor corresponds to the Poverty Debris Avalanche (PDA; Fig. 2a; Orpin, 2004; Mountjoy and Micallef, 2012; Pedley et al., 2010). The PDA is composed of two mass transport deposits (U1 and U2), emplaced from massive slope failures of the upper slope that remobilised about 33 ± 5 km3of ma-terial. The emplacement of the PDA is older than 3410 yr BP (Orpin, 2004), and could be as old as 13.6 kyr (Pouderoux et al., 2012).
At present, intense onland erosion results in the Waipaoa River delivering up to 15 Mt of sediment per year onto the continental shelf and slope (Fig. 1; Hicks and Shankar, 2003). The drastic environmental changes due to human colonisation beginning about 500–700 years ago and after European settlement 170 yr ago (McGlone et al., 1994; Mc-Glone and Wilmshurst, 1999) increased by ∼660 % the sed-iment delivery (Gomez et al., 2004, 2007; Kettner et al., 2007). Presently, the Waipaoa River may generate hyper-pycnal flows once every 40 yr (Hicks et al., 2004), whose deposits are rarely preserved in the sedimentary record of the shelf (Rose and Kuehl, 2010). Catastrophic climatic events such as the 1988 Cyclone Bola and subsequent flood, recorded on the inner shelf, differentiate from the hemipelagic background by their finer grain size and strong terrestrial carbon signatures (Brackley et al., 2010; Foster
179°0'0"E 178°30'0"E 178°0'0"E 177°30'0"E 38°30'0"S 39°0'0"S 39°30'0"S 0 5 10 20 km WAIPAOA RIVER CATCHMENT 15 Mt 500 1000 1500 120 2000 2500 3000 HIKURANGI TR OUGH MD06-3003 MD06-3002 Paritu Turbidite System CONTINENT AL SHELF Poverty Canyon System F igur e 2 35S 40S 180 3000 1000 2000 3000 6000 175E PAC AUS CVR Hik T K T 5cm/yr HB R P GISBORNE A B C 1 8 3 10 2 4 15 9 14 5 13 7 6 12 11 Mahia Peninsula
Figure 1
Fig. 1. Seafloor morphology of the Poverty Bay region, northern Hikurangi margin, with contours in meters below sea level. Yellow stars
show the epicenters of the 1947 Poverty earthquakes (Mw=6.9 and 7.1) (Doser and Webb, 2003; Downes et al., 2000). Coastal
paleo-earthquakes evidences are shown with white squares: (A) uplifted terraces at Pakarae River mouth (Wilson et al., 2006, 2007), (B) uplifted terraces at Mahia Peninsula (Berryman, 1993) and (C) subsided swamps in northern Hawke Bay (Cochran et al., 2006). The seismogenic segments of Stirling et al. (2012) are indicated with bold black lines with numbers referring to Table 1. White dashed ellipses are isoseismal MMIs VIII from Litchfield et al. (2009) for five active faults including the two interface segments. Bold teeth line is Pac-Aus subduction plate boundary. Red dots are location of the two Marion Dufresne cores used in this study. Location of Fig. 2a is indicated. Insert: the Pacific-Australia (PAC-AUS) subduction plate boundary (teeth line) along the Hikurangi – Kermadec margin that runs along the Hikurangi Trough (Hik T) and Kermadec Trench (KT); the rectangle indicates the location of the Poverty region; the arrow indicates the relative Pac-Aus plate motion from Beavan et al. (2002); CVR: Central Volcanic Region, HB: Hawke Bay, P: Poverty re-entrant, R: Ruatoria re-entrant; EC: East Cape.
and Carter, 1997). Pre-human time floods and earthquakes have been suggested in a 2400-yr record generated using shelf and lake sediments (Gomez et al., 2007).
The rhyolitic Central Volcanic Region (Fig. 1), 350 km west of the subduction margin, is a prolific source of well-dated, geochemically distinct tephras that punctuate the stratigraphic record throughout the Quaternary (Lowe et al., 2008).
2.2 Seismicity
Historical and pre-historical seismic records indicate a high recurrence of moderate earthquakes (Mw>6.5) along the
Hikurangi Margin (Anderson and Webb, 1994; Doser and Webb, 2003; Webb and Anderson, 1998). The 1931 MW=
7.8 Napier earthquake is the most damaging historical earth-quake that has affected the study area.
Large prehistoric earthquakes (MW>7) are inferred from
uplifted coastal terraces and subsided swamps younger than 9 ka (Fig. 1; Berryman et al., 1993; Cochran et al., 2006;
2080 H. Pouderoux et al.: Building an 18 000-year-long paleo-earthquake record
Figure 2
178°45'0"E 178°30'0"E 178°15'0"E 38°45'0"S 39°0'0"S 39°15'0"S 10 km 500 1000 1500 2000 100 2500 3000 120 2000 2500 3000 Poverty Debris Avalanche Gullied upper slopeHIKURANGI TR OUGH MD06-3002 Paritu Trough Lower Paritu Basin Paritu Channel CONTINENT AL SHELF North P aritu Ridge South P aritu Ridge A. MD06-3003 1440 1460 1480 1500 1420 W ater depth (m) MD06-3003 High-resolution 3.5 KHz seismic reflection in the Paritu Trough
B.
SE NW
Fig. 2. (A) Bathymetric map of the Paritu mid-slope system. The extent of the Poverty Debris Avalanche in the Paritu Trough is indicated
(Mountjoy and Micallef, 2012). Yellow dashed line represents the 10 m isobath of postglacial sedimentation after Orpin et al. (2006). White dashed line represents the Raukumara-Hikurangi and Hawke Bay-Hikurangi plate interface seismogenic segments; bold lines are active faults labelled in Fig. 1. (B) Example of high-resolution (3.5 KHz) seismic reflection centred on core MD06-3003.
Hayward et al., 2006; Wilson et al., 2006, 2007). The com-posite prehistoric earthquake record results in a mean return time of ∼800 yr. However, this record is likely to be incom-plete since uplift and subsidence episodes are mainly driven by near-shore upper plate fault ruptures (Litchfield et al., 2010). Evidence of paleo-tsunamis for the last 6 kyr is used as earthquake indicators when their deposits are consistent with local fault-generated earthquakes (Goff and Dominey-Howes, 2009). The two 1947 Poverty earthquakes (MW=
6.9–7.1) generated tsunamis along 50–100 km of coastline but with no significant coastal uplift (Doser and Webb, 2003; Downes et al., 2000). Both have been interpreted as possi-bly originating from ruptures of narrow portions of the plate interface (Downes et al., 2000). The paleo-tsunami record
provides a mean return time of 890 yr, but the record is pos-sibly incomplete (Downes et al., 2000).
There are no plate interface ruptures unambiguously identified along the Hikurangi Margin. Great earthquakes (Mw>8) associated with a rupture of the plate interface have
only been inferred from seismologic and geodetic modelling (Reyners, 1998; Reyners and McGinty, 1999; Wallace et al., 2009; Cochran et al., 2006; Stirling et al., 2012). The sub-duction interface model suggests two rupture segments for the northern Hikurangi Margin, the Raukumara segment to the north extending from the Mahia Peninsula to East Cape, and the Hawke Bay segment to the south, both capable of generating earthquake MW>8 (Litchfield et al., 2009;
Table 1. Characterization of the main active faults in the Poverty region.
no. Fault Length SR MW SED RI )
(km) (mm yr−1) (m) yr)
Faults used in this study
1 Ariel Bank 63 6.07 7.4 4.4 720
2 Ariel East 16 1.56 6.6 1.1 720
3 Gable End 48 3.81 7.2 2.9 760
4 Lachlan 3 69 4.5 7.5 4.8 1070
5 Paritu Ridge 39 2 6.9 2.7 1360
6 Hik. Hawke Bay 200 8.8 8.2–8.4 6.3–8.1 1590–2050 7 Hik. Raukumara 200 10.8 8.2–8.4 6.3–8.1 1300–1670
Other regional faults
8 Ariel North 22 0.93 6.8 1.5 1640 9 Paritu West 17 1 6.5 1.2 1180 10 Poverty Bay 12 2.33 6.5 0.8 360 11 Ritchie Ridge 57 1.5 7.1 4 2650 12 Ritchie West 1 90 1 7.5 6.3 6270 13 Ruatoria South 1 72 1.5 7.3 5 3340 14 Tuaheni Ridge 17 1 6.5 1.2 1180 15 Waihi South 24 2 6.6 1 510
Fault parameters are taken from the synthesis of Stirling et al. (2011) SR: Slip rate, MW: maximum estimated moment magnitude, SED: Single
event displacement, RI: Recurrence interval
2.3 Sedimentation patterns
Postglacial sedimentation in the Poverty region is mostly concentrated on the shelf, in distinct depocenters extending parallel to the coast line (Foster and Carter, 1997; Orpin et al., 2006; Gerber et al., 2010; Miller and Kuehl, 2010). The trapping efficiency of the shelf has reduced from ∼ 90 % to ∼ 25 % since human colonisation. Today, a significant amount of river sediments by-passes the shelf to reach the upper con-tinental slope (Alexander et al., 2010; Gerber et al., 2010; Miller and Kuehl, 2010). Most Holocene sediments delivered by the Waipaoa River are trapped in mid-shelf basins (Gerber et al., 2010), or on the outer shelf (Fig. 2a), where postglacial thickness reaches 40 m (Orpin et al., 2006). Cross-shelf sed-iment pathways supplying this outer shelf depocenter were established early in the Holocene (Orpin et al., 2006).
On the continental slope, multibeam imagery identifies de-bris and avalanche deposits at the toe of the upper slope of the Paritu Turbidite System, arguing for a high slope insta-bility (Orpin, 2004). This contrasts with the Late Holocene, during which the Poverty Canon System was largely inactive (Walsh et al., 2007). These activity patterns are confirmed by the morphology of the gullies, which shows mature (mostly inactive) gullies connecting to the Poverty Canyon System and intermediate to immature (mostly active) gullies con-nected to the Paritu Turbidite System (Fig. 2a; Mountjoy and Micallef, 2012).
In mid-slope basins, Mid–Late Holocene accumulation rate is estimated at ∼60 cm kyr−1 (Orpin, 2004). Since
∼18 ka, postglacial sedimentation of the Paritu Trough and Lower Paritu Basin has been composed of airfall tephras, debrites, hemipelagites and turbidites, respectively
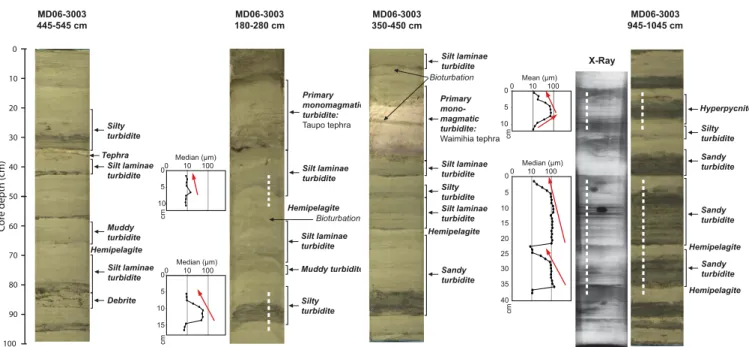
associated with volcanic eruptions, debris flows, marine sed-imentation and turbidity currents (Fig. 3; Orpin, 2004; Poud-eroux et al., 2012). These authors show that (1) tephras consist of cm-thick, normally graded, pinkish silts com-posed exclusively of pumiceous ash. They have sharp basal contacts and are capped by a clayey bioturbated horizon; (2) debrites are cm-thick chaotic units of dark olive-grey silty clays containing sand to pebble size shell fragments. (3) Hemipelagites are cm-thick, light olive-grey silty clays with pervasive bioturbation; (4) turbidites are composed of cm-thick, dark olive-grey to dark grey, normally graded units, with grain size ranging from 100 to 10 µm upward. Basal sands are predominantly composed of quartz and vol-caniclastic grains (pumiceous lapilli and glass shards. Tur-bidites have a sharp basal contact and a progressive and bio-turbated upper boundary with hemipelagites; (5) the char-acterisation and differentiation of hemipelagites from tur-bidite tails are based on variations in composition, high-lighted by colour changes, since grain size is very similar (Fig. 3); hemipelagites mostly contain volcaniclastic grains, usually pumiceous lapilli, whereas turbidite tails are essen-tially made up of quartz grains and the paleontological con-tent (i.e. pelagic and benthic foraminifers) is low (<10 %) and is not a key parameter.
Furthermore, Pouderoux et al. (2012) show that turbidites make up ∼75 % of the infilling with the remainder usually consisting of interbedded hemipelagites. In the Paritu Tur-bidite System, they are sub-divided into five distinct facies based on their grain size, internal structures, sand composi-tion and foraminifer assemblage: muddy turbidites, silt lam-inae turbidites, silty turbidites, sandy turbidites and basal reverse-graded turbidites. The latter facies differs from the
2082 H. Pouderoux et al.: Building an 18 000-year-long paleo-earthquake record
Figur
e 3
Cor e depth (cm) 50 60 70 80 90 100 0 10 20 30 40 0 !"#$%&'()*+10 100 0 5 10 ,* 15 0 !"#$%&'()*+10 100 0 5 10 ,* MD06-3003 180-280 cm Silty turbidite Muddy turbidite Silt laminae turbidite Hemipelagite Silt laminae turbidite Bioturbation Primary monomagmatic turbidite: Taupo tephra MD06-3003 350-450 cm Silt laminae turbidite Primary mono-magmatic turbidite: -%$*$.$%'/"0.1% Silt laminae turbidite Bioturbation Sandy turbidite Silt laminae turbidite Silty turbidite Hemipelagite 0 !"%&'()*+10 100 0 5 10 ,* 0 !"#$%&'()*+10 100 0 5 10 ,* 15 20 25 30 35 40 X-Ray MD06-3003 945-1045 cm Hemipelagite Sandy turbidite Sandy turbidite Sandy turbidite Hemipelagite Hyperpycnite Silty turbidite MD06-3003 445-545 cm Silty turbidite Silt laminae turbidite Tephra Debrite Silt laminae turbidite Muddy turbidite HemipelagiteFig. 3. Main lithofacies identified in cores from high resolution photos, grain size analysis and X-ray: hemipelagite, tephra, turbidite and
debris flow (from Pouderoux et al., 2012). Grain-size data are presented for some turbidites (either the median or the mean values). Samples are taken at <1 cm intervals; position of samples is indicated by dashed lines on photos.
former four as its basal reverse-graded unit is underlying the normal graded sequence. Monomagmatic turbidites are identified as silty to sandy turbidites made up of >90 % of volcanoclastic grains from a single volcanic eruption. Al-though their coarse basal grain-size differs markedly from the tephra lithofacies, their emplacement directly after the volcanic eruption makes them datable as a pure tephra.
3 Data and methods
3.1 Cores analyses
The present study is based on two giant piston cores (MD06-3002 and MD06-3003) collected in the Paritu Turbidite Sys-tem using the R/V Marion-Dufresne capability (Proust et al., 2006, 2008). The cores targeted the deep-sea sedimentation deposited since the Last Glacial Maximum (LGM) (Fig. 2a; Table 2). MD06-3003 was collected in the Paritu Trough in water depth of ∼1400 m, at the front of the PDA, and MD06-3002 was collected in the Lower Paritu Basin in water depth of ∼2300 m. High-resolution 3.5 kHz seismic reflection data and EM300 multibeam bathymetry allowed assessment of the sampling sites in terms of homogeneity and presence of sub-seafloor reflectors indicative of turbidites and tephras (Fig. 2b).
Sedimentological analysis, undertaken on the two cores, included detailed visual description, X-ray radiographs of split cores, grain-size analyses of selected intervals and com-positional characterization of the sediments (Pouderoux et al., 2012). Geotek Multi-Sensor Track (MST) geophysical
analysis on split cores provided continuous gamma density, magnetic susceptibility and P-wave velocity measurements as well as high definition pictures.
Total organic carbon (TOC), C/N ratios and δ13C mea-surements were undertaken on 64 silty clay samples taken in MD06-3003 from well- identified hemipelagites and tur-bidite tails using the colour proxy defined by Pouderoux et al. (2012) in the Ruatoria re-entrant, 100 km NE of the study site. Measurements of ∼1 g bulk samples were used to (1) as-certain the differentiation between hemipelagite and turbidite tails in the Poverty re-entrant, and (2) estimate the origin of the sediment involved in turbidites. All samples were specif-ically prepared and analysed for %TOC, %N to calculated C/N ratios, and δ13C. Sediments were acidified with an ex-cess volume of 10 % hydrochloric acid, rinsed with deionised water, and dried at 60◦. Ground sediments were weighed, and carbon and nitrogen stable isotope analyses carried out on a NA 1500N elemental analyser (Fisons Instruments, Rodano, Italy) linked to a DeltaPluscontinuous flow isotope ratio mass spectrometer (Thermo-Fisher Scientific, Bremen, Germany). Percent OC and %N values were calculated relative to a solid laboratory reference standard of DL-Leucine (DL-2-Amino-4-methylpentanoic acid, C6H13NO2, Lot 127H1084, Sigma, Australia) for each run. Internal standards were routinely checked against that of the National Institute of Standards and Technology (NIST) to maintain accuracy. Repeat analy-sis of NIST standards produced data accurate to within 0.3 ‰ for δ13C and a precision better than 0.2 ‰ for N and 0.3 ‰ for C. For %N and C content, data are accurate to within
Table 2. MD06 piston cores localisation and sedimentological characteristics.
Core Longitude Latitude Water Core Composition*
depth (m) length (m)
deg. min. deg. min. T H
MD 06-3002 39 7.83 178 40.31 2305 12 75 % 25 %
MD 06-3003 39 2.79 178 32.17 1398 12.88 77 % 23 %
*: average proportion of turbidites (T) and hemipelagites (H)
0.4 %, with a precision usually better than 0.3 % for N and 0.2 % for C.
3.2 Age models
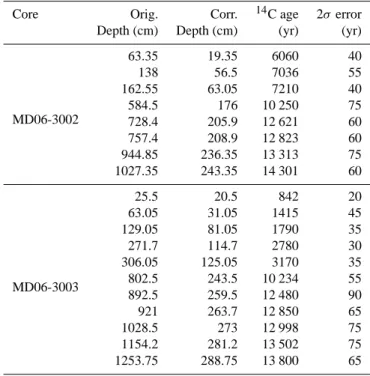
Robust age models are required to determine the age and re-turn time of the turbidites identified in the cores. Turbidites cannot be dated directly as they consist of remobilised mate-rial emplaced instantaneously. The background hemipelagite deposited beneath and above a turbidite layer usually pro-vides datable material. The large number of turbidites in both cores (5 to 6 turbidites per meter; Pouderoux et al., 2012) prevented us from developing a systematic down-core age record. Time constraints are provided by 28 absolute ages (1 age m−1 in average) determined by Pouderoux et al. (2012) from tephra identification and AMS14C radiocar-bon (Tables 3 and 4). The youngest date obtained in MD06-3002 is 606014C years at 0.63 m (Table 4). No major distur-bances were identified downcore, and MD06-3002 contains a continuous sedimentary record up to 14 30114C yr at 10.3 m. MD06-3003 covers a complete chronology from 84214C yr at 0.25 m to 13 80014C yr at its base. Sediments younger than 84214C yr were either not recovered or unusable.
The age of each turbidite is estimated using the statis-tical approach developed in the OxCal software (v. 4.1; Bronk Ramsey, 2008). OxCal interpolates the sedimenta-tion rate along the cores, ascertains the age of each time marker (tephra or14C ages) and calculates the age of sedi-ment at a given depth. The depth corresponds to the cumu-lated depth of hemipelagite (or corrected depth), which is deposited continuously and calculated by removing all tur-bidites and tephra layers from the total core length. We as-sumed there was negligible erosion at the base of the tur-bidites, as these are fine-grained, they have a reduced thick-ness (usually <10 cm) and sedimentation has been relatively homogeneous since 18 ka (Pouderoux et al., 2012). Hence, we believe the hemipelagite-cumulated depth for each core represents the entire sedimentation time without major hia-tus. OxCal is usually utilised to reduce the age uncertainties provided by14C ages systematically taken below turbidites (Goldfinger et al., 2003, 2007, 2008; Gr`acia et al., 2010) and is adapted in this study to date individual turbidites.
The age model is built following the procedure developed by Gr`acia et al. (2010) from the OxCal P Sequence
deposition model, a Bayesian function that assimilates sed-imentation as a random process following a Poisson law (Bronk Ramsey, 2008). The resulting age model increases uncertainties with distance from the time constraints. The pa-rameters required to generate the P Sequence model are the uncalibrated14C ages and respective 1R, or the calibrated tephra ages, with their corresponding corrected depth. The model boundaries are provided by the top and base of the core. The program extrapolates the age of these boundaries with the constraint that the top of the core cannot be younger than 0 yr. The regularity of the sedimentation is determined by the k parameter: the higher the k parameter, the more lin-ear the deposition along core and the smaller the turbidite age uncertainties. The k parameter is generally lower than 2. The model then refines the age of each sample following the reg-ularity of the sedimentation. The hemipelagite sedimentation is assumed constant and homogeneous for the time period considered in the region (Carter et al., 2008; Pouderoux et al., 2012), so that we were able to set the highest possible values of k that provided a modelled age of each time marker within 1σ of the calibrated age. The model finally calculates the age of each corrected depth corresponding to a turbidite and generates the 68.2 % and 95.4 % probability age ranges (1σ and 2σ ). In the following sections, ages are reported with 2σ uncertainties.
3.3 Core correlations
The correlation of turbidites between the two cores is a fundamental step as it provides essential criteria for dis-cussing their origin, implementation and triggering mecha-nisms. Correlation is primarily based on the timing and ages, hence the absolute necessity to generate a robust age model. Because of the large number of turbidites in the cores, cor-relations were rarely unequivocal. To refine corcor-relations, we used the peak-to-peak correlation of geophysical properties, the relative thickness from the nearest time markers, usually tephra layers, and the turbidite facies. Peak-to-peak correla-tion suggests that correlative turbidites are similar in com-position and share the same source area (Goldfinger et al., 2007, 2008) and is therefore an excellent tool for correlating turbidites from one core to the other.
2084 H. Pouderoux et al.: Building an 18 000-year-long paleo-earthquake record
Table 3. Radiocarbon ages retrieved from cores MD06-3002 and MD06-3003 (Pouderoux et al., 2012).
Core Orig. Corr. 14C age 2σ error
Depth (cm) Depth (cm) (yr) (yr)
MD06-3002 63.35 19.35 6060 40 138 56.5 7036 55 162.55 63.05 7210 40 584.5 176 10 250 75 728.4 205.9 12 621 60 757.4 208.9 12 823 60 944.85 236.35 13 313 75 1027.35 243.35 14 301 60 MD06-3003 25.5 20.5 842 20 63.05 31.05 1415 45 129.05 81.05 1790 35 271.7 114.7 2780 30 306.05 125.05 3170 35 802.5 243.5 10 234 55 892.5 259.5 12 480 90 921 263.7 12 850 65 1028.5 273 12 998 75 1154.2 281.2 13 502 75 1253.75 288.75 13 800 65
Table 4. Tephras identification in cores MD06-3002 and MD06-3003 (Pouderoux et al., 2012) with the corresponding eruption name and
age (after Lowe et al., 2008).
Core Orig. Corr. Tephra Calibrated age
depth (cm) depth (cm) identification (yr BP ± 2σ )
MD06-3002 255 92.5 Mamaku 8005 ± 45 430 131 Rotoma 9505 ± 25 499 158.5 Opepe 10 075 ± 155 782 212.5 Waiohau 13 635 ± 165 MD06-3003 205 97 Taupo 1717 ± 13 481 164.5 Whakatane 5530 ± 60 606 208.5 Mamaku 8005 ± 45 710 236 Rotoma 9505 ± 25 736 241.5 Opepe 10 075 ± 155 3.4 Terminology
In the sedimentary record of the Paritu Turbidite System, we distinguish stacked turbidites from isolated turbidites. Stacked turbidites consist of two or more successive tur-bidites with no intervening hemipelagites. They represent successive turbidity currents emplaced “instantaneously” at geological time scale since erosion is considered negligible. Isolated turbidites are systematically under- and over-lain by hemipelagites. Because tephras usually settle within days to months after a volcanic eruption (e.g. Wiesner et al., 1995), they are used as proxy for time between successive turbidites. Both stacked and isolated turbidites represent a single depo-sitional event, called a turbidite event (Tx), as the presence
of intervening hemipelagite or tephra is the only guarantor that time has elapsed between two successive turbidites.
The correlation of turbidite events between the two cores enables us to characterise their deposition as basin events, isolated events, or undetermined events. Basin events are synchronous turbidite events recorded in both cores. They are labelled Px, x being the event sequential number in the basin from younger (P1) to older. A basin event is recog-nized by synchronous turbidites in both cores. As a result, the age of a basin event is given by the common age range from both cores. This methodology helps to refine the age and re-duce the 2σ range. Isolated events are depositional events observed in only one core. Undetermined events are those
that cannot be correlated due to a lack of recovered material in the neighbouring core.
4 Results
4.1 Sediment characteristics
Cores MD06-3002 and MD06-3003 contain the four main lithofacies recognised by Pouderoux et al. (2012):
– Tephras: four and five tephras are respectively recorded
in MD06-3002 and MD06-3003 (Table 4). The Ma-maku, Rotoma and Opepe tephras were identified in both cores. Tephras have generally high density (>1.8 g cm−2), MS (>40 SI), and P-wave velocity
(>1300 m s−1) with sharp variations at the base and top
boundaries. We assume that pure tephras originate from ash-fall coincident with New Zealand Central Volcanic Region volcanic eruptions (Wiesner et al., 1995; Carter et al., 1995).
– Debrites: only two debrites are identified in
MD06-3003 at 5.30 m and 12.85 m. The debrite-turbidite cou-plet pattern observed at 5.30 m may be due either to the deposition of two distinct gravity flows or to the depo-sition of a single gravity flow showing hybrid behaviour (Haughton et al., 2009). The latter option is preferred since similar stacked deposits are recognised for slope failure-induced gravity flows (e.g. Schnellmann et al., 2002).
– Hemipelagites are characterised by low density
(∼1.8 g cm−2), P-wave ∼1300 m s−1 in MD06-3003 and 1400 m s−1 in MD06-3002, and MS ∼10 SI in MD06-3003 and ∼60 SI in MD06-3002.
– Turbidites: there are 100 turbidites organised into
72 turbidite events (T1 to T72, Table 5) in MD06-3002, and 101 turbidites in MD06-3003, organised in 68 turbidite events (T1 to T68). Turbidite thicknesses are
<15 cm and <24 cm in MD06-3002 and MD06-3003, respectively. Turbidites have high density ranging from 1.8 to 2.2 g cm−2, high magnetic susceptibility rang-ing 10–100 SI in 3003 and 60–120 SI in MD06-3002, and P-wave velocity ranging 1300–1500 m s−1 in MD06-3003 and 1400–1600 m s−1 in MD06-3002. All turbidites in this study are interpreted as deposited by low to medium density turbidity currents as defined by Stow and Shanmugam (1980) and Bouma (1962). Only six turbidites recognised as basal reverse-graded turbidites were interpreted as hyperpycnites in MD06-3003 (i.e. flood-induced turbidites deposited by a hy-perpycnal flow, following the definition of Mulder et al., 2003).
4.2 Age model
The age vs. depth plot from the ten calibrated dates obtained from MD06-3002 (Pouderoux et al., 2012) shows a non-linear downcore trend, so we use a low k parameter (k = 0.4) in the OxCal deposition model, which implies high age un-certainties between time markers (Fig. 4a). The 2σ age range of each turbidite event is then relatively high ranging from 25 to 757 yr. In MD06-3003, the strong disturbance in the upper 1.50 m (corrected depth) resulted in two downcore trends in the age model (Fig. 4b and c) and very high age uncertain-ties when using one single k parameter (k = 0.1). The 1.50 m mark is highlighted by a ∼20 cm-thick primary monomag-matic turbidite, which presumably stopped the downcore propagation of the deformation. The stratigraphic position of this layer between the 3170 14C years above and the Whakatane tephra (5530 ± 60 yr BP) below suggests that it is related to the Waimihia volcanic eruption (3410 ± 40 yr BP, Lowe et al., 2008). Since no other large eruptions are known in the Poverty region at that time (Gerber et al., 2010; Orpin, 2004; Wilson, 1993), we use this age in the model. To bet-ter constrain the age of each turbidite event in the core, we used two P sequence models on either side of the “Waimihia turbidite”, with k = 0.2 in the upper part and k = 2.6 in the lower part. This results in two mean corrected sedimentation rates of ∼10 cm kyr−1 and ∼40 cm kyr−1 below and above Waimihia, respectively. Although the sedimentation rate in the upper part of the core is exaggerated because of sedi-ment stretching (Fig. 4c), the turbidite event ages generated by the OxCal model are acceptable since it is constrained by five14C ages and two tephras over 150 cm. The use of the two age model provides good 2σ age range of the turbidite events, which varies from 28 to 439 yr.
The age model provides a precise age for each turbidite event (Table 5). The 72 turbidite events recognised in MD06-3002 are dated between 6144 ± 386 and 17 729 ± 701 yr BP. There were 38 turbidites deposited during the Holocene (0–11.6 kyr), among which 4 during the Late Holocene at 6144 ± 386, 6397 ± 227, 6600 ± 224, and 6903 ± 277 yr BP. The remaining 30 occurred during the Late Pleistocene be-tween 11 623 ± 436 and 17 729 ± 701 yr BP. The 68 tur-bidite events from MD06-3003 are dated from 819 ± 191 to 16 621 ± 439 yr BP. Forty-four were deposited during the Holocene, among which 27 during the Late Holocene. The remaining 28 occurred during the Late Pleistocene between 11 659 ± 348 and 16 621 ± 439 yr BP.
4.3 Core correlations
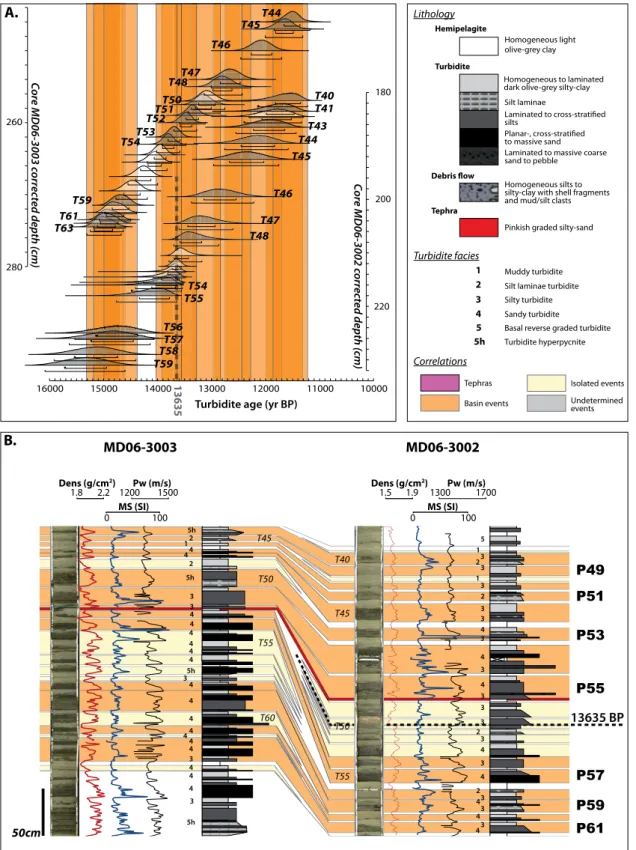
Excellent peak-to-peak correlations of geophysical proper-ties generate a robust correlation of turbidite events, de-spite the complex overlap of their 2σ age ranges (Fig. 5a and b). In particular, geophysical properties provide a means to correlate turbidite events composed of stacked turbidites. For instance, the peaks in the density and the magnetic
2086 H. Pouderoux et al.: Building an 18 000-year-long paleo-earthquake record
Table 5. Summary of turbidite event correlation, showing the name, mean age and the 2σ error bar (yr BP) of each basin event, with their
corresponding turbidite events. The two intervals Int1 and Int2 are reported. Basin events are characterized by their origin: slope failures (sf), volcanic eruptions (v) or floods (f). Isolated events in each core each are in italics.
Paritu Turbidite System
Basin Event Turbidite event in MD06-3003 Turbidite event in MD06-3002 Name Age (yr BP) Origin Name Age (yr BP) Name Age (yr BP)
Mean 2σ Mean 2σ Mean 2σ
P1 819 191 sf T1 819 191 P2 1388 132 sf T2 1388 132 P3 1699 38 sf T3 1699 38 P4 1699 38 sf T4 1699 38 P5 2204 371 sf T5 2204 371 P6 2249 362 sf T6 2249 362 P7 2426 270 sf T7 2426 270 P8 2723 266 sf T8 2723 266 P9 2880 212 sf T9 2880 212 P10 3003 194 sf T10 3003 194 P11 3060 206 sf T11 3060 206 P12 3290 148 sf T12 3290 148 P13 3438 30 v T13 3438 30 P14 3438 30 sf T14 3438 30 P15 3755 238 sf T15 3755 238 P16 3902 282 sf T16 3902 282 P17 4357 342 sf T17 4357 342 P18 5409 137 sf T18 5409 137 P19 5535 77 sf T19 5535 77 P20 5594 101 sf T20 5594 101 P21 5623 112 sf T21 5623 112 P22 5737 143 sf T22 5737 143 5964 185 sf T23 5964 185 P23 6021 193 sf T24 6021 193 T1 6144 386 P24 6489 135 sf T25 6586 232 T2 6397 227 P25 6644 179 sf T26 6699 234 T3 6600 224 P26 6836 210 sf T27 6812 233 T4 6903 277 P27 7039 228 sf T28 7039 228 T5 7067 273 Int1 7309 217 sf T6 7309 217 7395 180 sf T7 7395 180 P28 7480 116 sf T29 7546 182 T8 7440 156 7563 112 sf T9 7563 112 7603 108 f T10 7603 108 7647 103 sf T11 7647 103 7680 110 sf T12 7680 110 7830 119 sf T13 7830 119 7862 114 sf T14 7862 114 7881 110 sf T15 7881 110 8015 44 v, f ? T16 8015 44 P29 8228 129 sf T30 8228 129 T17 8185 192 8336 103 sf T18 8222 216 P30 8390 157 sf T31 8390 157 T19 8363 287 P31 8445 165 sf T32 8445 165 T20 8396 302 P32 8471 167 sf T33 8471 167 T21 8441 313 P33 8604 263 sf T34 8689 178 T22 8624 354 8698 357 sf T23 8698 357 P34 9067 161 sf T35 9067 161 T24 8991 338 P35 9338 111 sf T36 9338 111 T25 9314 199 P36 9447 68 sf T37 9447 68 T26 9387 142 P37 9505 25 sf T38 9508 28 T27 9504 25 P38 9706 143 sf T39 9698 151 T28 9743 180
Table 5. Continued.
Paritu Turbidite System
Basin Event Turbidite event in MD06-3003 Turbidite event in MD06-3002 Name Age (yr BP) Origin Name Age (yr BP) Name Age (yr BP)
Mean 2σ Mean 2σ Mean 2σ
P39 9868 122 sf T40 9813 178 T29 9941 195 10 020 185 sf T30 10 020 185 P40 10 155 129 sf T41 10169 143 T31 10 140 144 P41 10 155 129 sf T42 10169 143 T32 10 140 144 P42 10 169 143 sf T42 10169 143 T33 10 308 285 P43 10 401 297 sf T43 10452 348 T34 10 377 322 P44 10 501 299 sf T43 10452 348 T35 10 613 411 P45 10 579 220 sf T43 10452 348 T36 10 787 428 P46 10 606 193 sf T43 10452 348 T37 10 842 429 P47 11 207 362 sf T43 10452 348 T38 11 207 362 11 515 328 sf T39 11 623 436 P48 11 532 310 f T44 11 511 332 T40 11 685 463 P49 11 659 348 sf T45 11 659 348 T41 11 802 505 11 868 534 sf T42 11 868 534 P50 12 081 378 sf T46 12081 378 T43 11 992 557 P51 12 518 242 sf T47 12641 365 T44 12 170 590 P52 12 698 264 sf T48 12785 351 T45 12 357 604 13 063 309 sf T49 13 065 311 P53 13 106 265 f T50 13 138 297 T46 12 795 576 P54 13 357 238 sf T51 13 357 238 T47 13 101 497 P55 13 490 213 sf T52 13 490 213 T48 13 284 420 Int2 13 637 152 sf T49 13484 306 13 648 163 sf T50 13 648 163 13 701 216 sf T51 13 781 296 13 714 203 sf T52 13 885 374 13 729 189 sf T53 13 974 434 P56 13 736 181 sf T53 13699 219 T54 14 020 465 P57 13 831 187 sf T54 13806 213 T55 14 204 560 13 967 225 sf T55 13 967 225 14 071 245 sf T56 14 071 245 14 275 275 f T57 14 275 275 14 480 290 sf T58 14 480 290 P58 14 685 295 sf T59 14 685 295 T56 14 796 733 P59 14 685 295 sf 14 685 295 T57 14 883 750 14 789 290 sf T60 14 789 290 P60 14 890 295 sf T61 14 890 295 T58 15 157 757 14 940 306 sf T62 14 940 306 P61 14 993 317 sf T63 14 993 317 T59 15 342 741 15 500 366 sf T64 15 500 366 P62 15 549 369 sf T65 15 549 369 T60 15 706 643 P63 15 849 388 sf T66 15 849 388 T61 15 964 675 P64 1 5948 393 sf T67 15 948 393 T61 15 964 675 P65 16 140 398 sf T68 16 140 398 T61 15 964 675 P66 16 292 295 sf T69 16 189 398 T62 16 541 544 P67 16 451 319 sf T70 16 373 398 T63 16 622 490 16 451 319 sf T71 16 424 390 P68 16 621 439 sf T72 16621 439 T63 16 622 490 P69 16 961 214 sf T64 16 961 214 P70 17 171 363 sf T65 17 171 363 P71 17 455 523 sf T66 17 455 523 P72 17 523 549 sf T67 17 523 549 P73 17 729 701 sf T68 17 729 701
2088 H. Pouderoux et al.: Building an 18 000-year-long paleo-earthquake record
Figur
e 4
Waiohau Opepe Rotoma Mamaku 0 2000 4000 6000 8000 10000 12000 14000 16000 18000 0 50 100 150 200 250 300Calibrated age (cal yr BP)
Cor re ct ed d ep th (c m ) MD06-3002 (k=0.4) T15 T10 T5 T1 T35 T55T50 T68 250 T60 T45 T40 T30 T25 T20 T5
Sequence boundary age Calibrated age !"#$%&%'()*+),-()#,.-( Turbidite number Tephra sample 14C sample Opepe Rotoma Mamaku Whakatane Waimihia Taupo 0 2000 4000 6000 8000 10000 12000 14000 16000 18000 0 50 100 150 200 250 300
Calibrated age (cal yr BP)
Cor re ct ed d ep th (c m ) MD06-3003 A. k=2.6 k=0.2 T10 T5 T1 T65 T72 T60T55 T50T45 T40T35 T30 T25 T20 T15 20cm Waimihia D is tu rb ed p ar t U nd is tu rb ed p ar t T12 T9 T10 T11 T15 T16 H H H H H H C. B. T13 T14
Fig. 4. OxCal age models generated using the OxCal 4.1 software (Bronk Ramsey, 2008) for cores MD06-3002 (A) and MD06-3003 (B). Tx
is sequential turbidite number in core. Insert (C) shows the highly stretched sediments above the Waimihia tephra, which justified using two P sequence in OxCal.
susceptibility (Fig. 5b) show that turbidite event T59 in MD06-3003, which is composed of two successive tur-bidites, is correlated with turbidite events T56 and T57 in MD06-3002, each composed of isolated turbidites (Fig. 5c). That some turbidite events may be misinterpreted confirms the importance of cores correlations and helps in the recog-nition of 14 basin events made up of the correlation of one stacked turbidite with many isolated turbidites (Table 5).
The two cores overlap from 6 to 16.6 ka, during which 39 and 42 turbidite events are recorded in MD06-3003 and MD06-3002, respectively (Figs. 2a and 5c; Table 5). Over that period, three tephra layers provide absolute time lines and unequivocal correlation ties. We recognised 46 basin events during that time period. Isolated events are identified in both cores: 20 in MD06-3002 and 10 in MD06-3003.
Two short intervals, Int1 (7–8.2 kyr) and Int2 (13.5– 14.7 kyr), concentrate two-thirds of the isolated events (Fig. 5c, Table 5), and show contrasting sedimentological characteristics from the rest of the cores. Int1 is characterised by one basin event (P28), and 10 isolated events in MD06-3002 and none in MD06-3003. In MD06-MD06-3002, eight of the
isolated events (T9–T16) are concentrated at the base of Int1, below P28, whereas MD06-3003 only record hemipelagite (Table 5). Int2 is characterised by two basin events (P56 and P57) and 9 isolated events: four in MD06-3003 (T52–T55) just below basin event P57, during which MD06-3002 only records hemipelagites, and five in MD06-3002 (T47–T52) above basin event P56 with no corresponding hemipelagite in MD06-3003. The Waiohau tephra (13 635 ± 165 yr BP) identified in MD06-3002 is interbedded in the five isolated events, but is absent in MD06-3003 suggesting erosion in that core. Both intervals (Int1 and Int2) correspond to short time periods (1.2 ka). Because the aim of the study is to define the earthquake trigger of turbidites and generate a paleoseismic record, we removed these two intervals of anomalous sedi-mentation from the turbidite record.
Forty-three basin events are identified between 6 and 16.6 ka, excluding Int1 and Int2, representing an average re-turn time of 215 yr. There are a further 27 undetermined events, distributed as 22 events younger than 6 ka at the top of MD06-3003 and five events older than 16.6 ka at the base of MD06-3002. These undetermined events have an
Figure 5
B. T40 T63 T64 0 MS (SI)100 1300Pw (m/s)1700 1.5 1.9 Dens (g/cm2) 0 MS (SI)100 1200Pw (m/s)1500 2.2 1.8 Dens (g/cm2) T45 T40 T50 T55 T45 T50 T55 T60 13635 BP P51 P57 P59 P53 P49 P55 50cm MD06-3003 MD06-3002 5h 4 4 4 3 3 2 1 2 5h 5h 4 4 4 4 4 4 4 4 4 44 4 3 3 3 4 4 4 5h 5 3 2 2 1 1 3 3 3 3 3 4 3 4 4 4 4 3 3 3 3 2 3 3 3 3 4 4 4 2 P61 T48 T47 T46 T45 T44T43 T41 T40 T59T58 T57 T56 T55T54 T63T61 T59 14000 15000 16000 T47 T46 T45T44 T54T53 T51T50 T48 T52 10000 11000 12000 13000 260 280 0000 500 5 220 200 180 Cor e M D 06 -3 00 2 c or re cte d d ep th (c m )Turbidite age (yr BP) 8887 576 566 888 13635 Cor e M D 06 -3 00 3 c or re cte d d ep th (c m ) A. Silt laminae Laminated to cross-stratified silts Planar-, cross-stratified to massive sand Homogeneous light olive-grey clay Homogeneous to laminated dark olive-grey silty-clay
Pinkish graded silty-sand Laminated to massive coarse sand to pebble
Homogeneous silts to silty-clay with shell fragments and mud/silt clasts
Hemipelagite Turbidite Debris flow Tephra Lithology Turbidite facies Muddy turbidite Silt laminae turbidite Silty turbidite Sandy turbidite
Basal reverse graded turbidite
1 2 3 4 5 Turbidite hyperpycnite 5h Correlations Basin events Tephras Undetermined events Isolated events
Fig. 5. (A) Example of correlation based on turbidite age only. Each turbidite (T x) is represented by its age distribution. Correlated turbidites
in grey; isolated turbidites in white. (B) example of correlation between both cores showing the high definition photo, geophysical MultiSen-sor Track (MST) data (Dens: density, MS: Magnetic Susceptibility, Pw: P-wave velocity) and synthetic log. T x: sequential turbidite number in core. Numbers 1 to 5 at the left of the stratigraphic column are turbidite facies. Correlated turbidites (P x) are highlighted in orange. Isolated events in light yellow.
2090 H. Pouderoux et al.: Building an 18 000-year-long paleo-earthquake record
Figure 5 (continued)
2 2 2 3 3 2 1 3 3 3 3 5h 5 2 2 2 3 4 4 3 3 2 2 2 2 2 5 1 Df 2 2 1 1 1 1 1 3 3 3 3 33 4 3 3 1 3 3 3 3 3 4 4 4 1 5h 4 4 4 3 3 2 1 2 5h 5h 4 4 4 4 4 4 4 4 4 4 4 4 3 3 3 4 4 4 4 3 3 5h 4 4 4 4 4 3 Df 5530 BP 1717 BP 8005 BP 9505 BP 10075 BP 13635 BP 10075 BP 9505 BP 8005 BP 0 1 5 10 13m 2 2 1 2 3 2 1 1 1 3 1 1 1 5h 3 3 4 3 3 3 2 2 2 4 1 5 2 3 1 1 1 3 3 4 4 3 3 3 21 2 3 3 3 3 3 5 3 2 2 21 133 3 3 3 4 3 4 4 4 4 3 3 3 3 2 3 3 3 3 3 3 4 4 4 4 4 4 2 4 4 4 4 1 1 3 3 3 3 C. 33 3 4 MD06-3003 MD06-3002 I2 I2 I1 I1 P1 P5 P10 P15 P20 P25 P30 P35 P40 P45 P50 P55 P60 P65 P70 P25 P30 P35 P40 P45 P50 P55 P60 P65 Zoom Figure 7 3410 BPFig. 5. (C) Turbidite correlation between cores MD06-3002 and MD06-3003, showing the high proportion of basin events and the two short
average return time of 235 and 190 yr, respectively. This is very similar to the 215 yr average return time of basin events, which suggests that the 27 undetermined events can be used as proxy for basin events. Therefore, we use a to-tal of 70 basin events recognized between 819 ± 191 and 17,729 ± 701 yr BP. To calculate the mean return, we exclude events occurring during Int1 and Int2, i.e. we use events P1-P27, P29-P55 and P58-P73 (Table 5), which results in a mean return time of 220 yr. Between P1 and P27, 27 basin events occurred over a 6220-yr period. Likewise, between P29 and P55 and between P58 and P73, 27 and 16 basin events occurred over 5262 and 3044-yr periods, respectively. The 220-yr mean return time is calculated from the 67 intervals (26 + 26 + 15) over a 14 526-yr period (6220 + 5262 + 3044). Mean return times presented in this paper are calculated fol-lowing this method.
4.4 Geochemical analysis
Organic carbon analyses were performed on 12 hemipelagite and 38 turbidite samples, collected in MD06-3003 (Fig. 6a), from 0.46 to 11.5 m, over a 14.7 kyr time period from 0.8 to 15.5 ka. The analyses were performed to ascertain the differ-entiation between hemipelagites and turbidites, to spatially constraint the origin of turbidity currents and to confirm their triggering by earthquake. For that purpose, turbidite samples were taken within basin events, excluding Int1, Int2 and tur-bidite events related to floods or volcanic eruptions. The sam-ples were sorted into three time periods corresponding to sea level fluctuations and climate oscillations: the Late Holocene from 0 to 7 ka (P1 to P27), the Early Holocene from 7 to 11.6 ka (P29–P47), and the Late Pleistocene from 11.6 to 15.5 ka (P48–P62) (Fig. 6).
The upper 5.5 m of core MD06-3003 covers the time span from the Late Holocene period of stable climate and sea-level highstand, similar to present-day climato-eustatic con-ditions. Measured δ13C values range from −22.2 to −23.5, and C/N values from 7 to 9 (Fig. 6b). Hemipelagites have higher δ13C and lower C/N values than turbidites. At each period, hemipelagites and turbidites separate clearly (Fig. 6b and d), which justifies using the colour proxy to characterise hemipelagites. From the Late Pleistocene (11–15.5 kyr) to the Late Holocene (0–7 kyr), hemipelagites and turbidites geochemical signatures show a global trend of increasing
δ13C and decreasing C/N (Fig. 6b and d), probably related to the marine transgression.
We compared our results to present-day organic carbon values of hemipelagites sediments (bulk values) provided by the land-sea transect of Brackley et al. (2010). These values are used as a reference for the signature of terrestrial sed-iments (soil from the floodplain, sample 1 in Fig. 6a), the continental shelf (samples 2 and 3), the gullied upper slope (samples 4 and 5) and the Paritu Trough (sample 6) close to MD06-3003. The C/N vs. δ13C plot of these samples shows a general increase of δ13C (from −27 to −21.5) and decrease
of C/N (from 12 to 9; Fig. 6b) in a seaward direction. These values can be compared with our Late Holocene samples, since the climate and sea level remained roughly constant over the last 7 kyr. Late Holocene sediments share similar
δ13C values with the present-day measurements of the Paritu Trough and the gullied upper slope (Fig. 6b). In particular, Late Holocene and present-day hemipelagites from the Par-itu Trough are very similar, and turbidites and the gullied upper slope have corresponding values. C/N values from the Late Holocene are clearly lower than the present-day mea-surements. This may be due to the drastic environmental changes associated with forest clearance from 500–700 yr BP onwards (H. Neil, personal communication, 2011; McGlone et al., 1994; McGlone and Wilmshurst, 1999). In particular, European colonisation, which began 170 yr ago, caused ma-jor increase in sediment discharge to the continental shelf and slope (e.g. Gomez et al., 2007; Gerber et al., 2010; Miller and Kuehl, 2010), which modify the geochemical signature of the sediment.
5 Discussion
Here, we show that the turbiditic record is a compelling paleo-earthquake proxy, which provides the means required to derive the age, frequency, source and impact on the slope stability of large and repetitive earthquakes over an 18-kyr period. In the next three sections, we establish the link be-tween turbidites and earthquakes using a rationale based on the progressive characterisation of the turbidites, different from the confluence and synchronicity approach of Goldfin-ger et al. (2003, 2007, 2008): (1) define the likely trigGoldfin-ger- trigger-ing mechanisms of turbidites by identifytrigger-ing the source area and the slope failure origin; (2) connect the slope failure trig-ger with earthquakes so that turbidites can be used as paleo-earthquake proxy; and (3) compare the paleo-earthquake frequen-cies deduced from turbidites with those calculated from em-pirical fault–earthquake relationships to determine a poten-tial list of earthquake sources. In the final section, we discuss the influence of repetitive earthquakes on the occurrence of large debris avalanches in the Paritu Trough.
5.1 Slope failure origin of basin events
Some known triggering mechanisms of turbidity currents in-clude slope failures (e.g. Piper et al., 1999), coastal sedi-ment resuspension (e.g. Piper and Normak, 2009; Wright and Friedrichs, 2006), dense shelf water cascades (e.g. Canals et al., 2006), vertical density currents (e.g. Manville and Wil-son, 2004) and large floods (e.g. Mulder et al., 2003). That the Paritu channel acts as a sediment pathway between the Paritu Trough and the Lower Paritu (Fig. 2a) is corrobo-rated by the correlation of >90 % of turbidite events be-tween the two cores. This indicates that any turbidite event originated from the same turbidity current rather than from
2092 H. Pouderoux et al.: Building an 18 000-year-long paleo-earthquake record
Figur
e 6
120m 500m 1000m MD06-3003 W aipaoa River CONTINENT AL SHELF 20 0 10 km 1 2 3 4 5 6 PB PT LPB HT Source area 7 7.5 8 8.5 9 9.5 10 10.5 11 11.5 12 -27 -26.5 -26 -25.5 -25 -24.5 -24 -23.5 -23 -22.5 -22 -21.5 -21 C/N !13CLate Holocene (0 - 7 kyr; P1 - P27)
4 (113 m) 1 !"##$%&'()* 2 (36 m) 3 (56 m) 5 (1198 m) 6 (1428 m) +',(-./0,#.12 3.&&(4$/ .%%4,/5&#%4 6#)7)4)-'&/524&8
Slope failures turbidites Hemipelagite 7 7.5 8 8.5 9 -27 -26.5 -26 -25.5 -25 -24.5 -24 -23.5 -23 -22.5 -22 -21.5 -21 C/N !13C
Late Pleistocene (11.6 - 15.5 kyr; P48 - P62, 49:&.$()1/;<) Slope failures turbidites Hemipelagite
A
7 7.5 8 8.5 9 C/NEarly Holocene (7 - 11.6 kyr; P29 - P47)
Slope failures turbidites Hemipelagite
D
B
Soil Hemipelagite Turbidite 0 -5 -10 -15 -20 -25 -30 1 2 3 5 6 7 8 9 10 11 4 mbsl kyr BP NZ Eustasy ='-4/>#&#:4)4/!+?@+<A* ;? B4'/&4C4&/2(125-')$C
Fig. 5. (A) Bathymetry of the Poverty re-entrant showing the location of core MD06-3003 (red circle) and surface sediment samples from
Brackley et al. (2010) (yellow stars). PB: Poverty Bay, PT: Paritu Trough, LPB: Lower Paritu Basin, HT: Hikurangi Trough. (B) Plot showing
δ13C vs. C/N values from Brackley et al. (2010) samples (circles) and from MD06-3003 Late Holocene samples. MD06-3003 samples are organised into hemipelagite (red squares) and slope failure turbidites (black diamonds) representing basin events. The black and dashed-red circles circumscribe the two types of samples and are reported in (D) for reference. δ13C values are depth-dependant and allow an artificially division of the plot into geographic domains: floodplain, shelf, gullied upper slope and Paritu Trough. (C) Holocene eustatic curve for New Zealand from Gibb (1986) and Cochran et al. (2006). Int1 is shown in pink. (D) δ13C vs. C/N plots for Early Holocene and Late Pleistocene MD06-3003 samples. Transparent circles correspond to samples for earlier time periods (see B). Note the decreasing trend of δ13C and slight increase of C/N with time.
geographically distinct synchronous gravity flows. The three basin events from Int1 and Int2 are excluded from the record as they are not considered as representative of the overall sed-imentary regime. Consequently, all 70 basin events identified between 819 ± 191 and 17 729 ± 701 yr BP represent a dis-tinct record of 70 turbidity currents, each originated from, or at least transiting through, the gullied upper slope (i.e.
<1200 m; Fig. 2a). Amongst them, three events exhibit char-acteristic sedimentological features and correspond to the sedimentary record of catastrophic floods (typical basal re-verse grading sequence of hyperpycnites in P48 and P53) and volcanic eruptions (distinctive sand composition dominated by volcaniclastic material in P13) (Table 5; Pouderoux et al., 2012). These two mechanisms represent only 4 % of the
record. The triggering mechanism of the remaining events is therefore attributed to slope failures, coastal sediment resus-pension, or dense shelf water cascading. Basin events trig-gered by the two latter mechanisms usually exhibit a charac-teristic contribution of shelf material, while slope failures are phenomena occurring on the upper slope and usually contain a signature deeper than the shelf edge (>150 m deep).
The likely origin from the gullied upper slope for the re-maining 67 basin events is confirmed by the followings ob-servations. The freshness of the topography indicates that the gullied upper slope has been active in geologically re-cent times (Mountjoy and Micallef, 2012). Active gullies in the upper slope of the Paritu Turbidite System (Fig. 7c), compared to inactive mature gullies of the Poverty Canyon
Figure 7
0 1.5 3 6 km MD06-3003 MD06-3002 PARITU TROUGH LOWER PARITU BASIN PDA units U-1 U-2 C SOUR CE AREA OF TURBIDITES Mature gullies Immature gullies Intermediate gulliesLiving depth of benthic foraminifers in turbidites
100% 80% 60% 40% 20% 0% MD06-3002 - n=8 MD06-3003 - n=10 < 200m < 600m < 1200m > 150m
Sand composition of turbidites
80% 60% 40% 20% 0% MD06-3002 - n=8 MD06-3003 - n=10 B A VCG LM RF ODG F SF G
Fig. 6. (A) Turbidite content of benthic foraminifers in a selection of turbidites in both cores (n = number of sampled turbidites, ∼10 % of
the total number). Foraminifers have been arranged in four categories following their living depth (Pouderoux et al., 2012). (B) Turbidite sand composition for the same samples as in A. Sand grains are divided in seven categories: VCG: volcaniclastic grains, LM: light minerals, RF: rock fragments, ODG: other detritic grains, F: foraminifers, SF: shell fragments, G: glauconite. (C) Bathymetry of the Paritu Turbidite System showing sediment pathways (black arrows), earthquake source active faults (grey lines), cores (red dots), and the estimated source area for turbidites (gullies from Mountjoy and Micallef, 2012).
system (Orpin et al., 2006; Walsh et al., 2007), suggest that gravity flow activity is concentrated on the Paritu Turbidite System, at least during the Holocene. The δ13C signals from basin events and surface sediments from the gullied upper slope have similar ranges (Fig. 6b), suggesting that basin
events include reworked material from water depth rang-ing from 150 to 1200 m (Fig. 2a). The foraminiferal content (Pouderoux et al., 2012) shows a majority of benthic species from environments deeper than the shelf edge (>150 m; Fig. 2a) and a very low shelf contribution (<10 %; Fig. 7a),
2094 H. Pouderoux et al.: Building an 18 000-year-long paleo-earthquake record
corroborating our interpretation as an upper slope origin for the basin events. Lastly, the sand of basin events is essen-tially composed of volcaniclastic grains and light minerals (mostly quartz) (Fig. 7b). The lack of clear shelf or terres-trial signature of basin events implies a storage time before remobilisation. Such storage may be occurring in the outer-shelf depocenter of the Poverty outer-shelf, which lies upstream the Paritu Turbidite System (Fig. 2a; Orpin et al., 2006; Gerber et al., 2010).
The mechanism most likely to generate turbidity currents able to deposit such basin events is down-slope transfor-mation of slope failures on gullied upper slopes (Middle-ton and Hamp(Middle-ton, 1973; Piper et al., 1999). Since the basin events originate from the gullied upper slope, without clear shelf or terrestrial signal, we infer that the 67 basin events recognized since ∼18 ka in the Paritu Turbidite System are predominantly the result of turbidity currents triggered by slope failures. The sedimentary record consequently pro-vides a precise calendar of the 67 gullied upper-slope fail-ures over the last ∼18 ka, representing an average return time of 230 yr. Amongst them, 26 events occurred during the Late Holocene (0–7 ka), 19 during the Early Holocene (7– 11.6 ka), and 22 during the Late Pleistocene (11.6–18 ka).
5.2 Earthquake control on slope failures
Two of the major mechanisms are recognised to trigger slope failures: earthquakes (Goldfinger et al., 2007; Noda et al., 2008; St-Onge et al., 2004) and storms waves (Mulder et al., 2001; Puig et al., 2004). Tsunami waves have also been suggested, but not clearly identified (Shanmugam, 2006). The wave impact on the seafloor is commonly confined to water depths <120–150 m (Lee and Edwards, 1986; Puig et al., 2004), while earthquakes may trigger slope failures at any water depth. Turbidity currents triggered by storm waves are reported as being smaller and less voluminous than those generated by earthquakes (Gorsline et al., 2000), and of lower magnitude: storm-induced gravity flows usually die out in water depths <500 m and remain confined to canyon heads or gullies (Puig et al., 2004).
Our observations indicate that basin events are mostly generated on the gullied upper slope, (Figs. 6b and 7), and are deposited at water depth >1400 m by turbidity currents capable of reaching the 2300-m deep Lower Paritu Basin. Since the shelf edge has been located at ∼150 m since about 7 ka (Fig. 6c; Gibbs, 1986), storm waves cannot be con-sidered as potential triggering mechanism during the Late Holocene highstand (0–7 kyr). However, it is quite likely that storm waves affected the paleo-shelf edge during the Early Holocene and Late Pleistocene, when sea level was lower and wind field stronger (Shulmeister et al., 2004), and added to earthquakes in slope failure generation, increasing the fre-quency of turbidity currents.
Considering the intense seismic activity on the Hikurangi Margin (Anderson and Webb, 1994; Doser and Webb, 2003;
Figure 8
! " # $ % & '()*+,-. / 0 !"#$%&'(&#)$*$%+' ,-.%+/'#+01#* !"2+13+"#%45&"6+'+7$*+80+. $8'!17+#%-'#+9$18' !"#$%&##& '()(*(+,-.+*/01234 /5 6728(0-7 /9 !(4-( '+8-872:( /; <1*34+*8 =(>)+/?(@ /& :;;!3,;<' (=>?@:@(;, A%4$.'.%&*-B CD<,(<E'>;CD>: A2$%%+#"%&#+B !"#$#%#" &"'() !%"*"+",-NO DATA !F !G !H !FG !FH !I !J !FK !FL !FM !K A1234+*8 =(>)+/?(@ /B !II ,N;EO'>;CD>: AP1/+Q'+%'"2RS' IMMGB C1#+' T:HG3IFII C(*D+/E:11F7G(*34H2()+ !IL !IGFig. 7. Correlation (dashed red lines) between the sedimentary
record of the Paritu Turbidite System and coastal paleo-earthquakes evidences since 6 ka. Large floods identified on the shelf (Gomez et al., 2007) are reported to show the non-correlation with Poverty events. Coastal record is made up of uplifted marine terraces on Pakarae River mouth (1 Wilson et al., 2007) and Mahia Penin-sula (2 Berryman et al., 1993 revised by Berryman et al., 2012), sudden subsidence episodes in northern Hawke Bay (3 Cochran et al., 2006), and southern Hawke Bay (4 Hayward et al., 2006), and tsunamis deposits (5 Goff and Dominey, 2009). The names of cor-relative basin events are reported. Note that Poverty events not iden-tified as slope failures deposits are not plotted (e.g. P13).
Webb and Anderson, 1998), earthquake ground-shaking is the most likely triggering mechanism for the 26 basin events identified during the Late Holocene (0–7 kyr; Table 5). This is corroborated by the temporal correlation of basin events with the paleo-earthquake data from lake, coastal and shelf records (Fig. 8; Berryman, 1993; Cochran et al., 2006; Goff and Dominey-Howes, 2009; Gomez et al., 2007; Hayward et al., 2006; Wilson et al., 2006, 2007). Coastal evidence constitutes an incomplete record of large to great earth-quakes (Mw>7.5), which are generated by near-shore fault