HAL Id: hal-02894407
https://hal.archives-ouvertes.fr/hal-02894407
Submitted on 8 Jul 2020
HAL is a multi-disciplinary open access
archive for the deposit and dissemination of
sci-entific research documents, whether they are
pub-lished or not. The documents may come from
teaching and research institutions in France or
abroad, or from public or private research centers.
L’archive ouverte pluridisciplinaire HAL, est
destinée au dépôt et à la diffusion de documents
scientifiques de niveau recherche, publiés ou non,
émanant des établissements d’enseignement et de
recherche français ou étrangers, des laboratoires
publics ou privés.
Distributed under a Creative Commons Attribution| 4.0 International License
wavefront sensing for future segmented space telescopes
Lucie Leboulleux, Jean-François Sauvage, Rémi Soummer, Thierry Fusco,
Laurent Pueyo, Laurent M. Mugnier, Christopher Moriarty, Peter Petrone,
Keira Brooks
To cite this version:
Lucie Leboulleux, Jean-François Sauvage, Rémi Soummer, Thierry Fusco, Laurent Pueyo, et al..
Experimental validation of coronagraphic focal-plane wavefront sensing for future segmented space
telescopes. Astronomy and Astrophysics - A&A, EDP Sciences, 2020, 639, pp.A70.
�10.1051/0004-6361/202037658�. �hal-02894407�
https://doi.org/10.1051/0004-6361/202037658
c
L. Leboulleux et al. 2020
&
Astrophysics
Experimental validation of coronagraphic focal-plane wavefront
sensing for future segmented space telescopes
Lucie Leboulleux
1, Jean-François Sauvage
2,3, Rémi Soummer
4, Thierry Fusco
2,3, Laurent Pueyo
4,
Laurent M. Mugnier
3, Christopher Moriarty
5, Peter Petrone
4, and Keira Brooks
41 LESIA, Observatoire de Paris, Université PSL, CNRS, Université de Paris, Sorbonne Université, 5 place Jules Janssen, 92195
Meudon, France
e-mail: [email protected]
2 Aix Marseille Université, CNRS, LAM (Laboratoire d’Astrophysique de Marseille) UMR 7326, 13388 Marseille, France
3 DOTA, ONERA, Université Paris Saclay, 2322 Châtillon, France
4 Space Telescope Science Institute, 3700 San Martin Drive, Baltimore, MD 21218, USA 5 Center for Astrophysics, Harvard & Smithsonian, Cambridge, USA
Received 4 February 2020/ Accepted 12 May 2020
ABSTRACT
Context.Direct imaging of Earth-like planets from space requires dedicated observatories, combining large segmented apertures with instruments and techniques such as coronagraphs, wavefront sensors, and wavefront control in order to reach the high contrast of 1010
that is required. The complexity of these systems would be increased by the segmentation of the primary mirror, which allows for the larger diameters necessary to image Earth-like planets but also introduces specific patterns in the image due to the pupil shape and segmentation and making high-contrast imaging more challenging. Among these defects, the phasing errors of the primary mirror are a strong limitation to the performance.
Aims.In this paper, we focus on the wavefront sensing of segment phasing errors for a high-contrast system, using the COronagraphic Focal plane wave-Front Estimation for Exoplanet detection (COFFEE) technique.
Methods.We implemented and tested COFFEE on the High-contrast imaging for Complex Aperture Telescopes (HiCAT) testbed, in a configuration without any coronagraph and with a classical Lyot coronagraph, to reconstruct errors applied on a 37 segment mirror. We analysed the quality and limitations of the reconstructions.
Results.We demonstrate that COFFEE is able to estimate correctly the phasing errors of a segmented telescope for piston, tip, and tilt aberrations of typically 100 nm RMS. We also identified the limitations of COFFEE for the reconstruction of low-order wavefront modes, which are highly filtered by the coronagraph. This is illustrated using two focal plane mask sizes on HiCAT. We discuss possible solutions, both in the hardware system and in the COFFEE optimizer, to mitigate these issues.
Key words. instrumentation: high angular resolution – techniques: high angular resolution – planets and satellites: detection
1. Introduction
The direct imaging of Earth-like planets is one very exciting goal for today’s astronomy. On the one hand, it could reveal the existence of life on another planet by studying the atmosphere emission lines. On the other hand, imaging a planet 1010 times
fainter than its star in visible light (Traub et al. 2003) at a dis-tance of a fraction of an arcsecond is a technological challenge. To do so, it requires the development of high-contrast imag-ing tools: starshades (Brown & Soummer 2010;Harness 2016) or coronagraphs (Lyot 1932; Wang & Vaughan 1988; Malbet 1996; Sivaramakrishnan et al. 2001) are used to decrease the starlight while preserving the planet light, as well as wave-front sensors and wavewave-front control loops (Rousset et al. 1999; Fauvarque et al. 2016; Leboulleux et al. 2017; Mazoyer et al. 2018a,b;Paul 2014), are used in the aim of improving the con-trast in a reduced zone of the image, where the planet is located. From space, different solutions have been proposed through the years that present ever-increasing performance. For instance, the James Webb Space Telescope (JWST) instrument NIR-Cam will propose five coronagraph options to the user, includ-ing a Lyot coronagraph aiminclud-ing to achieve a contrast of a
few 10−5 at an inner working angle (IWA) down to 0.40” at
1.82 to 2.12 µm (Krist et al. 2010), the Wide Field Infrared Survey Telescope’s (WFIRST) Coronagraph Instrument (CGI) aims at reaching between 107 and 109 contrast (in most
opti-mistic cases) around 0.1 arcsec from the observed stars (between 0.4 and 1 µm) (Mandell et al. 2017), the Hubble Space Tele-scope (HST) a contrast around 10−3 (Perrin et al. 2018), and
the Large UV/Optical/Infrared (LUVOIR) telescope instrument ECLIPS (Extreme Coronagraph for Living Planetary Systems) is designed for a 10−10 contrast between 3.5 and 64λ/D
(The LUVOIR Team 2019). A combination of these tools can be seen in the WFIRST telescope (Spergel et al. 2013), the Habitable Exoplanet (HabEx; Mennesson et al. 2016) and the LUVOIR (Dalcanton et al. 2015;Pueyo et al. 2017) propositions for the decadal survey.
Among these telescopes, the LUVOIR proposition is the only one aiming for the investigation of Earth-like planets with a segmented primary mirror. The James Webb Space Tele-scope (JWST;Stevenson et al. 2016) and the Extremely Large Telescopes (ELTs) (Macintosh et al. 2006; Kasper et al. 2008; Davies et al. 2010; Quanz et al. 2015) also include segmented primary mirrors. Such segmentation allows larger diameters:
Open Access article,published by EDP Sciences, under the terms of the Creative Commons Attribution License (https://creativecommons.org/licenses/by/4.0),
first for manufacturing reasons, and secondly, for space-based applications, to fold the telescope for launch. With a larger diam-eter comes a better resolution in the science image: indeed, it has been shown that the exoplanet yield increases as a power of the primary mirror diameter, especially when using a coronagraph (Stark et al. 2016). However, it also increases the complexity of these future systems since it generates additional alignment chal-lenges: all the segments need to be well phased to fit the equiva-lent monolithic mirror.
In particular, it has been proven that phasing errors of the primary mirror drastically decrease the performance of a high-contrast imaging instrument (Lightsey et al. 2014; Yaitskova et al. 2003;Leboulleux et al. 2018;Stahl et al. 2015). Such telescopes therefore require a dedicated wavefront sensor, which enables the estimation of low amplitude errors. Hardware and algorithmic solutions have to be experimentally tested and validated on optical simulators of future instruments. To respond to that need, several testbeds are emerging over the world to experimentally test and validate high-contrast imaging concepts. They are now organized in a unique online platform called the Community of Adaptive OpTics and hIgh Contrast testbeds (CAOTIC) to simplify the navigation of the user from one to the other with a fast overview and comparison of the capabili-ties of each testbench. Some of these testbeds include a simula-tion of the segmentasimula-tion to confront the addisimula-tional issues brought by the primary mirror segmentation, such as the Segmented Pupil Experiment for Exoplanet Detection (SPEED) at the Uni-versity of Nice (Martinez et al. 2018), and the High-contrast imager for Complex Aperture Telescopes (HiCAT) testbed at the Space Telescope Science Institute (STScI; N’Diaye et al. 2013a), which can simulate a 37-segment primary mirror tele-scope combined with a coronagraph and two deformable mir-rors for wavefront control. Results have been obtained on HiCAT in the last few years, using a monolithic pupil or a well-phased segmented pupil (Soummer et al. 2018). In particular, wavefront sensing and control techniques have been deployed, such as the speckle nulling technique (Soummer et al. 2018) and a paramet-ric phase retrieval algorithm (Brady et al. 2018).
The COronagraphic Focal plane wave-Front Estimation for Exoplanet detection (COFFEE) sensor (Sauvage et al. 2012; Paul et al. 2013a,b) is capable of estimating the wavefront aber-rations with high resolution. It constitutes an extension of the phase diversity technique to coronagraphic optical trains and it can be applied to a wide range of coronagraph designs, includ-ing the classical Lyot coronagraph, the Roddier & Roddier coro-nagraph, the vortex corocoro-nagraph, the four quadrant phase mask coronagraph, and the apodized pupil Lyot coronagraph (APLC). This technique is highly robust to coronagraph architecture and uses the science image as the wavefront sensor, thereby mak-ing it common-path and requirmak-ing no additional hardware. It has also been validated so far on several testbeds, such as the Très Haute Dynamique (THD2) testbed at the Observatoire de Paris (Herscovici-Schiller et al. 2018a) and the Marseille Imaging Testbed for HIgh Contrast (MITHIC;Herscovici-Schiller et al. 2019), and on the Spectro Polarimetric High contrast Exoplanet REsearch (SPHERE; Beuzit et al. 2019) instrument (Paul et al. 2013b,2014). However, COFFEE has so far only been demon-strated on monolithic pupils.
In this paper, we propose to implement the COFFEE algo-rithm on HiCAT for the particular application of reconstruction of segment phasing errors, that is, local piston, tip, and tilt on the segments. One of the advantages that this test proposes is to directly use the science camera as the wavefront sensor to phase the primary mirror.
The HiCAT testbed, used for this experiment, is described in Sect.2. The conditions of the experiment are then explained in Sect.3, before developing the results without and with the coronagraph, respectively, in Sects.4and5. Finally, in Sect.6, we present our conclusions.
2. HiCAT testbed description
Since 2013, HiCAT has been under development at the Russel B. Makidon Laboratory at STScI to investigate high-contrast technologies for future space missions (N’Diaye et al. 2013a, 2014,2015;Leboulleux et al. 2016,2017;Soummer et al. 2018; Brady et al. 2018).
It is designed to develop, test, and validate solutions for future space telescopes with complex apertures dedicated to high-contrast imaging, such as WFIRST or LUVOIR. To do so, it is aimed at allowing for the implementation of multiple differ-ent telescope configurations. The simulation of telescope pupil’s complexity can include the central obstruction, the spiders, the segment gaps, and the phasing errors. These components can be easily replaced with new components, depending on the config-uration tested.
To perform high-contrast imaging, HiCAT includes a starlight and diffraction suppression system (Lyot coronagraphs or APLC) and wavefront sensing and wavefront control tools (deformable mirrors and phase retrieval camera). Some of these elements can also be easily replaced using external metrology as required.
2.1. Optical and opto-mechanical design
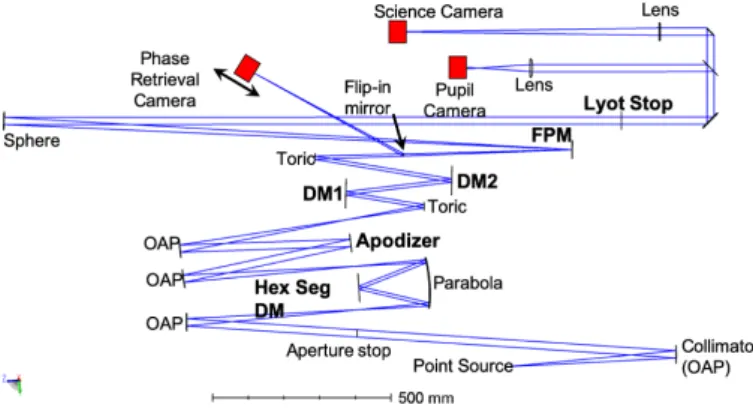
The final layout is presented in Fig. 1: the testbed includes a star simulator, an observing telescope, a coronagraph, a wave-front control stage, and a high-contrast imaging system. The pupil mask, the Iris-AO segmented mirror, the apodizer, the first deformable mirror, and the Lyot stop are located in pupil planes, while the focal plane mask (FPM) and the science cam-era are in focal planes. It is a purely reflective testbed, except for the final lens ahead of the cameras (after the Lyot Stop). It is also designed to minimize the impact of its optical compo-nents on the final image and contrast by reducing the sources of amplitude-induced errors from the propagation of out-of-pupil surfaces (Talbot effects) (N’Diaye et al. 2013a). With this set up, the majority of the amplitude errors comes from the disconti-nuities in the pupil which are corrected using apodization and wavefront control.
The star is simulated using a fiber source collimated with an off-axis parabolic mirror (OAP). The source can be either a monochromatic light (λ= 638 nm) or a broadband supercontin-uum light source that can be combined with either a filter wheel or a monochromator (600–680 nm).
The telescope is simulated using an entrance pupil mask, conjugated with a mirror that can be either monolithic or seg-mented. In the latter case, we use a 37-segment Iris-AO MEMs DM with hexagonal segments that can be individually controlled in piston, tip, and tilt (see Fig.2).
The coronagraph is an APLC, where the apodizer can be replaced by a flat mirror to obtain a classical Lyot coronagraph. The apodizer is easily replaceable and a couple of apodizers have already been tested: a WFIRST-like configuration (monolithic mirror, WFIRST central obstruction and spiders, and apodiza-tion optimized for this pupil) and a LUVOIR-like configuraapodiza-tion (36 hexagonal segments, hexagonal central obstruction, spiders, apodization). The FPM is made of a reflective golden surface
Fig. 1.Optical and mechanical design of the HiCAT testbed. The point source and the collimator simumlate a star located at infinity. The aper-ture stop corresponds to a pupil mask and can be circular, contain spi-ders or be shaped such as segmented telescopes. It is conjugated is the Iris AO, here called Hexagonal Segmented DM and together, they can simulate a segmented primary mirror at its full complexity. The apodizer (pupil plane), the FPM (focal plane), and the Lyot stop form a full APLC, which can easily be downgraded to a classical Lyot coro-ngaraph when the apodizer is replaced with a flat mirror or even be removed if no coronagraph is needed. DM1 (pupil plane) and DM2 (out of pupil plane) are used for wavefront control to correct for wavefront aberrations or apply a diversity phase. At the end of the optical beam, two cameras can be found: a pupil plane camera and the science cam-era, which is also used as the post-coronagraph wavefront sensor when focal plane wavefront sensing techniques are tested. The phase retrieval camera offers an alternative as a pre-coronagraph detector.
Fig. 2.Iris-AO MEMs segmented mirror set up on the HiCAT testbed
and used for the experiment. It is composed of 37 hexagonal segments that can each be controlled in piston, tip, and tilt. The gaps between the segments measure between 10 and 12 µm (Iris-AO spreadsheet) and the full segmented mirror has an inscribed circle diameter of 7 mm (Soummer et al. 2018).
with a circular central hole, two diameters of holes being pos-sible. The Lyot stop is a transmissive circular mask. Both the FPM and the Lyot stop are motorized. The wavefront control can be done with either one or two DMs: DM1 is set in a pupil plane while DM2 is out of pupil plane, to correct for both ampli-tude and phase aberrations. The DMs are Boston Micromachines deformable mirrors (kilo-DM), each of them with 952 actuators in a 9.9 mm (34 actuators) diameter disk. Both DMs are cur-rently installed, but only DM2 is used since the calibration of DM1 needs to be redone. For the validation of COFFEE, we use the science camera (ASI1600mm from ZWO) with 4656 × 3520 pixels, each of them having a size of 3.8 µm.
Apart from DM1 and DM2 best flats, the internal wave-front error of HiCAT, measured with a Fizeau interferometer, is around 13 nm root-mean-square (RMS). After adding and con-trolling the DMs, the wavefront error goes down around 2 nm (Brady et al. 2018;Soummer et al. 2018).
2.2. Environment constraints
For high-contrast imaging, performance is degraded by wave-front perturbations resulting from dust, turbulence, or vibrations. This is why HiCAT is mounted on a floating table, itself on a stage independent from the rest of the building to mitigate vibra-tion effects. A box covers all the testbed to protect it from dust, particles, air flows, and parasitic light. The box is located in a class 1000 clean room (ISO 6) with temperate control better than 1◦C, and humidity that is maintained around 30%.
Addi-tional constraints are introduced by the presence of the DMs, since they need to remain below 30% of humidity without any air flow. Inside the box, temperature and humidity sensors have been installed and a complementary dry air supply reduces the humidity to well below 30%.
2.3. Latest results on HiCAT
HiCAT has the capacity to simulate both monolithic and segmented telescopes, which can be combined with a Lyot coronagraph or even a full APLC. A pair-wise estimation (wave-front sensing) and stroke minimization (wave(wave-front control) com-bined procedure has been implemented and can be run in any given configuration, which provided the first results of corona-graph/wavefront control combination (Soummer et al. 2018). In monochromatic light, with an APLC coronagraph and a seg-mented entrance pupil, contrasts of 4 × 10⁻⁷and 10−7have been
reached respectively for a symmetric dark hole and a half dark hole. With a classical Lyot coronagraph replacing the APLC, a contrast of 5 × 10⁻⁸ has been obtained, still in monochromatic
light (Soummer et al. 2019). For this study, we utilize a seg-mented aperture and a classical Lyot coronagraph.
3. Objective and conditions of the experiment 3.1. Objective of the experiment
Segmentation of the telescope primary mirrors generates var-ious issues, including an increasing complexity of the align-ment process. In addition to the global alignalign-ment of the primary mirror, each segment has at least three degrees of freedom (piston, tip, tilt) that need to be aligned to achieve the target per-formance. Numerous wavefront sensors have been developed to reconstruct the wavefront aberrations and can be applied to seg-ment phasing, such as the Zernike sensor for Extremely Low-level Differential Aberrations (ZELDA;N’Diaye et al. 2013b), the Self-Coherent Camera (SCC) sensor (Baudoz et al. 2006; Mazoyer et al. 2013;Martinez et al. 2016) or the Phase Diversity (Gonsalves 1982;Mugnier et al. 2006), or the ZErnike Unit for Segment phasing (ZEUS;Dohlen et al. 2006). In high-contrast imaging, focal plane sensors are preferable, since they enable the retrieval of all aberrations from the entrance pupil to the sci-ence camera, while pupil plane wavefront sensors’ reconstruc-tions suffer from non-common path aberrareconstruc-tions.
The COFFEE sensor only requires focal plane images, which means the science detector is used as the sensor and no additional device is needed. Another advantage of COFFEE is that it can operate in the presence of a coronagraph, which makes it a strong
candidate for high-contrast imaging instruments. It has already been validated on monolithic apertures on SPHERE (Paul et al. 2013a, 2014), on the MITHIC testbed, and more recently on the THD2 testbed (Herscovici-Schiller et al. 2018b). However, COFFEE has never been validated on bench, nor in simulation, on a segmented aperture. This is the motivation behind the exper-iment introduced in this paper: using COFFEE on segmented apertures to reconstruct phasing errors in the presence of a coro-nagraph.
3.2. Conditions and tools
The optical configuration of the HiCAT testbed for this exper-iment and, in particular, the numerical parameters useful for the model implemented in the COFFEE algorithm, is explained in Sect.3.2.1, and the main software steps of the experiment, from the images taken by the camera to the processed data, are detailed in Sects.3.2.2–3.2.4.
3.2.1. Optical conditions
The chosen source is a monochromatic light with a wavelength of λ= 638 nm. The entrance pupil is a circular mask of diameter 18 mm, and the Lyot stop a circular pupil of diameter 15 mm. Since the pupil masks hides the outer ring of the Iris-AO, the number of fully visible segments reduces from 37 to 19. The system can be used in coronagraphic imaging or in direct imag-ing (defined here as the imagimag-ing without FPM) by movimag-ing the FPM one centimeter away from the optical axis. One centimeter is enough to remove entirely the FPM from the optical path.
The sampling factor is an important parameter for COFFEE. It enables us to quantify the pixel scale, which means the full width at half maximum (FWHM) of the PSF with respect to the number of pixels. To estimate it, we compute the cut-off fre-quency D/λ of the modulation transfer function (MTF) of the system (modulus of the Fourier transform of the PSF without FPM). The dimension of the PSF image (in pixels) divided by the cutoff frequency of the MTF (also in pixels) provides the sampling [λ/D]pixin pixels on the camera:
[λ/D]pix= dim(PSF)f c
. (1)
As a comparison, the sampling is equal to 2 pixels per λ/D for Shannon-Nyquist sampled images. On HiCAT, the sampling on the camera is 13.3 ± 0.1 pixels per λ/D when the Lyot stop is set up, while 11.4 ± 0.1 pixels per λ/D when it is out. The ratio of these two values provides an estimation of the Lyot ratio: 85.6% ± 1.1%, more precise than the value deduced from the ratio between the Lyot stop and entrance pupil diameters.
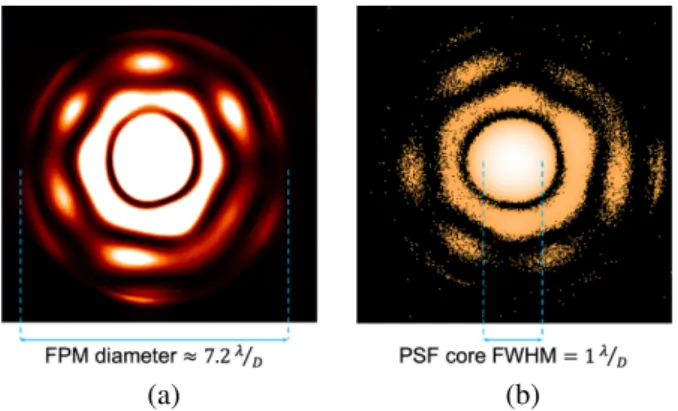
Since COFFEE relies on a fine model of the imaging sys-tem, the FPM size in λ/D has also to be known with preci-sion. On HiCAT, the FPM is a hole in a flat mirror. To compute a precise estimation of its diameter, we install a camera in a focal plane behind it, with the detector conjugated to the FPM. We can then observe a PSF cropped after around two rings by the mask. Two different light exposures are used: by increas-ing the source intensity until saturatincreas-ing the inside of the hole (Fig. 3a), we can deduce a precise estimation in pixels of the hole diameter; and by adjusting the source intensity to obtain a non-saturated PSF (Fig.3b), we can measure its FWHM, which provides an estimation of the resolution element λ/D in pixels. By dividing our precise estimate of the hole diameter in pixels by the FWHM estimate of the resolution element, we obtain a
(a) (b)
Fig. 3.FPM size calibration: images of the PSF at the FPM plane,
cropped by the mask. (a) Saturated image (linear scale) and (b) non-saturated image (logarithmic scale). In this case, the FPM diameter is estimated at 7.2 ± 0.9λ/D.
Fig. 4.Structure of the data analysis process. “coron” stands for “coron-agraphic”, “bd” for “background”, “foc” for “on focus” (the DM is flat), and “div” for “diversity”. The COFFEE reconstruction is done indepen-dently but with the same method in both configurations (direct and coro-nagraphic) for comparisons later on. The segment pistons extracted in both cases will also be compared to the commands sent to the Iris-AO segmented mirror.
diameter of 7.2 ± 0.9λ/D for the FPM: [DFPM]λ/D=[DFPM]pix
[λ/D]pix where [λ/D]pix= [FWHMPSF]pix.
(2) This FPM extent also provides the cutoff frequency in corona-graphic mode for the rest of the experiment, which will be dis-cussed later in this paper.
3.2.2. Image acquisition and pre-processing
COFFEE requires two images: a focus image and a diversity image (Fig.4). In our case, the diversity image is obtained with applying a 300 nm peak-to-valley (PV) focus on the pupil plane DM (the focus was calibrated in front of a Fizeau interferometer with a precision of a few nanometers), while the DM remains flat for the focus image.
Figure4describes the successive pre-processing steps of this experiment. Pre-processing is done to increase the quality of the input images of COFFEE and reduce the noise. Each input image corresponds to the average of 400 images with the average of 400 background images subtracted. The background images are taken when a motorized light trap blocks the beam a few cen-timeters ahead of the FPM. All images have 1424 × 1424 pixels with a sampling of either 11.4 ± 0.1 or 13.3 ± 0.1 pixels per λ/D depending if the Lyot stop is in or out of the optical path (see Sect.3.2.1). These steps are the same in both direct and corona-graphic modes.
All these configurations (different DM phase application, FPM position control, light suppression component control,
camera use, and image pre-processing) require a safe hardware control. On HiCAT, it has been developed in object-oriented Python as a generic package: each hardware is a child class of a generic “instrument” parent class, and each action is a function. Each electronic on the testbed can be controlled remotely and safely, enabling to switch from a mode to another or to put on or off the light trap without any interruption. The entire sequence from hardware control and image acquisition to image pre-processing belongs to this unified and generic software infras-tructure (Moriarty et al. 2018).
3.2.3. Phase diversity with COFFEE
The COFFEE algorithm is an extension of the phase diversity technique to coronagraphic images developed bySauvage et al. (2012) and Paul et al.(2013a). It is a generic code that works for different coronagraphs such as the APLC, the classical Lyot coronagraph, the Roddier & Roddier coronagraph, the four quadrant phase mask, or even no coronagraph. The model of image formation used in COFFEE includes a coronagraph with all its components: apodizer, FPM, and Lyot stop.
Two coronagraphic images, If and Id, are needed. We obtain
Id after applying a known diversity phase φd in the entrance
pupil plane, using the deformable mirror. COFFEE enables us to estimate two unknown phase aberrations: φup corresponds to
the upstream phase aberrations, that is, before the coronagraph (typically in the apodizer plane) and φdoto the downstream
aber-rations, that is, after the coronagraph (typically in the Lyot stop plane). We call E0the amplitude of the electric field. The
coron-agraph function C{E0eiφup, eiφdo}expresses the propagation from each plane to the following one (with a Fourier Transform) and the multiplications by the corresponding masks. We also con-sider residual continuous backgrounds in the images, βf and
βd due to the coronagraph, and the noises (detector and photon
noises) of If and Idrespectively, nf and nd, such as:
If = C{E0e iφup, eiφdo} 2 + nf + βf, (3) Id= C{E0e
iφup+iφd, eiφdo}
2+ n
d+ βd. (4)
The objective of the COFFEE algorithm is to maximize p(E0, βf, βd, φup, φdo|If, Id), the probability that we may observe
the parameters E0, βf, βd, φup, and φdo, knowing the images
If and Id. It is equivalent to minimizing the criterion
JMAP = − ln(p(E0, βf, βd, φup, φdo|If, Id)). This criterion has
been made analytically explicit in Sauvage et al. (2012) and Paul et al.(2013a). Then, it typically calls for a numerical min-imization based on the variable metric with limited memory and bounds (VMLM-B) method (Paul 2014). The minimiza-tion stops when the difference between two successive values of the criterion is below a certain threshold, fixed by the user, and COFFEE provides the best estimates of E0, βf, βd, φup, and
φdoaccording to this minimization.
COFFEE is particularly well suited for our study, since the goal is to measure the wavefront aberrations in a corona-graphic system, with no differential aberration and as small mod-ifications of the system as possible. Secondly, it provides the upstream phase φup, which corresponds, in our experiment, to
the surface of the segmented mirror. Finally, it reconstructs the aberrations on a pixel-wise basis (in opposition for instance with a Zernike-wise basis), which means that the phase function itself
Fig. 5.Post-processing to deduce the piston, tip, and tilt values on the different segments from the phases reconstructed by COFFEE. First, we subtract the reference phase (obtained with COFFEE when the Iris-AO is at its best flat) to obtain the residual piston/tip/tilt to be corrected. The residual phase is multiplied with a hexagonal mask to isolate the segment of interest. We apply a dot product to this segment phase with a hexagonal calibrated Zernike polynomial to compute the aberration amplitude, that can be compared to the command that has been sent to the Iris-AO. The output value, here −127.561 is in nanometers.
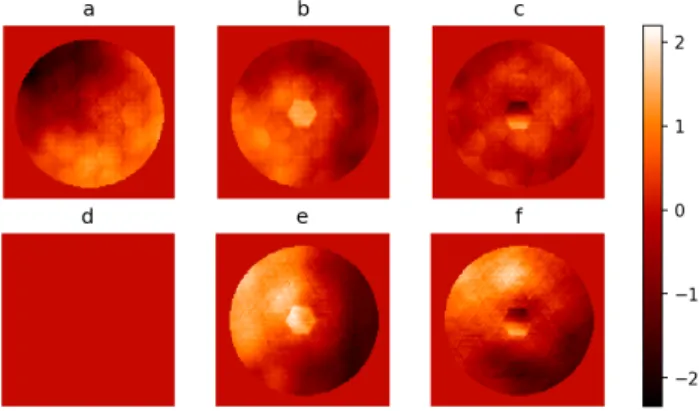
Fig. 6. Phases reconstructed with COFFEE in direct
(non-coronagraphic) configuration, in radians: (a) when the Iris-AO is flattened (this map is also used as our reference phase), (b) when a 188 nm piston is applied on the central segment (open loop), (c) when a 0.2 mrad tip wavefront is applied on the central segment. (d), (e), and (f ) corresponds to respectively (a), (b), and (c) after subtraction of the reference phase (phase estimated by COFFEE when the Iris-AO mirror is flattened, that is, (a)). The aberrations are well reconstructed by COFFEE, both for low order aberrations which are similar in all reconstructions and in high frequency aberrations, which correspond to the borders of the segments.
is estimated. It is therefore a good candidate for segment phas-ing, which requires a high spatial resolution.
3.2.4. Post-processing
To obtain the phasing errors per segment the upstream phase aberration map provided by COFFEE is projected on local segment-level piston, tip, and tilt modes. In our case, we want to verify if the output piston and tip-tilt values correspond to the command sent to the Iris-AO mirror. To do so, we follow the pro-tocol described in Fig.5: from the map deduced by COFFEE, we subtract a reference phase, reconstructed by COFFEE but with the Iris-AO at its best flat. This enables the removal of global aberrations and reconstruction artifacts such as the global tip-tilt, that do not interest us in this experiment. Then a hexagonal mask is put on each segment to isolate it and get the aberration of the segment only. This isolated aberration is projected on tip mode normalized at 1nm RMS with a dot product. To get the piston value, this last step is replaced by computing the average of the phase inside the mask. The output values then correspond to the Zernike coefficients of the segment-level phase.
(a)
(b)
Fig. 7.(a) Linearity of the phase diversity on the estimation of a piston aberration on the central segment (range of piston values from 0 to 200 nm), in the direct case (no coronagraph). (b) Linearity of the phase diversity on the estimation of a tip aberration on the central segment (range of values from 0 to 200 nm pv). In both cases, the theory curves correspond to y= x. In the piston case (a) the curve can be approximated with the linear function y= 0.932(±0.006)×−4.02(±0.97) and in the tip case (b) it can be approximated with the linear function y = 0.857(±0.009)×−0.98(±1.2). These plots show a possible uncertainty in the calibration of Iris-AO.
4. Reconstruction of phasing errors without coronagraph
In this section, we focus on determining the linearity of COFFEE without the FPM. COFFEE is then equivalent to a phase diver-sity algorithm (Gonsalves 1982), that is, when the coronagraph model is a single Fourier Transform. The objective is to set ref-erence results with which we will compare the results obtained in presence of the coronagraph.
4.1. Examples of reconstructed phases
Figure6introduces some phases reconstructed with COFFEE in direct configuration (no coronagraph), when known aberrations are applied on the segmented mirror. On the first column (a), the segmented mirror is flattened, the reconstructed phase corre-sponds to the so-called reference phase. On the second column (b), the Iris-AO is flat except for the central segment on which a 188 nm piston is applied. On the third column (c), the Iris-AO is also flat, except for the central segment that has a 0.1 mrad tip. The first line (1) contains the raw phase maps as computed by COFFEE, while the second line (2) corresponds to the raw phase maps minus the reference phase (1a).
In all cases, the subtraction of the reference phase removes most of the global aberrations and reduces the segmentation pat-tern on flattened areas, that is, the edge effects.
4.2. Linearity of phase diversity to segment aberrations The objective here is to study the error of reconstruction of COFFEE for different kinds of phasing aberrations: piston, tip, and tilt. To study piston aberrations, the Iris-AO remains flat, except for the central segment on which different piston values are applied: from 0 to 200 nm. We estimate with COFFEE the aberration phase for a set of images, and deduce the respective piston value of the central segment. This set of values is com-pared to the command sent to the central segment of the Iris-AO. Figure7a illustrates this study.
Fig. 8.Phases reconstructed with COFFEE in coronagraphic
configura-tion, in radians: (a) when the Iris-AO is flattened (it is also our reference phase), (b) when a 188 nm piston is applied on the central segment, (c) when a 0.2 mrad tip is applied on the central segment. (d), (e), and (f ) corresponds to respectively (a), (b), and (c) after subtraction of the ref-erence phase (phase estimated by COFFEE when the Iris-AO mirror is flattened, that is, (a). Even if high-order seem quite well reconstructed, low-order aberrations in the three cases are not equally reconstructed.
We process similarly for the study of tip aberrations: the Iris-AO is still flat, except for the central segment on which seven tip commands from 0 to 200 nm are successively applied. The results are indicated on Fig.7b.
4.3. Result analysis
For the piston case, the curve looks like the linear function y = 0.932(±0.006) × −4.02(±0.97) (in nanometers). The RMS of the difference between the linear fit and the data from COFFEE is 1.97 nm. For the tip case, the curve looks again lin-ear: y= 0.857(±0.009)×−0.98(±1.2) (in nanometers). The RMS error between all data points and this fit is 1.68 nm.
In these two cases, we notice that even if the estimation is consistent with the command sent to the Iris-AO, the Zernike coefficients estimated by COFFEE and our post-processing
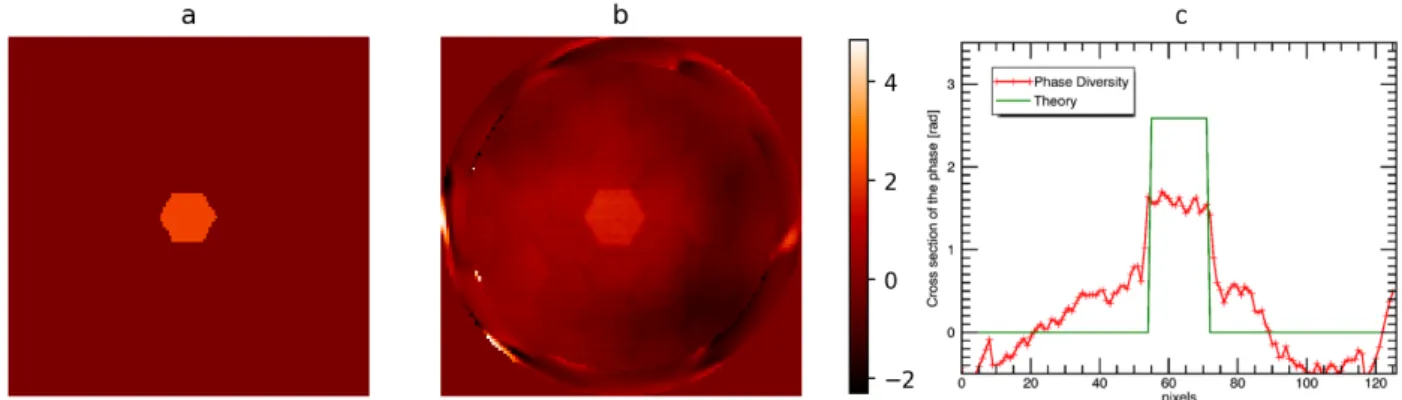
Fig. 9.Comparison between expected phase and estimated phase when the Iris-AO is flat except for the central segment on which a 225 nm piston is applied, in presence of the Lyot coronagraph: (a) theoretical phase map computed from the command sent to the Iris-AO, in radians, (b) phase map reconstructed by COFFEE, in radians, (c) vertical cross-sections of these two phases. Extra low-order aberrations are reconstructed, in addition to a underestimation of the local piston on the central segment.
algorithm are a bit underestimated. We hypothesize that the dif-ference between the COFFEE values and the expected values increasing with the level of the aberration applied on the Iris-AO mirror, could be due to an overestimation of the Iris-Iris-AO calibration coefficients, since they are sent in open loop and the commands are not calibrated using for example an inter-ferometer. Furthermore, the non-null y-intercepts indicate that COFFEE detects in both cases a default slight phasing error on the Iris-AO.
5. Reconstruction of phasing errors with a coronagraph
In this section, we focus on the data taken with a 7.2λ/D-large FPM and a 85.6%±1.1% Lyot stop and estimated with COFFEE. 5.1. Observations
We proceed with the same strategy than in the previous section, except for the coronagraph model used in COFFEE and the FPM centered on the optical path.
Figure9 shows the phases reconstructed with COFFEE in coronagraphic configuration when different phases are applied on the segments: (a) the AO mirror is flattened, (b) the Iris-AO mirror is flattened except for the central segment on which a 188 nm piston is applied, (c) the Iris-AO mirror is flattened except for the central segment in which a 0.2 mrad tip is applied. On the top line (1) are the raw phases, while on the bottom line (2) the phases are subtracted by the reference phase (1a). On these different phases, the hexagonal pattern can be clearly rec-ognized and on the non reference phases, the moving segment can be identified. However, already at this stage, several issues can be addressed: first, low order aberrations, that should not exist, appear and differ strongly from one estimation to the other. Secondly, the reconstruction amplitude is lower than expected, which is illustrated on Fig.9. On this picture, we can notice that the estimated piston on the central segment is around 150 nm instead of 263 nm. These errors of reconstruction are clearly not acceptable and will be studied in the next section.
5.2. Impact of the FPM on the coronagraphic image
The FPM can explain the errors of phase reconstruction pointed before since it can be seen as a high-pass filter. It filters out the light close to the optical axis, which contains the
low-frequency aberrations, such as, in our case, the reference or back-ground phase or even low-frequency components of the segment itself.
To illustrate this phenomenon, we simulate the PSFs (in-focus and out-of-(in-focus) that would be obtained with the HiCAT optical configuration with no aberration except for a sine phase (see Fig.10). The sine phase is chosen at different frequencies: two cycles per pupil, which should be too small to pass the FPM, 3.5 cycles per pupil, that should be very close to the border of the FPM, and 15 cycles per pupil, that should fully pass the FPM. All three sine-phases have an amplitude of 70 nm, and the diversity phase corresponds, like on the HiCAT experiment, to a 300 nm PV focus. The in-focus PSFs are shown on the first line (1) of Fig.10, the corresponding theoretical phases are shown on the second line (2).
These PSFs are used as inputs for COFFEE, which estimates the aberrations. The resulting maps appear at the third line (3) of Fig.10, and the difference between these reconstructed phase maps and the theoretical ones are indicated at line (4). In each case, we also plot the power spectral distributions (PSD) of the theoretical and reconstructed phases, visible on the line (5) of Fig.10. As a reminder, the PSD corresponds to the square of the Fourier Transform of the phase:
PSD(u)= cφup(u) 2, (5) whereφcup is the Fourier Transform of φup. In Fig. 10(line 4), we plot the azimuthal mean values of the PSD. We can observe that in the three cases, the green peak does correspond to the frequency introduced in the phase. However, only the PSD of the reconstructed phase in the case of 15 cycles per pupil has a well-located peak with the right amplitude. In the two other cases, the peaks have an offset or are under estimated.
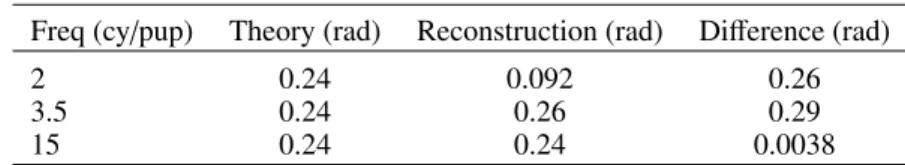
In Table1, we also indicate the RMS values of the different phases (theoretical, COFFEE-reconstructed, and error, for the total aberrations, the low-frequency components, and the high-frequency components).
We can notice that in the high-frequency aberration case (15 cycles per pupil), the phase is well reconstructed, and the RMS of the error is minimal (0.0038 radians RMS). This kind of aber-ration fully passes the FPM, even if low-order patterns around five cycles/pupil can be seen on the PSD. Since the difference visible on Fig.10(4c) not being well visible, it is also shown on Fig. 11at an optimized scale. This reconstruction error is made of numerous spatial frequencies, except for frequencies
(a) (b) (c)
Fig. 10.Comparison between theoretical phases and phases reconstructed by COFFEE for sine-like phases with an amplitude of 70 nm and three
different spatial frequencies: (a) two cycles per pupil, (b) 3.5 cycles per pupil, and (c) 15 cycles per pupil. For each case, we show: (1) the PSF in the detector plane, (2) the theoretical phase map to reconstruct, (3) the phase map reconstructed by COFFEE, cropped by the Lyot stop, (4) the difference, cropped by the Lyot stop, between the theoretical phase map and the phase map reconstructed by COFFEE, and (5) the power spectral distribution (PSD) of the theoretical phase and the phase reconstructed by COFFEE. On these curves, the cutoff frequency of the FPM is indicated in grey, and the frequency of introduced sine phase in green.
lower than the size of the FPM (3.5 cycles per pupil). In par-ticular, Fig.11b shows the components with frequencies lower than seven cycles per pupil. This cutoff frequency has been cho-sen to identify the peak at around five cycles per pupil visible in the PSD of Fig.10(5c). It has been shown in Sect.5that with
a FPM, the COFFEE algorithm reconstructs low-order aberra-tions that should be absent, this phenomenon is also visible on the PSD of Fig.10(5b).
Conversely, the reconstruction is not efficient for low-order aberrations such as the two cycles per pupil case. The
Table 1.RMS wavefront aberrations of the different phases of Fig.10, in radians at λ= 638 nm, computed in the Lyot stop only.
Freq (cy/pup) Theory (rad) Reconstruction (rad) Difference (rad)
2 0.24 0.092 0.26
3.5 0.24 0.26 0.29
15 0.24 0.24 0.0038
Notes.For each frequency (2, 3.5, and 15 cycles per pupil), the RMS values of the theoretical phase, the phase reconstructed by COFFEE, and the reconstruction error (Diff) are given. The frequencies are indicated in cycles per pupil. We notice that the reconstruction error in the case of 15 cycles per pupil indicates that only this aberration is well reconstructed.
Fig. 11.Reconstruction error of Fig.10(4c). The unit are in radians. (a) Same reconstruction error than Fig.10(4c), at an optimized scale. (b) Orders lower than seven cycles per pupil of the reconstruction error (a), obtained with a cut on the PSD and an inverse Fourier Transform. (c) Difference between the phase maps (a) and (b). Patterns of a few cycles per pupil are visible and can be easily identified using a spatial filter. They correspond to the peak at around five cycles per pupil of the PSD of Fig.10(5c). It has been shown in Sect.5that with a coronagraph, the COFFEE algorithm generates extra low-order aberrations.
reconstructed phase is very different than the theoretical one, in terms of phase pattern and RMS value (0.29 radians RMS), most of the error coming from low-frequency aberrations (see Table1).
This test indicates that there exist some modes that are not or badly visible by COFFEE, mainly when they are blocked by the FPM. The FPM limits COFFEE’s ability to sense and con-sequently reconstruct low-order modes with spatial frequencies smaller than the spatial extent of the FPM, that is, smaller than 3.5 cy/pup in our case (as a reminder, the FPM has a diameter of 7.2 ± 0.9λ/D). On the other hand, COFFEE shows its full capa-bility for modes with higher spatial frequencies than the size of the FPM.
5.3. Impact of segment-level aberrations on the phase reconstruction
From the previous study, we can deduce that phase patterns containing low-order variations are not properly reconstructed. Given that segment-level aberrations contain low-frequency components, COFFEE cannot fully reconstruct phasing errors, and can even add low-order background phase aberrations.
To theoretically investigate this effect, we reconstruct a segment-level piston error with COFFEE. To do so, we simu-late in- and out-of-focus PSFs with a segment-level phase error (piston of 1 rad PV on the central segment) in the same config-uration as the HiCAT Iris-AO. These PSFs are used as inputs of COFFEE to reconstruct the phase error. The results are shown in Fig.12.
Figure13also indicates in red the theoretical PSD of a flat phase, except for the central segment. The PSD is higher below 6–7 cy/pup, that is, spatial frequencies that are mostly cut by the FPM. The PSD of the reconstructed phase is also plotted in green on Fig.13and can be compared to the theoretical one. It can be noted that above the FPM cut-off frequency, the reconstructed
frequencies fit the theoretical ones, while at low frequencies, the errors of reconstruction drastically increase.
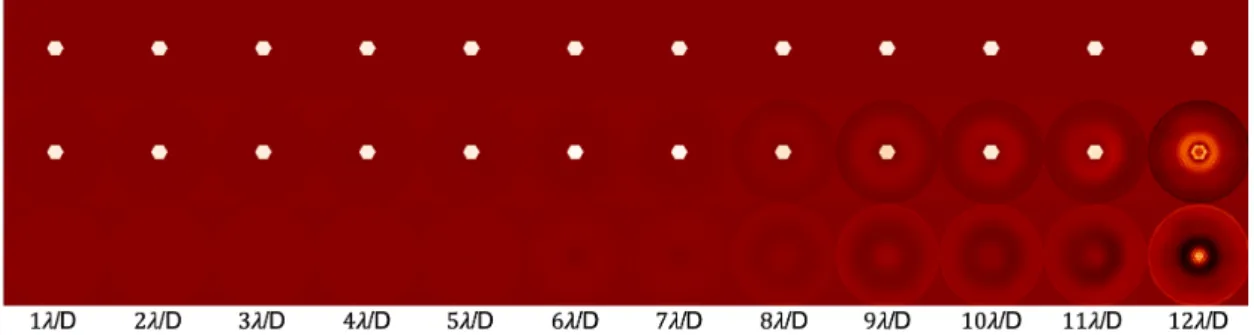
Therefore, COFFEE shows difficulties to efficiently estimate phases containing the frequencies cut by the FPM. We may then wonder how the size of the FPM impacts the reconstruction of low-order aberrations, in particular segment-level aberrations. Figure14presents the theoretical (top), reconstructed (middle), and difference (bottom) phases, for a FPM with a radius from 1 to 12 λ/D (left to right) and a Lyot ratio of 90%. We can notice a clear deterioration of the reconstruction phases when the FPM size increases, particularly above 7λ/D. This can be explained by the fact that in our case we have around seven segments along the pupil diameter. As a consequence, the most information in the focal plane about each segment is contained in a circle of diameter around 7λ/D (FWHM of the Fourier Transform of one segment). Therefore, a FPM smaller than this diameter lets more information pass, while a larger FPM will cut most of the seg-ment information.
We can conclude here that the size of the FPM has a notice-able impact on the reconstruction of segment-level aberrations, and that the reconstruction error of segment-level aberrations on the HiCAT testbed could probably be mitigated with a smaller FPM. Using a smaller FPM is also a scientific objective, since it enables to detect companions such as Earth-like planets closer to the host star.
6. Conclusions
In this article, we carry out an experimental test of COFFEE on the HiCAT testbed to reconstruct segment phasing errors. It has been tested in two different configurations: without and with the coronagraph.
Without a coronagraph, COFFEE becomes equivalent to a traditional phase diversity algorithm. The reconstruction of pis-ton, tip, and tilt aberrations was linear between 0 and 200 nm.
With a coronagraph, COFFEE was able to identify and ana-lyze an intrinsic limitation of focal plane wavefront sensors in presence of a Lyot coronagraph: the FPM behaves like a high-pass filter and blocks low spatial frequencies that are present in segment-level aberrations. Therefore this sensor cannot recon-struct frequencies lower than its cut-off frequency: it cannot fully estimate order aberrations and it may even add absent low-order aberrations.
A first simple solution to this limitation would be to use a smaller coronagraph, but it would also mean enabling more low-order signal to reach the detector. To test this, we conducted a fast experiment on HiCAT with a 4.4λ/D-diameter FPM set up on the testbed. Figure15shows the reconstructed, command, and difference phases when random pistons with an RMS of 92.3 nm are applied on the Iris-AO. However, such a solution seems naive since it enters into contradiction with current optimizations of
Fig. 12.Test of reconstruction of a segment-level phase error with COFFEE in simulation only: (a) theoretical phase to reconstruct: a 1 rad piston is applied on the central segment, (b) phase reconstructed with COFFEE, (c) difference between the two previous phases, (d) cross-sections of the three phases of Fig.12along the vertical axis. We can notice in particular the reconstruction of a low-order aberration that is not present in the theoretical phase.
coronagraph design, which tend to have a large FPM to block as much starlight as possible.
Another approach to mitigate that effect is to modify not the coronagraph size but the density of segments: smaller segments have a different PSD with higher order components. With a tele-scope like the LUVOIR proposition, which has 120 segments (The LUVOIR Team 2019), COFFEE would be more efficient since more segment spatial frequencies would pass the corona-graph.
So far, only hardware solutions have been proposed, but an optimization on the COFFEE parameters could perhaps be implemented. In particular, the regularization of the COF-FEE optimizer could be better better in fitting segment-like aberrations.Herscovici-Schiller et al.(2018a) also encountered unsensed modes when they applied the COFFEE sensor on the THD2 testbed, with a four quadrant phase mask coronagraph. They mitigated this limitation by setting up a optimized reg-ularization inside the algorithm itself. This numerical solution requires more investigation in the case of a Lyot coronagraph, since the low-order modes, cut by the FPM, also specifically cor-respond to the ones we are interested in: they are main spatial components of segment-like aberrations.
Eventually a filter could be added in COFFEE to restrict the reconstruction on high-order aberrations. Low-order aber-rations can be reconstructed by a separate branch set up with a specific tool such as a low-order wavefront sensor (LOWFS).
Fig. 13.Power spectral distribution (PSD) of a flat phase with one seg-ment unphased, at the same scale and dimensions as the Iris-AO seen by COFFEE (red). PSD of the corresponding phase reconstructed by COFFEE (green). We observe a fit for frequencies higher than the FPM cutoff frequency (around 3.5λ/D), while lower-frequency components are not well reconstructed.
Most future instrument concepts, including the HiCAT testbed, include a LOWFS, which could be combined with a COFFEE-like sensor to fully reconstruct aberrations and in particular phas-ing errors.
Fig. 14. Test of different FPM sizes and impact on the reconstruction: (top) theoretical phases, (middle) phases reconstructed with COFFEE, (bottom) difference between the two previous phases, from left to right: 1–12 λ/D, for a Lyot ratio of 90%. After a diameter of around 7λ/D, the FPM acts like a high-pass filter and blocks low frequency components of the segment-like aberration that cannot be seen by the sensor.
Fig. 15.Comparison, in the coronagraphic configuration (FPM
diame-ter: 4.4λ/D), of (left) the phase reconstructed by COFFEE subtracted by a reference phase (in nanometers), also reconstructed by COF-FEE (95.0 nm RMS), (center) the theoretical phase (in nanometers) issued from the command sent to the Iris-AO (92.3 nm RMS), and (c) the reconstruction error phase (in nanometers), that is, the differ-ence between the two previous phases, when random piston values are applied on the Iris-AO. The three phases are on the same scale.
Acknowledgements. This work was supported in part by the National Aero-nautics and Space Administration under Grant 80NSSC19K0120 issued through the Strategic Astrophysics Technology/Technology Demonstration for Exoplanet Missions Program (SAT-TDEM; PI: R. Soummer). This work has also received support of IRIS Origines et Conditions d’Apparition de la Vie (OCAV) of PSL Idex under the program “Investissements d’Avenir” with the reference ANR-10-IDEX-0001-02 PSL. The author would also like to thank the LESIA labora-tory (Laboratoire d’Etudes Spatiales et d’Instrumentation en Astrophysique) of the Observatoire de Paris, the French Aerospace Lab (ONERA) in the frame of the VASCO Research Project and the Laboratoire d’Astrophysique de Marseille (LAM), and the ANR WOLF for their support. The author particularly thanks Raphaël Galicher for his help and support.
References
Baudoz, P., Boccaletti, A., Baudrand, J., & Rouan, D. 2006, in 200: Direct Imaging of Exoplanets: Science Techniques, eds. C. Aime, & F. Vakili ,IAU Colloq, 553
Beuzit, J. L., Vigan, A., Mouillet, D., et al. 2019,A&A, 631, A155
Brady, G. R., Moriarty, C., Petrone, P., et al. 2018,Proc. SPIE, 10698
Brown, R. A., & Soummer, R. 2010,ApJ, 715, 122
Dalcanton, J., Seager, S., Aigrain, S., et al. 2015, ArXiv e-prints [arXiv:1507.04779]
Davies, R., Ageorges, N., Barl, L., et al. 2010,Proc. SPIE, 7735, 77352A
Dohlen, K., Langlois, M., Lanzoni, P., et al. 2006,SPIE Conf. Ser., 6267, 626734
Fauvarque, O., Neichel, B., Fusco, T., Sauvage, J.-F., & Girault, O. 2016,Optica, 3, 1440
Gonsalves, R. A. 1982,Opt. Eng., 21, 829
Harness, A. D. 2016,High Contrast Astronomy with Starshades(University of Colorado at Boulder) PhD thesis
Herscovici-Schiller, O., Mugnier, L. M., Baudoz, P., et al. 2018a,Proc. SPIE, 10703, 1070329
Herscovici-Schiller, O., Mugnier, L. M., Baudoz, P., et al. 2018b,A&A, 614, A142
Herscovici-Schiller, O., Sauvage, J.-F., Mugnier, L. M., Dohlen, K., & Vigan, A. 2019,MNRAS, 488, 4307
Kasper, M. E., Beuzit, J. L., Verinaud, C., et al. 2008,Proc. SPIE, 7015, 70151S
Krist, J. E., Balasubramanian, K., Muller, R. E., et al. 2010,Proc. SPIE, 7731, 77313J
Leboulleux, L., N’Diaye, M., Riggs, A. J. E., et al. 2016,SPIE Conf. Ser., 9904, 99043C
Leboulleux, L., N’Diaye, M., Mazoyer, J., et al. 2017,SPIE Conf. Ser., 10562, 105622Z
Leboulleux, L., Sauvage, J.-F., Pueyo, L., et al. 2018,J. Astron. Telesc., Instrum. Syst., 4, 035002
Lightsey, P. A., Knight, J. S., & Golnik, G. 2014,Proc. SPIE, 9143, 914304
Lyot, B. 1932,ZAp, 5, 73
Macintosh, B., Troy, M., Doyon, R., et al. 2006,Proc. SPIE, 6272, 62720N
Malbet, F. 1996,A&AS, 115, 161
Mandell, A. M., Groff, T. D., Gong, Q., et al. 2017,SPIE Conf. Ser., 10400, 1040009
Martinez, P., Beaulieu, M., Janin-Potiron, P., et al. 2016,Proc. SPIE, 9906, 99062V
Martinez, P., Janin-Potiron, P., Beaulieu, M., et al. 2018,Proc. SPIE, 10703, 1070357
Mazoyer, J., Baudoz, P., Galicher, R., Mas, M., & Rousset, G. 2013,A&A, 557, A9
Mazoyer, J., Pueyo, L., N’Diaye, M., et al. 2018a,AJ, 155, 7
Mazoyer, J., Pueyo, L., N’Diaye, M., et al. 2018b,AJ, 155, 8
Mennesson, B., Gaudi, S., Seager, S., et al. 2016,Proc. SPIE, 9904, 99040L
Moriarty, C., Brooks, K., Soummer, R., et al. 2018,Proc. SPIE, 10698, 1069853
Mugnier, L. M., Blanc, A., & Idier, J. 2006, inAdvances in Imaging and Electron Physics, ed. P. Hawkes (Elsevier), 141, 1
N’Diaye, M., Choquet, E., Pueyo, L., et al. 2013a,Proc. SPIE, 8864, 88641K
N’Diaye, M., Dohlen, K., Fusco, T., & Paul, B. 2013b, A&A, 555, A94
N’Diaye, M., Choquet, E., Egron, S., et al. 2014,SPIE Conf. Ser., 9143, 914327
N’Diaye, M., Mazoyer, J., Choquet, É., et al. 2015,SPIE Conf. Ser., 9605, 96050I
Paul, B. 2014, Post-coronagraphic Wave-front Sensing for High Contrast
Imaging for Ground and Space Based Observations (Université
d’Aix-Marseille) Theses
Paul, B., Mugnier, L. M., Sauvage, J. F., Ferrari, M., & Dohlen, K. 2013a,Opt. Express, 21, 31751
Paul, B., Sauvage, J.-F., & Mugnier, L. M. 2013b,A&A, 552, A48
Paul, B., Sauvage, J. F., Mugnier, L. M., et al. 2014,A&A, 572, A32
Perrin, M. D., Pueyo, L., Van Gorkom, K., et al. 2018,Proc. SPIE, 10698, 1069809
Pueyo, L., Zimmerman, N., Bolcar, M., et al. 2017,SPIE Conf. Ser., 10398, 103980F
Quanz, S. P., Crossfield, I., Meyer, M. R., Schmalzl, E., & Held, J. 2015,Int. J. Astrobiol., 14, 279
Rousset, G. 1999, inWave-front Sensors, ed. F. Roddier
Sauvage, J.-F., Mugnier, L., Paul, B., & Villecroze, R. 2012,Opt. Lett., 37, 4808
Sivaramakrishnan, A., Koresko, C. D., Makidon, R. B., Berkefeld, T., & Kuchner, M. J. 2001,ApJ, 552, 397
Soummer, R., Brady, G. R., Brooks, K., et al. 2018, Proc. SPIE, 10698, 106981O
Soummer, R., Laginja, I., Will, S., et al. 2019,Proc. SPIE, 11117, 111171Y
Spergel, D., Gehrels, N., Breckinridge, J., et al. 2013, ArXiv e-prints [arXiv:1305.5422]
Stahl, M. T., Shaklan, S. B., & Stahl, H. P. 2015,Proc. SPIE, 9605, 96050P
Stark, C. C., Cady, E. J., Clampin, M., et al. 2016,Proc. SPIE, 9904, 99041U
Stevenson, K. B., Lewis, N. K., Bean, J. L., et al. 2016,PASP, 128, 094401
The LUVOIR Team 2019, ArXiv e-prints [arXiv:1912.06219]
Traub, W. A. 2003,ASP Conf. Ser., 291, 117
Wang, Y., & Vaughan, A. H. 1988,Appl. Opt., 27, 27