HAL Id: hal-02994188
https://hal.archives-ouvertes.fr/hal-02994188
Submitted on 7 Nov 2020
HAL is a multi-disciplinary open access
archive for the deposit and dissemination of
sci-entific research documents, whether they are
pub-lished or not. The documents may come from
teaching and research institutions in France or
abroad, or from public or private research centers.
L’archive ouverte pluridisciplinaire HAL, est
destinée au dépôt et à la diffusion de documents
scientifiques de niveau recherche, publiés ou non,
émanant des établissements d’enseignement et de
recherche français ou étrangers, des laboratoires
publics ou privés.
ITERA: IDL Tool for Emission-line Ratio Analysis
Brent Groves, Mark G. Allen
To cite this version:
Brent Groves, Mark G. Allen. ITERA: IDL Tool for Emission-line Ratio Analysis. New Astronomy,
Elsevier, 2010. �hal-02994188�
ITERA: IDL Tool for Emission-line Ratio Analysis
Brent A. Grovesa, Mark G. Allenba
Sterrewacht Leiden, Leiden University, Neils Bohrweg 2, Leiden 2333-CA The Netherlands
b
Observatoire de Strasbourg UMR 7550 Strasbourg 67000, France
Abstract
We present a new software tool to enable astronomers to easily compare observations of emission line ra-tios with those determined by photoionization and shock models, ITERA, the IDL Tool for Emission-line Ratio Analysis. This tool can plot ratios of emission lines predicted by models and allows for compar-ison of observed line ratios against grids of these models selected from model libraries associated with the tool. We provide details of the libraries of standard photoionization and shock models available with ITERA, and, in addition, present three example emission line ratio diagrams covering a range of wavelengths to demonstrate the capabilities of ITERA. ITERA, and associated libraries, is available from http://www.brentgroves.net/itera.html.
Keywords: hydrodynamics shock waves ISM: abundances, Galaxies: Nuclei, Galaxies: Seyfert -infrared: ISM, Ultraviolet: ISM, X-rays: ISM
1. Introduction
All emission lines are sensitive to some extent on the physical conditions in the emitting gas. This in-cludes the density and electron temperature of the medium, the abundance of the emitting element, and the details of the ionizing source such as the luminosity and effective temperature of the star in H ii regions. While both atomic and line theory and observational data have advanced sufficiently over the years such that the dependency of individ-ual emission lines on nebulae parameters is known, determining these same parameters from individ-ual lines is difficult apart from a few exceptions. One of the simplest ways to break these inherent degeneracies is through the use of emission line ra-tios. Using lines arising from the same elements, or similar ionization potentials, or even from different levels of the same ion, can minimize the dependence on some or most of the parameters that control line emission, thus enabling the construction of diagnos-tics.
One of the first diagnostic emission line ratios was the [O iii] line ratio λ4363˚A/λ5007˚A put for-ward by Menzel et al. (1941). By using forbidden
Email addresses: [email protected](Brent A. Groves), [email protected] (Mark G. Allen )
lines of the same ion, O+2, both the abundance
and ionization dependencies are removed, leaving a ratio strongly dependent on electron temperature due to the different excitation levels of the lines in-volved (see e.g. Fig. 2.5 in Dopita & Sutherland, 2003). This line method, and other methods of determining electron temperature, have been dis-cussed in detail by Peimbert (1967). The same rea-soning has also been extended to several other line ratios, using lines from a single ion but arising from different energy levels, such as optical-IR ratios like [O iii]λ5007˚A/λ52µm (see e.g. Dinerstein et al., 1985) and UV ratios like C iii]λ1909/C iiiλ977.
Similarly, ratios of forbidden lines arising from the same ion and similar energy levels remove abun-dance, ionization and temperature dependencies. If these lines arise from levels with different col-lisional de-excitation rates or radiative transition probabilities, this ratio will be sensitive to the den-sities in the range spanned by the critical densi-ties of the lines involved. This idea was first put forward by Aller et al. (1949) for the [O ii] dou-blet, λ3726/λ3729, and has been extended to sev-eral other strong lines like [S ii] λ6716/λ6731 or in the IR [S iii] λ18.7µm/λ33.5µm (see Rubin, 1989, for a nice overview of these ratios).
sen-sitive ratios described above, determining physi-cal quantities from single line ratios proves dif-ficult due to degeneracies between the various controlling parameters of the nebula emission. Generally what is done is to use several line ratios in combination to break these degenera-cies, such as determining the metallicity or abun-dances in the gas (see e.g. Kewley & Ellison, 2008, for an overview of several line methods for metallicity determination), or to use empirically-based assumptions, such as the constancy of the Balmer decrement in H ii regions for dust-reddening determination (also theoretically supported, see e.g. Cox & Mathews, 1969; Brocklehurst, 1971; Miller & Mathews, 1972, though these concentrate mostly on planetary nebulae). An overview of all methods of comparing observed emission lines with theory can be found in Stasi´nska (2007) and in books such as Osterbrock & Ferland (2006) and Dopita & Sutherland (2003), which give a broad understanding of the topic and underlying physics. One of the best ways to disentangle these de-generacies is to plot two line ratios against each other in what is commonly called a line diagnos-tic diagram. These were first used as a method to distinguish various classes of emission-line galaxies in Heckman (1980) and Baldwin et al. (1981), with the diagrams described in the latter still commonly used to distinguish star-forming or H ii galaxies from galaxies dominated by an active galactic nucleus (AGN). These diagrams for emission-line galaxy classification were revised and extended by Veilleux & Osterbrock (1987), who based their se-lection of line ratios on 5 criteria: Line strength (1), Line proximity (for blending (2) and reddening (3) effects), the preferable inclusion of hydrogen lines (4) and the capability of detecting these lines (5).
With improvements in the availability of spectra, with wavelengths from the UV (such as Hubble-STIS) to FIR (e.g. Herschel -PACS & -HIFI) avail-able, increased spectral sensitivity and resolution, and a copious number of ionization models now available (e.g. Morisset, 2008), such criteria need not be so strict. However, these large increases in wavelength range, sensitivity, and models make analysis of emission-line objects much more compli-cated.
It is for these reasons that we introduce here a new, publicly available, emission-line analysis tool, ITERA. ITERA, the IDL Tool for Emission-line Ratio Analysis, allows the simple comparison of observed emission-lines from UV to far-IR
wave-lengths to models to assist in the determination of properties such as gas density, metallicity and ex-citation mechanism. We describe in the following sections the code and demonstrate some of the pos-sible diagnostic diagrams available.
2. The ITERA Program
The IDL Tool for Emission-line Ratio Analysis (ITERA) had its inception with the SHOCKPLOT tool created to display the results of the Allen et al. (2008) 150–1000 km s−1 shock models. The power
of such a tool was quickly realised and the original tool was rewritten and expanded into its current form. ITERA is an IDL1widget tool which enables
astronomers to plot line ratio diagrams of emission lines arising from atomic and ionized species as de-termined by standard photoionization and shock models. It also allows for a comparison of these line ratios with those obtained from observations or other models. As discussed in the introduction, these diagrams, or the individual ratios of the di-agram, can be used as diagnostics of nebulae exci-tation mechanisms, nebulae density, electron tem-perature, metallicity or individual abundance vari-ations, and other model-specific parameters. IT-ERA can also be used to determine line sensitivi-ties to such parameters, thus giving the possibility of creating new or “best possible” diagnostics for a given set of observations. It can even be used to estimate line fluxes that are weak or in unobserved wavelength ranges.
ITERA works in three simple steps; the user se-lects the emission lines to be used as the denomi-nators and numerators of the ratios for the X- and Y- axes, selects the model(s) that the user wants to examine, and, if wished, the user enters obser-vational data for comparison. These steps can be performed in any order. Multiple lines can be cho-sen for the ratios in the case of emission line dou-blets or line blends due to resolution or velocity ef-fects. What is returned is an emission-line ratio di-agram of the chosen ratios, displaying a grid of the chosen models and, if entered, observational data points. This diagram can be printed, or the model
1
IDL, the Interactive Data Language, is a computing environment for data analysis, vi-sualization, and application development, avail-able from ITT Visual Information Solutions (http://www.ittvis.com/ProductServices/IDL.aspx).
grids displayed can be output for use in other rou-tines, or direct comparison with data. The program and associated libraries and routines are available from http://www.brentgroves.net/itera.html. An IDL virtual machine2 version is also available
for those without access to IDL licences. Full in-structions and details of the program are found on the webpage, but we describe below the major parts of the program.
The principle of ITERA is to allow ease of ac-cess for astronomers to existing shock- and photo-ionization models for the determination of emission line strengths. Thus the strength of ITERA lies in the library of shock- and photo- ionization models associated with the code. This library is a distinct yet necessary part of ITERA, needed to generate the line ratios. As the library is distinct, only the wanted models can be implemented, including user-generated models.
2.1. Choosing the Models
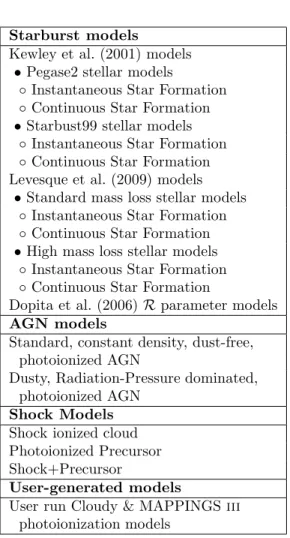
The library of models associated with ITERA cover the range of excitation mechanisms expected within emission-line galaxies; star formation, active galactic nuclei and shocks. These models, gener-ated by the shock and photoionization code MAP-PINGS iii, broadly cover the ratio space occupied by the dominant optical emission lines from galax-ies. Other sources of emission lines, such as individ-ual O and B stars (H ii regions) or planetary neb-ulae, can be included through the user-generated option of ITERA, and may be included in the li-brary at a later date. The ITERA model lili-brary is split into four main categories: Starburst or stellar ionization models, AGN models, shock models, and user-generated models. The currently available li-braries are shown in table 1, and described briefly below.
ITERA has the possibility of plotting up to any number of shock or photoionization model grids, al-though for clarity the number displayed on any plot is generally limited to 5. Every model set has a lim-ited number of parameters, with common parame-ters to the models being the emitting gas metal-licity or abundance pattern, and the gas density or pressure. The other parameters associated with the models tend to be specific to the specific sets, ei-ther due to the different physics associated with the
2IDL virtual machine is free
run-time version of IDL available from
http://www.ittvis.com/ProductServices/IDL/VirtualMachine.aspx.
ionizing/excitation mechanism, or due to different definitions but the model set creators. These in-clude the hardness of the radiation field, the veloc-ity of a shock ionizing the gas, or the dimensionless photoionization parameter. The parameters asso-ciated with the different model sets within the IT-ERA model library are described in the following subsections.
The model grids displayed within the ITERA plot window are formed by the ranges of two of these parameters, with the other parameters of the model sets fixed. The fixed parameters thus de-scribe the different model grids that can be plot-ted. The first parameter of the model grid is set and cannot be chosen by the user, and is generally a measure of the ionization state of the gas, such as ionization parameter or shock velocity. The sec-ond parameter of the grid can be chosen by the user, with the choice of density, metallicity or the unique parameter associated with that model set (as described below). If the user of ITERA wants to compare parameters other than the set first pa-rameter, e.g the ionization papa-rameter, this can be done by simply limiting the parameter range to a single value and plotting multiple grids.
2.1.1. Starburst Models
The ITERA model library includes 3 different Starburst models, aimed specifically at galaxies whose line emission is dominated by gas ionized by recent (< 107yr) star formation, generally classified
as starburst, H ii, or star-forming galaxies. How-ever, these models can also be generally applied to any massive star formation region, though the com-parison may break down for less massive star forma-tion regions once the effects of the stochastic sam-pling of the stellar initial mass function becomes important (<∼ 104M
⊙).
The first model set is from Kewley et al. (2001). These models use stellar ionizing spectra gen-erated by the stellar population synthesis codes PEGASE-2 (Fioc & Rocca-Volmerange, 1997) and Starburst99 (Leitherer et al., 1999), and consid-ers both continuous star formation and instan-taneous bursts. These models are then passed through the MAPPINGS iii code for a range of ionization parameters3. The stellar models
3
The ionization parameter, q, also known as the ioniza-tion front speed, is a measure of the ionizing photon flux over the (hydrogen) gas density; q = S∗/nH, where S∗is the
integral of the photon flux above 13.6 eV. This is also often given in a dimensionless form; U = q/c.
Starburst models
Kewley et al. (2001) models • Pegase2 stellar models
◦ Instantaneous Star Formation ◦ Continuous Star Formation • Starbust99 stellar models
◦ Instantaneous Star Formation ◦ Continuous Star Formation Levesque et al. (2009) models
• Standard mass loss stellar models ◦ Instantaneous Star Formation ◦ Continuous Star Formation • High mass loss stellar models
◦ Instantaneous Star Formation ◦ Continuous Star Formation
Dopita et al. (2006) R parameter models AGN models
Standard, constant density, dust-free, photoionized AGN
Dusty, Radiation-Pressure dominated, photoionized AGN
Shock Models Shock ionized cloud Photoionized Precursor Shock+Precursor
User-generated models
User run Cloudy & MAPPINGS iii photoionization models
Table 1: Listing of the model libraries currently available with ITERA
and subsequent photoionization modelling are de-termined for 5 metallicities, ranging from 0.05 to 2.0 Solar (Z⊙). For full details see the
Kewley et al. (2001) paper. These models were used as a basis for the strong-line metallicity es-timators in Kewley & Dopita (2002) and for the empirical/theoretical AGN/star-formation dividing lines discussed in Kauffmann et al. (2003) and Kewley et al. (2006).
The second set of models is from Levesque et al. (2009), and is an updated version of the Kewley et al. (2001) models, using a later version of MAPPINGS iii (version iiir) code for the radiative transfer, and using the latest version of the Star-burst99 code (V´azquez & Leitherer, 2005). Like the Kewley et al. (2001) work, Levesque et al. (2009) model includes both instantaneous burst and con-tinuous star formation stellar models, and covers a similar range in ionization parameter, q, and metal-licity. In addition, the Levesque et al. (2009) mod-els also cover a range of ages between 0 to 10 Myr (in steps of 0.5 Myr). What distinguishes these models from previous works is that they examined two different evolutionary tracks for the stellar pop-ulations, one with a standard mass loss treatment (STD) and one with high mass loss rates (HIGH) meant to more accurately match observations (see Levesque et al., 2009, for full details about the dif-ferent tracks and the models).
The third set is the “R parameter” models of Dopita et al. (2006). As with the previous set, these use MAPPINGS iiir for the radiative trans-fer and the latest version of Starburst99 to gener-ate the ionizing stellar spectra, though only instan-taneous bursts were considered. The same range of stellar ages and metallicities as Levesque et al. (2009) are used. What differentiates these models from the previous sets is that a direct link with the stellar populations and the surrounding ionized gas is considered. In these models all stellar clusters are born buried within their molecular birth clouds, but, over time, they clear an empty bubble around them, sweeping up the gas that forms the surround-ing H ii regions. This means that there is a direct link of both the gas density and incident ionizing flux, and thus the ionization parameter, at the in-ner edge of the H ii region to the evolution of the stars. With this link, the time-averaged ionization parameter is found to be directly correlated with the mass of the ionizing cluster divided by the aver-age ISM pressure, defined within the Dopita et al. (2006) work as R (= Mcl/PISM). Thus it is this
R parameter rather than the local ionization pa-rameter, q, that is measured when the emission-line ratios are measured on galactic scales. For full de-tails about the R parameter and the models see Dopita et al. (2006).
One important caveat with these models is that, while all three use the same global metallicities, the elemental abundances at each metallicity for each model differ due to the evolving definition of the abundance pattern at solar metallicity. Thus such differences must be considered when compar-ing these models.
2.1.2. AGN Models
The library of AGN models used in the ITERA code are those from the Groves et al. (2004a,b) pho-toionization models of the narrow line regions of AGN. We include two series of AGN models, the classic dust-free, AGN power-law ionized models and the dusty, radiation pressure dominated els introduced by Groves et al.. Both of these mod-els use simple power-law radiation fields (fν ∝ νβ)
to represent the AGN ionizing spectrum, and ex-plore the same range in metallicities (with the same abundance patterns), gas densities and ionization parameters. However the first models are dust free and assume a constant gas density throughout the narrow line region cloud. The second set are taken to be isobaric (constant pressure) and include dust and the effects of radiation pressure on dust, which causes significant differences in the resulting emis-sion line spectrum at high ionization parameters (see Groves et al., 2004a,b, for full details of the models). These latter models are much more closely matched with the observed line ratio space and are the recommended model to use.
While these models do not represent the full range of theoretical models for the emission from the narrow line regions of AGN (see e.g., Binette et al., 1996; Ferguson et al., 1997), they do broadly cover the expected emission of strong emis-sion lines, and can be used to estimate the “AGN space” of line ratios.
2.1.3. Shock Models
The shock models used in the ITERA library are directly imported from the Allen et al. (2008) work on fast shocks. They include a range of metal-licities, densities, and magnetic parameters (the “unique parameter” of these models), and explore velocities from ∼ 150 to 1000 km s−1, where strong
J-shocks occur. The shock models are split into
three sets. The first is the emission from the post-shock region, where gas is post-shock-excited to high temperatures and ionization states. The second model set is from the pre-shock or precursor region which is photoionized by the radiation emitted up-stream from the post-shock region. The third set is the combination of these (shock+precursor) for integrated measurements where the individual re-gions cannot be distinguished. For full details on the parameters and underlying physics of the mod-els see Allen et al. (2008).
2.1.4. User Generated Models
While the above models cover the expected parameter space of emission-line galaxies, they are not representative of individual objects, where variations in the abundances of specific elements, ionizing source variations or even geometrical effects can all affect the final emission-line spec-trum. Therefore we include the final option of user generated model libraries. This allows the possibility of a user inputting the results from well tested and respected photoionization codes such as Cloudy4 (Ferland et al., 1998)
and MAPPINGS iii5 (Groves et al., 2004a), or using on-line interfaces such as mapiiionline: http://www.ifa.hawaii.edu/~kewley/Mappings/. For a listing, comparison, and benchmarking of such models see P´equignot et al. (2001), though all these models have advanced since this work.
To assist in the input of user generated models into ITERA, we provide tools for converting the outputs from these models to format used by IT-ERA. Currently only conversion tools for the pub-licly available codes Cloudy and MAPPINGS iii are provided, but this may be expanded at a later date depending on demand.
2.2. Choosing Line Ratios
In principle, the choice of emission lines to use in the diagnostic line ratios in ITERA is limited purely by those provided by the code used to gen-erate the photoionization/shock model. In MAP-PINGS iii (including all the models provided in the library) this is limited to ∼1770 emission lines in the
4Cloudy is available for download from
http://www.nublado.org, along with full details on the code, how to use it, and how it works.
5MAPPINGS iii is available to download from
http://www.brentgroves.net/mapiii.html, which in-cludes a description of the code and its use.
infrared, optical, and ultraviolet, and even includ-ing high-ionization/inner-shell lines in the X-ray. In Cloudy, this is further expanded by a host of weaker lines as well as molecular ro-vibrational emission lines from CO and H2. The lines are listed in
sim-ple selection boxes, with only strong lines listed by default, though all lines, or lines in certain wave-length ranges, can be displayed if wished.
In addition, sums of lines can be used in the line ratios to account for line blending at low spectral resolution, or to account for different levels or ion-ization states (i.e. [O ii]λ3726 + 3729).
In practice however, the guidelines discussed in the introduction form the bases for good diagnos-tics. Lines of the same element and of the same ionization state or of similar excitation potential in different elements provide some of the strongest diagnostics. Lines relative to hydrogen recombina-tion lines are also good diagnostics. As discussed in Veilleux & Osterbrock (1987), lines in close wave-length proximity limit the possible instrumental, calibration, and reddening effects.
Hence it is for this reason that several stan-dard, strong-line, diagnostic ratios, such as [S ii]λλ6716, 31/Hα versus [O iii]λ5007/Hβ, are also included in ITERA as predefined diagnostic dia-grams for ease of use.
2.3. Comparison with Observations
Ultimately, the use of ionization models lies in their diagnostic power for observations, which is why ITERA also includes the ability to enter data. To allow for easy comparison of observations with the models, the ITERA program has three sim-ple ways in which data can be entered into the emission-line diagnostic diagrams directly; direct point by point entry, a simple list of line ratios for multiple data, and via tabulated emission line data for multiple line ratio comparisons. For the first two options, the line ratios for the chosen diagram are entered in and compared directly with the model on the chosen line ratio diagram (as shown in figure 2). Once the chosen diagram has cleared or another line ratio diagram chosen, the data are cleared. The tabulated emission line data are chosen in a similar manner as the models, with the data plotted over the model grids if the contain the chosen emission lines. Templates for the tabulated data are avail-able with the ITERA program.
Conversely, the fluxes (relative to Hβ) from the selected model grids for the four emission lines of the chosen line diagnostic diagram can be exported
to formatted ASCII files for comparison with ob-servational data. This is especially useful in cases of large datasets, such as with SDSS.
3. Emission Line Ratio Diagnostics
To demonstrate the capabilities of ITERA, we present here three emission-line ratio diagrams cov-ering a range of wavelengths and diagnostic capa-bilities. These diagrams are all direct output from the ITERA routine, excluding the histogram in the first diagram.
The first diagram (figure 1) shows [N ii]/Hα ver-sus [O iii]/Hβ, the classic “BPT” diagram from Baldwin et al. (1981) that is a diagnostic of the excitation mechanism in emission-line galaxies. Shown on this plot are two model grids; the Levesque et al. (2009) STD models for star-forming galaxies on the left, and the Groves et al. (2004b) models for Dusty AGN on the right. Both grids show a range of metallicities (blue curves) and ion-ization parameters (orange curves), though note that these grids are not equivalent. The exact pa-rameters that the star forming models have are: Z ∼ 0.05, 0.2, 0.4, 1.0, 2.0Z⊙ and q = 1 × 10⁷, 2 × 10⁷ , 4 × 10⁷ , 8 × 10⁷ , 1 × 10⁸ , 2 × 10⁸ , 4 × 108cm s−1,
for a 2 Myr old burst with density nH= 100 cm−3,
while the AGN models have: Z ∼ 1.0, 2.0, 4.0Z⊙
with log U = 0.0, −0.3, −0.6, −1.0, ..., −3.6, −4.0, a gas density of nH= 1000 cm−3 and are ionized by a
power-law of index β = −1.4. Underlying the grids is a coloured 2D density histogram of the SDSS DR4 emission line galaxy sample from Groves et al. (2006), displaying the observed distribution of star forming galaxies (Green squares), Seyfert galaxies (blue squares), and LINER galaxies (red squares).
The model grids clearly encompass the observed line ratio space. Note how the star forming mod-els follow closely the green branch of this diagram, showing the known strong dependence on metal-licity of the [N ii]/Hα ratio, with the ionization pa-rameter affecting the position of the models in both ratios, explaining the spread in observed galaxies (along with the average age of the ionizing stars). Also note that the models fail to reproduce the ob-served line ratios at very low metallicities, and do so even when different ages are used for the ionizing stars, indicating that there are still underlying is-sues with either the photoionization models, stellar population models, or both. The AGN model grid on the other hand actually tends to be too broad, demonstrating the sparsity of low metallicity AGN 6
Figure 1: The BPT diagram of [N ii]/Hα versus [O iii]/Hβ, showing grids of photoionization models for star form-ing galaxies (left, Levesque et al., 2009) and AGN (right, Groves et al., 2004b), described fully in the text. In both grids, lines of constant metallicity are shown by the blue curves, increasing from dark blue to light blue, and lines of constant ionization parameter are shown by the orange curves, increasing in value from red to yellow. In the back-ground is an image of a 2d density diagram from the SDSS DR4 sample described in Groves et al. (2006), showing star-forming galaxies (green), Seyfert galaxies (blue) and LINER galaxies (red).
in the SDSS emission-line galaxy sample, as dis-cussed in Groves et al. (2006). The low U NLR models are likely to be too faint to be observed in this sample. It should be remembered that the AGN and star forming galaxy models show are the extremes, of pure AGN contribution and pure H ii regions. In between these models, seen in the right-hand wing of the diagram (the ‘AGN’ branch) are galaxies where both mechanisms, active star forma-tion and AGN, contribute to the galaxy spectrum. The second diagram (figure 2) shows the mid-IR diagram of [Ne iii]15.6µm/[Ne ii]12.8µm versus [S iv]10.5µm/[Ne ii]12.8µm. A surprisingly strong correlation between these ratios was found by Groves et al. (2008), who explored a large sample of emission line objects to see if the ground-observable [S iv]/[Ne ii] ratio could replace the space-only, ion-ization sensitive [Ne iii]/[Ne ii] ratio. Here we show only a sub-sample of that collated by Groves et al. (2008), displaying only star formation ionized re-gions (starbursts, blue compact dwarfs, extragalac-tic H ii regions, and galacextragalac-tic H ii regions), shown as crosses on figure 2. Overlaying the observed data is same star-formation model grid of metallicity and ionization parameter as in figure 1, as labelled in the colour bars. The model grid broadly covers the
ob-Figure 2: The mid IR emission line ratio di-agram of [Ne iii]15.6µm/[Ne ii]12.8µm versus [S iv]10.5µm/[Ne ii]12.8µm, showing the same Levesque et al. (2009) star forming galaxy photoion-ization model as in figure1, with the grids curves as labelled in the colour bar to the right. The stars are a sample of O and B star ionized systems (star-forming galaxies and extragalactic and galactic H ii systems) collated and described in Groves et al. (2008).
servations, with both higher metallicity and lower ionization parameter towards the lower left of the grid (lower ionization). This is somewhat degener-ate with the age of the ionizing stellar population, with ages greater than ∼ 4 Myrs moving strongly to the lower left of the grid.
There are two interesting points to take from this grid. The first is that the models are unable to ex-plain the full spread of the data, though this may arise due to the ∼ 20% uncertainty in the data (see Groves et al., 2008, for details). The high values of [S iv]/[Ne ii] may come also from higher ionization parameters and or different abundance patterns, but the points to the right of the diagram suggest, as in the previous figure, that the low metallicity models (or youngest age or Wolf-Rayet models sim-ilarly) are lacking a hard enough spectrum to reach these ionization states.
The second is that the observed relation between [Ne iii]/[Ne ii] and [S iv]/[Ne ii] has a different slope and narrower spread than the model grid, suggest-ing that there may a higher order correlation gosuggest-ing on between the metallicity and age of the stellar population and the ionization parameter of the ion-ized gas.
The final diagram uses optical and far-IR lines of the same species, O+2, aiming towards the
Figure 3: Diagnostic diagram using only O+2emission lines,
containing the density sensitive [O iii] 52µm/88µm ratio ver-sus the temperature sensitive [O iii]5007˚A/88µm ratio, that both use the Herschel observable [O iii]88µm line. Shown are two different density (nH= 10 cm−3, lower left grid, and
nH = 350 cm−3, lower right grid) instantaneous starburst
models from Kewley et al. (2001), and two different density (nH= 0.1 cm−3, upper left green curve, and nH= 10 cm−3,
upper right green curve) shock models from Allen et al. (2008). In both models, the state of ionization (ionization parameter r shock velocity) increases from red to yellow. The four models are well separated in this diagram thanks to the diagnostic power of the ratios.
Space Telescope, specifically the PACS spectrom-eter. Figure 3 shows the [O iii] 52µm/88µm versus [O iii]5007˚A/88µm, based on the Dinerstein et al. (1985) diagram. This diagram is a strong diag-nostic diagram, separating out both density and temperature, while avoiding direct abundance and ionization effects. While unfortunately the den-sity sensitive 52µm/88µm ratio cannot be observed in the local Universe with Herschel due to the lower wavelength limit, the temperature sensitive 5007˚A/88µm ratio can be obtained in combina-tion with ground based data. To demonstrate the power of this diagram we show two star forming model grids from Kewley et al. (2001), and two shock model curves from Allen et al. (2008).
The Kewley et al. (2001) models are grids in metallicity (blue curves, same as Levesque mod-els) and ionization parameter (orange curves) us-ing a Starburst99 3 Myr old instantaneous burst as the ionizing source. What distinguishes the two model grids is the density of the ionized gas, with the left grid at nH = 10 cm−3, and the right grid
at nH = 350 cm−3. The 52µm/88µm ratio clearly
separates the two grids. Though difficult to see due to their collapsed form, the 5007˚A/88µm ratio is
affected by both the ionization parameter (weakly) and the metallicity (more strongly). However the diagnostic strength of this ratio is more clearly seen when compared to the much hotter ionized gas in the shocks.
The Allen et al. (2008) model curves (green) show pure shock models at solar metallicity, mag-netic parameter of B/√n = 1µG cm3/2, and
ve-locities ranging from 150 (red squares) – 1000 (yel-low squares) km s−1. Again, the two curves are
separated by density, with the left curve having a pre-shock density of nH= 0.1 cm−3, and the right
nH = 10 cm−3. What is clearly noticeable in
fig-ure 3, is the clear vertical offset between the shock models and star forming models in the temperature sensitive [O iii] 5007˚A/88µm ratio, demonstrating clearly the possible capabilities of upcoming
Her-schel-PACS spectral surveys. 4. Summary
We have presented here a new tool to enable as-tronomers to compare observations of emission line ratios with that determined by photoionization and shock models, ITERA, the IDL Tool for Emission-line Ratio Analysis. ITERA is an IDL widget tool which allows the user to plot ratios of any strong atomic and ionized emission lines as deter-mined by standard photoionization and shock mod-els. These line ratio diagrams can then be used to determine diagnostics for nebulae excitation mecha-nisms (such as discussed in the Baldwin et al., 1981, paper) or for nebulae parameters such as density, temperature, metallicity, etc. ITERA can also be used to determine line sensitivities to such parame-ters, compare observations with the models, or even estimate unobserved line fluxes. This tool, and as-sociated libraries and instructions, can be obtained at http://www.brentgroves.net/itera.html.
At its core lies a library of emission-line nebulae models, covering photoionization by young O and B stars (e.g. Kewley et al., 2001; Dopita et al., 2006), photoionization by a hard power-law spectrum from an AGN (e.g. Groves et al., 2004b) and ionization by shocks (e.g. Allen et al., 2008). These models broadly cover the space of observed emission-line objects.
Finally, to demonstrate the capabilities of ITERA we present three different line di-agnostic diagrams; the classic BPT diagram of [N ii]λλ6548, 6584/ha versus [O iii]λ5007/Hβ, showing the coverage of the star forming galaxy 8
and AGN photoionization models when com-pared to SDSS emission-line galaxies, the mid-IR diagram of [Ne iii]15.6µm/[Ne ii]12.8µm versus [S iv]10.5µm/[Ne ii]12.8µm, revealing an interest-ing correlation of ionization parameter and metal-licity of stellar photoionization models when com-pared to observations, and the optical IR diagram of O+2, [O iii] 52µm/88µm versus [O iii]5007˚A/88µm,
demonstrating one of the diagnostic possibilities of
Herschel.
It is hoped that this tool will be of great use to the astronomical community when analyzing spectra of emission-line regions due to both its simplicity and ease of use, especially as the library expands with the growing number of photoionization and shock models becoming available.
Acknowledgements
The authors would like to thank those who have given feedback on ITERA as it was being devel-oped; B. Brandl, E. da Cunha, J. Holt, M. Sarzi and H. Spoon.
Allen, M. G., Groves, B. A., Dopita, M. A., Sutherland, R. S., & Kewley, L. J. 2008, ApJS, 178, 20
Aller, L. H., Ufford, C. W., & van Vleck, J. H. 1949, ApJ, 109, 42
Baldwin, J. A., Phillips, M. M., & Terlevich, R. 1981, PASP, 93, 5
Binette, L., Wilson, A. S., & Storchi-Bergmann, T. 1996, A&A, 312, 365
Brocklehurst, M. 1971, MNRAS, 153, 471
Cox, D. P., & Mathews, W. G. 1969, ApJ, 155, 859 Dinerstein, H. L., Lester, D. F., & Werner, M. W. 1985, ApJ,
291, 561
Dopita, M. A., et al. 2006, ApJS, 167, 177
Dopita, M. A., & Sutherland, R. S. 2003, Astrophysics of the diffuse universe, Berlin, New York: Springer, 2003. As-tronomy and astrophysics library, ISBN 3540433627 Fioc, M., & Rocca-Volmerange, B. 1997, A&A, 326, 950 Ferland, G. J., Korista, K. T., Verner, D. A., Ferguson,
J. W., Kingdon, J. B., & Verner, E. M. 1998, PASP, 110, 761
Ferguson, J. W., Korista, K. T., Baldwin, J. A., & Ferland, G. J. 1997, ApJ, 487, 122
Groves, B. A., Dopita, M. A., & Sutherland, R. S. 2004, ApJS, 153, 9
Groves, B. A., Dopita, M. A., & Sutherland, R. S. 2004, ApJS, 153, 75
Groves, B. A., Heckman, T. M., & Kauffmann, G. 2006, MNRAS, 371, 1559
Groves, B., Nefs, B., & Brandl, B. 2008, MNRAS, 391, L113 Heckman, T. M. 1980, A&A, 87, 152
Kauffmann, G., et al. 2003, MNRAS, 346, 1055
Kewley, L. J., Dopita, M. A., Sutherland, R. S., Heisler, C. A., & Trevena, J. 2001, ApJ, 556, 121
Kewley, L. J., & Dopita, M. A. 2002, ApJS, 142, 35 Kewley, L. J., Groves, B., Kauffmann, G., & Heckman, T.
2006, MNRAS, 372, 961
Kewley, L. J., & Ellison, S. L. 2008, ApJ, 681, 1183 Leitherer, C., et al. 1999, ApJS, 123, 3
Levesque, E. M., Kewley, L. J., & Larson, K. L. 2009, AJ Submitted (arXiv:0908.0460)
, D. H., Aller, L. H., & Hebb, M. H. 1941, ApJ, 93, 230 Miller, J. S., & Mathews, W. G. 1972, ApJ, 172, 593 Morisset, C. 2008, SF2A-2008, 335
Osterbrock, D. E., & Ferland, G. J. 2006, Astrophysics of gaseous nebulae and active galactic nuclei, 2nd. ed. by D.E. Osterbrock and G.J. Ferland. Sausalito, CA: Uni-versity Science Books, 2006
P´equignot, D., et al. 2001, Spectroscopic Challenges of Pho-toionized Plasmas, 247, 533
Peimbert, M. 1967, ApJ, 150, 825 Rubin, R. H. 1989, ApJS, 69, 897
Seaton, M. J. 1960, Reports on Progress in Physics, 23, 313 Stasi´nska, G. 2007, arXiv:0704.0348
V´azquez, G. A., & Leitherer, C. 2005, ApJ, 621, 695 Veilleux, S., & Osterbrock, D. E. 1987, ApJS, 63, 295
![Figure 2: The mid IR emission line ratio di- di-agram of [Ne iii ]15.6µm/[Ne ii ]12.8µm versus [S iv ]10.5µm/[Ne ii ]12.8µm, showing the same Levesque et al](https://thumb-eu.123doks.com/thumbv2/123doknet/14798718.605084/8.892.95.430.161.402/figure-emission-line-ratio-agram-versus-showing-levesque.webp)
![Figure 3: Diagnostic diagram using only O +2 emission lines, containing the density sensitive [O iii ] 52µm/88µm ratio ver-sus the temperature sensitive [O iii ]5007˚ A/88µm ratio, that both use the Herschel observable [O iii ]88µm line](https://thumb-eu.123doks.com/thumbv2/123doknet/14798718.605084/9.892.93.429.158.408/diagnostic-emission-containing-sensitive-temperature-sensitive-herschel-observable.webp)