HAL Id: hal-03010559
https://hal.archives-ouvertes.fr/hal-03010559
Submitted on 17 Nov 2020
HAL is a multi-disciplinary open access
archive for the deposit and dissemination of sci-entific research documents, whether they are pub-lished or not. The documents may come from teaching and research institutions in France or abroad, or from public or private research centers.
L’archive ouverte pluridisciplinaire HAL, est destinée au dépôt et à la diffusion de documents scientifiques de niveau recherche, publiés ou non, émanant des établissements d’enseignement et de recherche français ou étrangers, des laboratoires publics ou privés.
Barite Growth Rates as a Function of Crystallographic
Orientation, Temperature, And Solution Saturation
State
Mélanie Vital, Damien Daval, Gilles Morvan, Daniel Martinez, Michael Heap
To cite this version:
Mélanie Vital, Damien Daval, Gilles Morvan, Daniel Martinez, Michael Heap. Barite Growth Rates as a Function of Crystallographic Orientation, Temperature, And Solution Saturation State. Crystal Growth & Design, American Chemical Society, 2020, 20 (6), pp.3663-3672. �10.1021/acs.cgd.9b01506�. �hal-03010559�
1
Barite growth rates as a function of crystallographic orientation,
1
temperature, and solution saturation state
2 3
Mélanie Vital1,2,*, Damien Daval2,*, Gilles Morvan2, Daniel E. Martinez1, Michael J. Heap3 4
5
1Instituto de Geología de Costas y Cuaternario (UNMDP-CIC) – Instituto de Investigaciones Marinas 6
y Costeras (CONICET-UNMDP). Mar del Plata, Argentina. 7
2Université de Strasbourg, CNRS / ENGEES – EOST, Laboratoire d’Hydrologie et de Géochimie de 8
Strasbourg, 1 Rue Blessig, 67084 Strasbourg, France. 9
3Géophysique Expérimentale, Institut de Physique de Globe de Strasbourg (UMR 7516 CNRS, 10
Université de Strasbourg/EOST), 5 rue René Descartes, 67084 Strasbourg cedex, France. 11
12
*corresponding authors: 13
M. Vital ([email protected] ; Tel.: 005492235288191) 14
D. Daval ([email protected] ; Tel.: 003 68 85 05 56) 15
16 17
2
Abstract
18
Barite growth kinetics was investigated as a function of crystallographic orientation for temperatures 19
between 10 and 70 °C, and initial saturation indices (SI) of 1.1 and 2.1. The growth rates were estimated 20
for (001), (210), and (101) faces using vertical scanning interferometry. Overall, face-specific barite 21
growth rates (𝑟( )) can be successfully described by the following rate law:
22
𝑟( ) = 𝐴( ). exp −𝐸( )⁄𝑅𝑇 . (10 − 1)
23
where 𝐴( )and 𝐸( ) represent the face-specific Arrhenius pre-exponential factor and activation
24
energy, respectively, R is the gas constant, and T refers to the absolute temperature. In addition, 25
because of the modest growth anisotropy of the various investigated faces, the following isotropic rate 26
law can be used to satisfactorily account for the measured rate data: 27
𝑟( ) = 𝐴. exp(−𝐸 𝑅𝑇⁄ ). (10 − 1)
28
with average values of A = exp(13.59) nm.h-1 and Ea = 35.0 ± 2.5 kJ.mol-1. Over the range of conditions 29
investigated in the present study, our results suggest that barite growth kinetics is surface-controlled, 30
while possibly verifying the principle of detailed balancing and micro-reversibility. These results 31
imply that previous modeling exercises of steady-state barite growth based on isotropic rate laws may 32
remain valid, at least over the range of conditions investigated in the present study. 33
34
Keywords: barite; anisotropic growth; geothermal reservoir; scaling; growth rate law 35
3
1. Introduction
37
Several industrial, environmental, and geological concerns require a detailed understanding of 38
barite (BaSO4) growth kinetics. From an industrial standpoint, barite scale formation spontaneously 39
occurs within geothermal wells1 and inside fractures within geothermal reservoirs2 (Fig. 1), which 40
disturb both the continuous running of geothermal power plants and the efficiency of fluid circulation 41
due to the reduction in reservoir permeability2. The development of new reagents that could efficiently 42
prevent or delay the barite scale formation crucially relies on our understanding of the mechanisms of 43
barite precipitation3, 4. 44
45
46
Figure 1. Photograph of a section of 78 mm-diameter, cylindrical sandstone core (from the Buntsandstein unit) taken
47
from the Soultz-sous-Forêts (France) EPS-1 exploration borehole, a borehole fully cored from a depth of 930 m to a
48
depth of 2227 m in 1990-1991 (see 5-7 for information on the Soultz-sous-Forêts drilling project). The sandstone core, 49
red/green in color, was taken from a depth of 1374 m and contains a 1-2 cm-wide fracture (in the center of the core). The
50
fracture is partially filled with barite crystals (white in color) that have precipitated from the circulating geothermal
51
fluids.
4
From an environmental standpoint, the formation of barite is known to be frequently associated 53
with the accumulation of elevated concentrations of radionuclides such as 226Ra, which has stimulated 54
several studies dedicated to quantify the uptake of radionuclides during barite precipitation (e.g., 8-11). 55
Finally, from a geological standpoint, barite formation provides insight into past seawater chemistry 56
(e.g. 12, 13), indirectly raising the question of the mechanisms of barite precipitation from environments 57
that contained only trace amounts of sulfate. This issue has puzzled the geochemical community for 58
decades14, and further emphasizes the need for a more accurate picture of the mechanisms of barite 59
nucleation and growth4. 60
In spite of the indisputable interest associated with barite formation, our knowledge regarding 61
barite growth kinetics remains incomplete. With the noticeable exception of a few recent studies 62
focused on barite growth on the specific (001) face over a wide range of temperatures (from 30 °C to 63
108 °C)15-17, most existing studies were limited to the low temperature domain12, 18 and were derived 64
from experiments conducted on powders. While the resulting isotropic growth rate laws derived from 65
powder experiments have proved useful for modeling exercises (e.g., 2), it is noteworthy that they 66
remain essentially empirical, which may cast doubt on their predictive ability. In particular, a recent 67
study by Godinho and Stack19 has shown that barite growth is an anisotropic process. Importantly, 68
isotropic kinetic rate laws were demonstrated to be unreliable and of low relevance to model 69
anisotropic processes such as mineral dissolution/precipitation (e.g., 19-22), unless the same rate-70
limiting step controls the dissolution/growth kinetics of all faces. Among the main consequences of 71
this anisotropic reactivity are (i) the non-uniqueness of the relation between dissolution/growth rate 72
and the saturation state of the solution22, (ii) the existence of a transient regime where the crystal habit 73
continuously evolves, resulting in an equal gradual evolution of the apparent dissolution/growth rate 74
“constant”19, 21-24, and (iii) the existence of distinct equilibrium morphologies for a given crystal, which 75
depend on the face-specific dissolution/growth rates of the considered crystal and therefore on reaction 76
conditions such as temperature, fluid saturation state, and the potential catalytic / poisoning effects of 77
5
specific (bio)molecules25-27. Therefore, in addition to the expected improvement of reactive transport 78
simulations, knowledge of the variables that influence the face-specific growth rates of minerals can 79
also help decipher the factors that shape crystals, which might be useful to provide insights into the 80
putative biological origin of minerals recovered from environments on Earth and on other planets (26 81
and references therein). 82
To sum up, the study by Godinho and Stack19 paved the way for a radically new description of 83
barite growth kinetics, and provided the very first data in that respect. However, their study was limited 84
to ambient temperature, whereas barite formation may occur over a wide range of environmental 85
conditions, ranging from slightly above the freezing point in oceans to several tens to hundreds of 86
degrees in geothermal reservoirs. To this end, the present study was principally aimed at extending 87
this dataset to a wider range of temperatures and to eventually derive an activation energy for face-88
specific barite growth rate. We also provide rate data for an additional face that was not investigated 89
in the study by Godinho and Stack19, at two different fluid saturation states. Taken together, we show 90
that the activation energy is the same for all faces (within uncertainties), which is compatible with the 91
assumption that all faces may have the same unique rate-limiting step. In addition, this activation 92
energy is close to that determined by Zhen-Wu et al.12 for barite dissolution, which is compatible with 93
their hypothesis of micro-reversibility of barite dissolution/precipitation process. 94
6
2. Materials and methods
95
2.1 Starting materials and preparation
96
Single crystals of barite (~50-100 mm in length / diameter) were collected in Puy de Chateix 97
(France). The chemical composition of the crystals was analyzed following the protocol described by 98
Bracco et al.16, revealing K, Sr and Al as the main impurities (0.14%, 0.10%, and 0.05% mol/mol Ba, 99
respectively). The crystals were cleaved along (210) and (001) and cut along the (101) plane. The 100
crystallographic orientations were first verified using Electron Backscatter Diffraction (EBSD) on a 101
Tescan Vega 2 scanning electron microscope (SEM) and polished through a multi-step abrasive 102
sequence with a final polishing step in a colloidal silica suspension. The oriented samples were divided 103
into small pieces with a surface area (SA) between ~ 0.25 cm2 and 0.50 cm². The faces not under study 104
were protected with room-temperature vulcanizing (RTV) glue. For the faces under investigation, only 105
a portion of their surface was protected with ~1 mm-diameter RTV glue spots to provide a reference 106
surface (see similar protocol in 19, 28). The initial roughness of each surface was measured at different 107
scales with a ZYGO® NewView 7300 vertical scanning interferometer (VSI). For each sample, the 108
initial average arithmetic roughness (Ra), defined as the arithmetic average of the absolute values of 109
the roughness measured by the VSI, ranged between 10 and 20 nm. These initial roughness parameters 110
were measured on 270 × 360 µm2 VSI images. 111
2.2 Growth experiments and analytical procedures
112
Barite samples were placed over polytetrafluoroethylene (PTFE) tripods and introduced into 120 113
mL perfluoroalkoxy alkanes (PFA) Savillex® reactors. The reactors were filled with a volume (V) of 114
100 mL of solution and continuously stirred with magnetic bars throughout the experiments, incubated 115
at 10, 25, 40, and 70 °C for durations ranging from 10 minutes to 15 hours. Three selected 116
crystallographic planes were studied: (210), (001), and (101). 117
7
All solutions were prepared immediately prior to each experiment by diluting 0.01 M BaCl2 and 118
Na2SO4 stock solutions prepared from sodium sulfate and barium chloride powders (Acros Brand, 119
purity ≥ 99%) to the desired concentrations. The in situ pH and ion speciation and activity were 120
calculated using the CHESS software29 implemented with the Debye–Hückel equation and Chess.tdb 121
database (Lawrence Livermore National Laboratories EQ3/6 database, 8th version), and the saturation 122
index (SI) with respect to barite was calculated from Eq. (1): 123
𝑆𝐼 = log𝑎 𝑎
𝐾 (1)
where aBa and aSO4 refer to the activities of barium and sulfate ions in solution, respectively, and Ksp
124
refers to the solubility product of barite. The CHESS software calculates the solubility product at the 125
run temperature based on the interpolation between the Ksp values listed in Chess.tdb database, i.e., 10
-126
10.49, 10-9.97, 10-9.61 and 10-9.51 at 0 °C, 25 °C, 60 °C and 100 °C, respectively. 127
The following input solutions containing 1:1 ratio of SO42− and Ba2+ activities were studied: (1) 128
SI = 1.1 and (2) SI = 2.1. Those saturation indices were chosen in order to compare the results of this
129
study with the growth rates obtained by Godinho and Stack19 at room temperature. 130
Experiment durations ranged between 10 minutes and 15 hours, depending on the experimental 131
conditions (SI and temperature). In order to calculate the evolution of the saturation index, solution 132
sampling was carried out two to four times in each experiment. The aqueous samples were diluted 10 133
times and filtered using a 0.45-µm filter before analysis. Inductively coupled plasma atomic emission 134
spectroscopy (ICP-AES - Thermo ICAP 6000) was used for the analyses of Ba2+ and Na+, and ion 135
chromatography (ICS-5000 Thermofisher Dionex) was used for the analyses of SO42- and Cl-. Because 136
foreign cations such as Sr can impact barite growth rates17, all input solutions were analyzed for major 137
(Na, K, Ca, Mg, Fe, Si, Al) and minor (Sr, Ni, Mn, Ti, Co, Cr, Zn, Cu) cations prior to the immersion 138
of the barite samples. The concentration of all of these elements was systematically below the detection 139
limit (≤ 5 ppb), except for Cu, for which concentrations up to 20 ppb (8×10⁻⁸ M) were occasionally 140
8
detected. The pH was also checked at the beginning and at the end of each experiment. The pH of all 141
solutions was 5.3 ± 0.1 and remained constant throughout the experiments. 142
At the end of each experiment, the sample was removed from the solution, rinsed with ultrapure 143
water and sonicated for 10 min in ethanol to remove any possible secondary barite crystals nucleated 144
from the solution and deposited on the surface, as classically done in literature to remove fine particles 145
adhering on the surface of minerals30. The RTV mask was then carefully removed and the sample 146
topography was measured with VSI in stitching mode (magnification: ×5) to evaluate average changes 147
in height between the unreacted reference surface and the reacted mineral surface. For each surface, 148
10 profiles across the interface were used to calculate the average thickness of the grown layer, which 149
was used to calculate the face-specific growth rate. The uncertainties associated with these average 150
values were estimated from the standard deviations calculated from the various profiles. For each 151
oriented sample, growth rates were calculated according to Eq. (2): 152
𝑟( ) = ∆ℎ
∆𝑡 (2)
where 𝑟( ) (nm.h-1) is the growth rate of the (hkl) face, Δh is the average surface step resulting from 153
barite growth (nm), and Δt is the duration of the experiment (s). 154
9
3. Results and discussion
156
3.1 Face-specific growth patterns
157 158
159 160
10
Figure 2. Barite growth features observed using scanning electron microscopy a) Face (001), SI = 2.1, T
161
= 25 °C; b) Face (001), SI = 2.1, T = 70 °C; c) Face (210), SI = 2.1, T = 25 °C; d) Face (210), SI = 2.1, T = 70
162
°C; e) Face (101), SI = 2.1, T = 25 °C; f) Face (101), SI = 2.1, T = 70 °C.
163 164
Both SEM and VSI investigations confirmed that, over the course of the experiments, barite 165
growth did not result from homogeneous nucleation in the solution, as revealed by the absence 166
of euhedral secondary barite crystals on the surface of each investigated face, or the subsistence 167
of polishing scratches in the grown layer of barite. The results show that the temperature 168
variation seems to have no effect on the growth features of the faces under study. Pina et al.31 169
described growth patterns which exhibit features specific to each investigated face (001) and 170
(210), consistent with the anisotropy of the barite structure and the Periodic Bond Chain (PBC) 171
theory. In the present study, the (001) and the (101) faces exhibit a growth morphology that 172
resembles the circular sector shape described during the early stage of barite growth monitored 173
using atomic force microscopy (AFM) by Sanchez-Pastor et al.32. Conversely, the two-174
dimensional islands formed in the experiments conducted at 25 and 70 ºC and a saturation index 175
of 2.1 could not be easily related to the needle-shaped morphology described by Pina et al.31 176
and Sanchez-Pastor et al.32 for the face (210). Possible explanations include the difference of 177
resolution between AFM and SEM, as well as the difference in terms of reaction progress, since 178
the study by Sanchez-Pastor et al.32 focused on the early stage of barite growth, whereas the 179
present study reports on results obtained at a later stage of the reaction process. Therefore, part 180
of the original islands documented in e.g. Sanchez-Pastor et al.32 might have been overgrown, 181
and no longer identifiable by SEM at such late stages of observation. 182
3.2 Face-specific growth rate of barite as a function of solution saturation state
183
3.2.1 Time-resolved fluid analyses 184
11 The evolution of the fluid composition during all experiments is provided in Table 1. 185
The Ba2+ to SO42- mole ratios in the aqueous solutions are consistent with the stoichiometric 186
precipitation of barite. From the Ba2+, Na+, SO42-, and Cl- concentrations, the saturation index 187
with respect to barite was determined at up to four different time steps in each experiment using 188
the CHESS code. 189
The extent to which the evolution of the fluid composition resulted from barite growth 190
of the oriented barite surface sample can be estimated based on the thickness of the grown layer 191
measured by VSI following: 192
∆[𝑖] = ∆ℎ. 𝑆𝐴. 𝜌
𝑀 . 𝑉 (3)
where ∆[i] is the variation of Ba2+ (or SO42-) concentration resulting from barite growth, ρ
BaSO4
193
and MBaSO4 are respectively the density (4.48 g.cm-3) and molar mass (233 g.mol-1) of barite.
194
Knowing that the surface area of each investigated sample never exceeded 0.5 cm², and using 195
150 nm as an upper bound for the thickness of the grown layer (consistent with our VSI 196
measurements), the decrease in sulfate or barite concentration should never exceed 1.5×10⁻⁶ M. 197
This value is about two orders of magnitude greater than the actual decrease measured in some 198
of our experiments (see Table 1), suggesting that in addition to barite growth, homogeneous 199
barite nucleation in the solution or heterogeneous nucleation on the walls of the reactor should 200
have occurred as well. This result is consistent with the observations reported by Jindra et al.33, 201
who showed that solutions supersaturated in barite with SI ≥ 1 were unstable with respect to 202
barite nucleation. This limitation illustrates that classical kinetics experiments based on the sole 203
evolution of the fluid composition would be poorly informative to deconvolve the nucleation 204
from the growth steps under such conditions, and further justifies the use of surface sensitive-205
techniques to probe growth kinetics, such as AFM15-17, 33 or VSI19. 206
The rapid nucleation of barite complicated the conduction of experiments at a fixed 207
value of SI, and the duration of the experiment had consequently to be adjusted to (i) yield an 208
12 appreciable thickness of the grown layer of barite while (ii) limiting the intrinsic evolution of 209
the solution composition resulting from barite nucleation. Importantly, for the experiments 210
conducted under the less reactive conditions (i.e., T = 10 °C, SI = 1.1), in spite of several 211
attempts, it has not been possible to run experiments for which the evolution of SI was modest 212
while measuring an appreciable thickness of the grown layer at the same time. In other words, 213
for these experiments, essentially barite nucleation occurred over short durations (with no 214
observable grown layer), while over long durations (up to 15 hours), barite growth was 215
observed, but with large variation of the fluid saturation index (between ± 18% and ± 34%), 216
complicating the definition of the SI at which growth actually occurred. Therefore, the results 217
of experiments conducted at SI = 1.1 and T = 10 °C will have to be considered with caution (see 218
Section 3.2.2 for a confirmation of this statement). In the end, the variation of SI was ± 6% for 219
the 12 experiments run at an initial saturation index of 2.1, and ± 5% for the 9 experiments run 220
at SI = 1.1 (excluding the 3 experiments run at 10 °C). 221
222
Table 1. Evolution of fluid composition (concentration of Ba2+, SO
42-, Cl-, and Na+ in mol/L) measured 223
by ICP-AES and ion chromatography for the growth experiments realized on the (001), (101), and (210) surfaces
224
at 10, 25, 40, and 70 ºC. The fluid composition was measured at up to four time steps in each experiment. The
225
saturation index of the experiments was determined from the fluid composition using the CHESS software.
226 227
13 SI=2.1 SI=1.1 10° C face 001 210 101 001 210 101 t 0 60 120 180 0 40 80 120 0 40 80 120 0 900 0 900 0 900 Ba2+ *108.41 -5 *107.14 -5 *106.69 -5 *104.56 -5 *107.72 -5 *106.61 -5 *105.61 -5 *105.01 -5 *107.68 -5 *106.42 -5 *106.51 -5 *105.78 -5 *104.46 -5 *102.44 -5 *103.51 -5 *102.31 -5 *103.94 -5 *102.56 -5 SO4 2-1.13 *10-4 *101.04 -4 *109.60 -5 *109.35 -5 *101.32 -4 *101.14 -4 *101.01 -4 *109.57 -5 *101.16 -4 *109.12 -5 *109.80 -5 *108.63 -5 *105.16 -5 *103.43 -5 *104.66 -5 *103.20 -5 *104.64 -5 *103.35 -5 Na+ *101.69 -4 *101.49 -4 *101.56 -4 *101.53 -4 *101.71 -4 *101.73 -4 *101.72 -4 *101.72 -4 *101.54 -4 *101.63 -4 *101.49 -4 *101.54 -4 *106.95 -5 *106.95 -5 *106.12 -5 *105.97 -5 *106.60 -5 *106.68 -5 Cl -1.99 *10-4 1.98 *10-4 2.00 *10-4 2.02 *10-4 2.17 *10-4 2.17 *10-4 2.12 *10-4 2.23 *10-4 1.97 *10-4 2.03 *10-4 1.95 *10-4 2.03 *10-4 1.14 *10-4 1.12 *10-4 9.57 *10-5 9.89 *10-5 1.08 *10-4 1.06 *10-4 SI 2.12 2.04 1.96 1.86 2.15 2.02 1.81 1.83 2.08 1.90 2.00 1.85 1.54 1.01 1.39 1.06 1.44 1.12 25° C t 0 40 80 120 0 20 40 60 0 30 60 90 0 140 280 420 0 60 180 300 0 140 280 420 Ba2+ *108.74 -5 *109.45 -5 *109.21 -5 *109.35 -5 *101.16 -4 *101.17 -4 *101.08 -4 *101.06 -4 *109.50 -5 *101.01 -4 *107.62 -5 *107.31 -5 *103.42 -5 *103.41 -5 *103.19 -5 *103.20 -5 *103.28 -5 *103.37 -5 *103.30 -5 *103.27 -5 *104.53 -5 *103.56 -5 *104.32 -5 *104.15 -5 SO4 2-1.25 *10-4 *101.15 -4 *101.05 -4 *109.81 -5 *101.65 -4 *101.57 -4 *101.52 -4 *101.49 -4 *101.79 -4 *101.58 -4 *101.37 -4 *101.25 -4 *104.92 -5 *104.55 -5 *104.50 -5 *104.49 -5 *103.54 -5 *103.54 -5 *103.63 -5 *103.56 -5 *105.72 -5 *105.71 -5 *105.70 -5 *105.68 -5 Na+ *101.95 -4 *101.79 -4 *101.76 -4 *101.90 -4 *101.79 -4 *101.91 -4 *101.83 -4 *101.89 -4 *101.99 -4 *101.99 -4 *102.21 -4 *101.89 -4 *107.42 -5 *107.52 -5 *107.39 -5 *107.39 -5 *106.94 -5 *107.11 -5 *107.22 -5 *107.09 -5 *108.55 -5 *108.61 -5 *108.55 -5 *108.43 -5 Cl- *102.50 -4 *102.52 -4 *102.54 -4 *102.54 -4 *103.12 -4 *102.94 -4 *102.95 -4 *103.01 -4 *103.29 -4 *103.09 -4 *103.03 -4 *103.01 -4 *109.18 -5 *109.22 -5 *109.01 -5 *108.95 -5 *105.55 -5 *105.86 -5 *105.36 -5 *105.33 -5 *101.04 -4 *101.03 -4 *101.04 -4 *101.04 -4 SI 1.90 1.9 1.88 1.83 2.13 2.11 2.06 2.05 2.07 2.05 1.89 1.82 1.13 1.1 1.06 1.06 0.98 0.99 0.99 0.98 1.32 1.22 1.3 1.22 40° C t 0 30 60 90 0 20 40 60 0 15 30 60 0 130 260 500 0 80 160 200 0 80 160 200 Ba2+ 1.25 *10-4 1.26 *10-4 9.70 *10-5 8.57 *10-5 1.32 *10-4 1.21 *10-4 9.08 *10-5 9.73 *10-5 1.67 *10-4 7.41 *10-5 8.13 *10-5 4.27 *10-5 4.24 *10-5 4.38 *10-5 4.35 *10-5 4.50 *10-5 4.48 *10-5 3.88 *10-5 4.44 *10-5 4.22 *10-5 3.93 *10-5 4.05 *10-5 4.12 *10-5 SO4 2-1.93 *10-4 *101.76 -4 *101.53 -4 *101.31 -4 *102.02 -4 *101.86 -4 *101.74 -4 *101.61 -4 *102.09 -4 *101.21 -4 *101.14 -4 *105.63 -5 *105.44 -5 *105.33 -5 *105.36 -5 *104.74 -5 *104.28 -5 *104.40 -5 *104.31 -5 *104.58 -5 *104.99 -5 *104.89 -5 *105.07 -5 Na+ *102.17 -4 *102.14 -4 *102.17 -4 *102.07 -4 *102.34 -4 *102.11 -4 *102.36 -4 *102.23 -4 *102.78 -4 *102.76 -4 *102.72 -4 *108.52 -5 *108.42 -5 *108.38 -5 *108.38 -5 *101.09 -4 *108.91 -5 *109.10 -5 *109.01 -5 *108.64 -5 *109.11 -5 *109.52 -5 *109.36 -5 Cl- *103.61 -4 *103.60 -4 *103.63 -4 *103.92 -4 *103.55 -4 *103.47 -4 *103.56 -4 *103.55 -4 *104.37 -4 *104.35 -4 *104.34 -4 *101.07 -4 *101.05 -4 *101.04 -4 *101.04 -4 *107.36 -5 *107.43 -5 *107.12 -5 *107.49 -5 *108.24 -5 *108.96 -5 *107.40 -5 *107.31 -5 SI 2.02 1.99 1.87 1.7 2.06 1.99 1.84 1.84 2.17 1.6 1.62 1.08 1.07 1.07 1.07 1.04 1.00 0.95 0.99 1.00 1.00 1.01 1.03 70° C t 0 5 10 0 5 10 0 5 10 0 60 120 0 60 120 180 0 40 80 120 Ba2+ *101.91 -4 *101.86 -4 *101.38 -4 *101.86 -4 *101.63 -4 *101.37 -4 *101.95 -4 *101.56 -4 *101.25 -4 *106.32 -5 *104.88 -5 *103.71 -5 *106.04 -5 *105.68 -5 *105.09 -5 *104.64 -5 *106.32 -5 *103.95 -5 *105.74 -5 *105.81 -5 SO4 2-2.00 *10-4 *101.88 -4 1.47 *10 *102.21 -4 *101.95 -4 *101.78 -4 *102.73 -4 *102.08 -4 *101.64 -4 *109.83 -5 *108.00 -5 *107.67 -5 *109.26 -5 *108.65 -5 *108.24 -5 *107.39 -5 *106.74 -5 *106.78 -5 *106.74 -5 *106.53 -5 Na+ *103.97 -4 *104.00 -4 *104.02 -4 *104.07 -4 *104.10 -4 *105.1 -4 *104.07 -4 *103.73 -4 *103.73 -4 *101.84 -4 *101.71 -4 *101.83 -4 *109.84 -5 *101.07 -4 *101.09 -4 *109.90 -5 *101.33 -4 *101.38 -4 *101.34 -4 *101.34 -4 Cl- *104.20 -4 *104.06 -4 *104.10 -4 *103.96 -4 *103.95 -4 *104.95 -4 *105.81 -4 *105.80 -4 *105.97 -4 *101.88 -4 *101.95 -4 *101.98 -4 *101.36 -4 *101.37 -4 *101.41 -4 *101.34 -4 *101.19 -4 *101.16 -4 *101.16 -4 *101.17 -4 SI 2.00 1.97 1.74 2.03 1.93 1.81 2.1 1.7 1.25 1.14 0.92 1.21 1.16 1.1 1.0 1.11 0.91 1.07 1.06 228
14 3.2.2 Vertical Scanning Interferometry data:
229
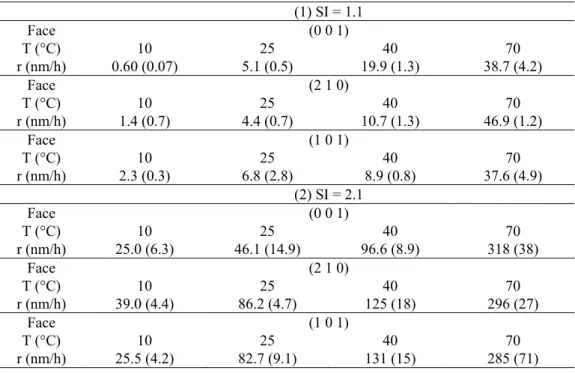
Table 2. Face-specific growth rates (nm.h−1) calculated from the thickness of the grown layer measured by VSI on the 230
(001), (101), and (210) surfaces of crystals grown in two different solutions: (1) SI = 1.1 and (2) SI = 2.1. Experiments
231
were performed at 10, 25, 40, and 70 °C. The numbers between parentheses indicate the uncertainties of the growth rates,
232
estimated from the variability of the thickness of the grown layer averaged on 10 measurements (see Section 2.2).
233 (1) SI = 1.1 Face (0 0 1) T (°C) 10 25 40 70 r (nm/h) 0.60 (0.07) 5.1 (0.5) 19.9 (1.3) 38.7 (4.2) Face (2 1 0) T (°C) 10 25 40 70 r (nm/h) 1.4 (0.7) 4.4 (0.7) 10.7 (1.3) 46.9 (1.2) Face (1 0 1) T (°C) 10 25 40 70 r (nm/h) 2.3 (0.3) 6.8 (2.8) 8.9 (0.8) 37.6 (4.9) (2) SI = 2.1 Face (0 0 1) T (°C) 10 25 40 70 r (nm/h) 25.0 (6.3) 46.1 (14.9) 96.6 (8.9) 318 (38) Face (2 1 0) T (°C) 10 25 40 70 r (nm/h) 39.0 (4.4) 86.2 (4.7) 125 (18) 296 (27) Face (1 0 1) T (°C) 10 25 40 70 r (nm/h) 25.5 (4.2) 82.7 (9.1) 131 (15) 285 (71) 234
The growth rates perpendicular to the three studied surfaces were calculated from the measured 235
thickness of the layer grown whilst in solution. The results highlight an effect of the saturation index 236
on growth rate. For example, in the experiments with a starting saturation index of 2.1, the growth 237
rates are about 5 to 40 times faster (depending on the face and temperature) than in the solution with 238
SI = 1.1 (Table 1).
239
Surface-controlled precipitation rates are commonly fitted to the following rate law (e.g. 34 and 240
references therein): 241
𝑟 = 𝑘. (10 − 1) (4)
where k is the growth rate constant and n is a fitting coefficient generally referred to as the reaction 242
order. Although Eq. (4) essentially remains empirical, the value of the reaction order is usually 243
attributed to the rate-controlling reaction mechanism (a reaction order of 1 is typically attributed to a 244
15 simple surface adsorption mechanism and a reaction order of 2 to spiral growth; see 35). For each face, 245
the value of the reaction order at each temperature (nT) can therefore be estimated following:
246
𝑛 = log 𝑟 − log 𝑟
log 10 − 1 − log 10 − 1 (5)
where 𝑟 refers to the growth rate measured at the corresponding saturation index 𝑆𝐼 (i.e., ~2.1 or 247
~1.1), for a given temperature T. Eq. (5) was used to estimate the value of n for each face and all 248
investigated temperatures (Table 3), leading to average values of n = 1.39 ± 0.76, 1.26 ± 0.42, and 1.12 249
± 0.19 for the (001), (210), and (101) faces, respectively. Of note, the large standard deviations 250
associated with the value of n for the (001) and (210) faces are essentially due to the value of n derived 251
for these faces at 10 °C (n = 2.50 and 1.88, respectively). The large uncertainties associated with the 252
estimation of slow growth rates at low temperature and saturation index may partially contribute to 253
this observation, as emphasized above (Section 3.2.1). In particular, the large variation of SI over the 254
duration of these experiments, which result from the fact that barite precipitation occurred almost 255
exclusively through homogeneous nucleation, considerably complicated the definition of the value of 256
SI at which barite growth occurred. Therefore, the uncertainties associated with these experiments and
257
the switch in barite precipitation mechanism at low temperature justifies the need to remove the rate 258
data collected at 10 °C and SI = 1.1 for further processing of the dataset . If these rates are discarded 259
from the dataset, the average values then become n = 1.02 ± 0.19; 1.05 ± 0.07 and 1.11 ± 0.13 for the 260
(001), (210) and (101) faces, respectively. Therefore, with the noticeable exception of rate data 261
obtained at 10 °C, our results show that a simple linear relation between r and (10SI – 1) can account
262
for our observations for all faces, irrespective of the temperature (see Supporting Information for a 263
plot displaying the general agreement over the whole dataset). Therefore, this study extends the similar 264
conclusion previously reached by Zhen-Wu et al. 12 from powder experiments to a broader range of 265
temperatures and saturation indices, while suggesting that the reaction order (n) does not depend on 266
the investigated face, at least for temperatures ranging from 25 °C to 70 °C. This result is also 267
16 consistent with the second order reaction with respect to Ba concentration reported by Christy and 268
Putnis18, since a first order reaction with respect to barite saturation state is equivalent to a second 269
order reaction with respect to either aqueous barium or aqueous sulfate concentration, as recalled by 270
Zhen-Wu et al.12. 271
272
Table 3. Estimation of the reaction order (n) of barite growth kinetics for all investigated faces and temperatures
273
following Eq. (5). Note that the values in italic were not considered for the calculation of the mean value of n for each
274
face. See text for details.
275 10 °C 25 °C 40 °C 70 °C (0 0 1) 2.50 1.16 0.80 1.10 (2 1 0) 1.88 1.11 1.06 0.97 (1 0 1) 1.14 1.37 1.04 0.92 276
3.3 Face-specific growth rate of barite as a function of temperature
277
In experiments conducted with an input solution with SI = 1.1, growth rates range from 0.60 278
nm.h-1 to approximately 47 nm.h-1, with the slowest rates at 10ºC and the fastest rates at 70 ºC (Table 279
1). For each face, the growth rate increases with temperature but generally, the (001) and (101) faces 280
are the slowest growing faces (Table 1), in accordance with the results obtained by Godinho and 281
Stack19. For face (001) reacted in a solution with SI = 1.1, an increase in temperature by 60 ºC increases 282
the rate by almost a factor of 60 (Table 1). At a starting saturation index of 2.1, the growth rates are 283
about one order of magnitude greater at 70 °C than at 10 °C for all faces. 284
The dependence of the mineral growth rate constant on temperature is usually described 285
following the Arrhenius equation: 286
𝑘 = 𝐴. exp(−𝐸 𝑅𝑇⁄ ) (6)
where A represents the Arrhenius pre-exponential factor, Ea denotes the activation energy, R is the gas
287
constant, and T refers to the absolute temperature. By combining Eq. (6) with Eq. (4) and assuming 288
that n = 1 (see above), we can determine the value of A and Ea experimentally following the relation:
17
ln(𝑟 (10 − 1)⁄ ) = ln 𝐴 −𝐸 𝑅𝑇⁄ (7)
This equation was applied to the data generated in this study using the Arrhenius plots shown in Fig. 290
3. The errors reported on the data points account both for the uncertainties on the growth rates 291
(resulting from the variability of the thickness of the grown layer) and the variation of SI over the 292
course of the experiment (resulting from the precipitation of barite). Excluding the rate data obtained 293
at 10 °C and SI = 1.1 (see above), the activation energy was found to be virtually independent of the 294
considered face, with values of 36.4 ± 4.0, 31.8 ± 3.3, and 35.8 ± 3.7 kJ.mol-1 for the growth on (001), 295
(210), and (101) faces, respectively. The uncertainties on the activation energies were determined 296
based on the errors associated with the data depicted in Fig. 3. 297
The activation energy determined for the growth on the (001) face is in excellent agreement 298
with that determined by Higgins et al.36 (37.3 ± 4.6 kJ.mol-1). More broadly, these values agree, within 299
uncertainties, with those reported by Christy and Putnis18 (22.0 ± 14.3 kJ.mol-1) for the growth of barite 300
monitored on powder experiments over the temperature range 44-85 °C. This result further indicates 301
that if a barite crystal form is developed based on the three faces investigated in the present study, the 302
morphology of barite crystals will be negligibly affected by temperature variations, such that the 303
morphology of barite crystals cannot be used as a criterion to determine the temperature at which they 304
crystallized. 305
Regarding the pre-exponential factor, Fig. 3 reveals that it only slightly varies with the 306
considered orientation, from exp(12.4) nm.h-1 for the (210) face to exp(14.1) nm.h-1 for the (001) face. 307
Following the reasonable assumption that the activation energy does not depend on the 308
crystallographic orientation for the three investigated faces, this translates into a modest anisotropy of 309
barite growth rate of a ~5-fold factor between the fastest and slowest growing faces, which is in 310
reasonable agreement with our experimental data. 311
18 312
Figure 3. Determination of the face-specific activation energy (Ea(hkl)) and pre-exponential factor (A(hkl)) of barite growth
313
rate over the temperature range 10-70 °C for the (a) (001), (b) (210), and (c) (101) faces. Of note, the rate data obtained
314
at 10 °C and SI = 1.1 for the faces (001) and (210) were dismissed from the regressions (see section 3.3 for details).
315 316
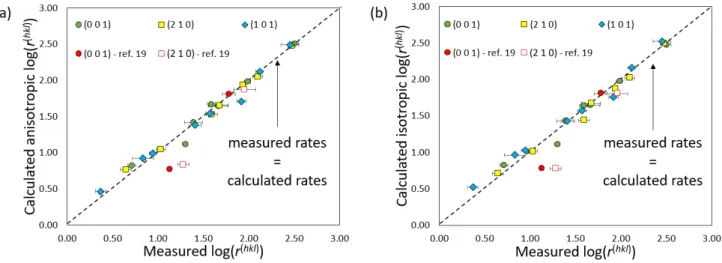
The agreement between the multiple regressions described above and the experimental data 317
can be assessed in Fig. 4, for growth rates varying over about two orders of magnitude. In Fig. 4a, the 318
measured rates were compared with the corresponding values calculated following the overall face-319
specific growth rate law given by: 320
𝑟( ) = 𝐴( ). exp −𝐸( )⁄𝑅𝑇 . (10 − 1) (8a)
for which the values of A(hkl) and Ea(hkl) were derived from the plots depicted in Fig. 3. Of note, the 321
agreement between calculated rates and measured rate data is negligibly affected if one considers an 322
overall isotropic growth rate law for all faces following: 323
𝑟( ) = 𝐴. exp(−𝐸 𝑅𝑇⁄ ). (10 − 1) (8b)
with average values of A = exp (13.59) nm.h-1 and E
a = 35.0 ± 2.5 kJ.mol-1 (Fig. 4b). In addition, both
324
rate laws perfectly account for the rate data reported by Godinho and Stack19 at T = 22.2 °C and SI = 325
2.1 for the faces (001) and (210), while overestimating the rate values obtained at SI = 1.1. Possible 326
explanations might reside in the difference in chemical composition of the crystals used to conduct the 327
studies, since impurities such as strontium are known to decrease barite growth rates at low 328
concentrations17. 329
19 330
331
Figure 4. Comparison of barite growth rates calculated using (a) Eq. (8a) or (b) Eq. (8b) with those measured in the
332
present study or reported in Godinho and Stack19. 333
334
3.4 Comparison with previously published data and mechanistic insights
335
Overall, this study largely confirms both the measurements of face-specific barite growth rates 336
and the reaction mechanisms reported in previous studies. 337
Regarding the anisotropy of barite growth, Godinho and Stack19 reported that the reactivity of 338
the (210) face was about 1.5 times greater than that of the (001) face at ambient temperature and for 339
SI conditions ranging from 1.1 to 2.1. These values are in excellent agreement with our measurements
340
under the same conditions, which show that the reactivity of the (210) face is approximately between 341
1.7 and 1.9 times greater than that of the (001) face. At SI = 2.1, the absolute values of the growth rates 342
of the two studies overlap as well, within uncertainties. 343
Regarding the reaction mechanisms, several lines of evidence suggest that barite growth may 344
observe the principle of detailed balancing and micro-reversibility. First, our rate data are consistent 345
with an isotropic activation energy with an average value of 35.0 ± 2.5 kJ.mol-1, suggesting that the 346
reaction is surface-controlled. Moreover, if the rate-limiting step of barite growth were to change with 347
surface orientation, then the activation energies of barite growth rate would be face-specific. Therefore, 348
20 and even though the activation energies estimated in the present study remain essentially apparent, the 349
unicity of the activation energy is compatible with the suggestion that the same elementary step is rate-350
limiting for all faces. In addition, this value is consistent with the isotropic value reported by Christy 351
and Putnis18 (22.0 ± 14.3 kJ.mol-1), itself very similar to the activation energy of barite dissolution 352
reported by Zhen-Wu et al.12 (25 ± 2 kJ.mol-1). Second, the growth rate was found to be a linear 353
function of the saturation state of the solution (i.e., r ∝ 10SI) for all faces at temperatures ranging
354
between 25 and 70 °C (this statement remains questionable at lower temperatures). This result is 355
consistent with previously published studies12, 18 and is typical of adsorption-controlled growth 356
processes35, for which the concept of micro-reversibility necessarily applies. 357
358
3.5 Implications for natural and anthropogenic systems
359
As highlighted above, a growing number of studies have emphasized the need to go beyond the 360
classical development of isotropic rate laws to model the dissolution and/or the growth kinetics of 361
minerals, partly because of their anisotropic reactivity. Notwithstanding, switching to more complex 362
rate laws that are not implemented so far in classical reactive transport codes has to be justified through 363
quantitative measurements of this anisotropy, as well as its dependence to fundamental rate-controlling 364
parameters such as temperature or solution saturation state, in order to assess the extent to which 365
isotropic models fail to reproduce quantitatively the actual mineral reactivity. In that respect, our 366
results underline that (i) the anisotropic reactivity of barite growth remains modest, at least for the 367
three studied faces and (ii) the growth activation energy is similar for all faces and possibly equivalent 368
to the dissolution activation energy. These results have at least two practical implications for natural 369
and anthropogenic systems: 370
(i) Regarding the reaction mechanisms, our study suggests that the principle of detailed 371
balancing may be respected over the range of T and SI investigated in the present study (see section 372
3.4). Because the dissolution and precipitation rates of barite are relatively rapid, this result implies 373
21 that at ambient temperature and close-to-equilibrium conditions, the isotope composition of barium 374
may be quickly reset, consistent with the results of Curti et al.8. Because the isotopic and elemental 375
compositions of barite are used as a proxy for past seawater chemistry (12 and references therein), our 376
study contributes to the general warning regarding the preservation of isotopic signatures in minerals 377
over geological timescales to trace paleoenvironmental conditions37-40. 378
(ii) Regarding geothermal systems, a viable geothermal resource requires a reservoir with a 379
high permeability, often provided by fractures (e.g., 41), to provide the flow rates required for efficient 380
energy production. The hydrothermal brines circulating through these reservoirs typically contain a 381
rich assortment of dissolved elements (e.g., 41-44) that can precipitate in surface installations and within 382
permeability-enhancing fractures within the reservoir as a result of, for example, changes in 383
temperature (e.g., 2). Barite scaling can play havoc at geothermal surface installations, requiring time-384
consuming and expensive mechanical removal (e.g., 18), and can dramatically reduce the permeability 385
of fractures within the reservoir. For example, Griffiths et al.2 highlighted that the Buntsandstein unit, 386
a ~400 m-thick unit of sandstone that directly overlies the granitic reservoir at geothermal sites 387
throughout the Upper Rhine Graben (e.g., 45-47), contains abundant barite-filled fractures (e.g., Fig. 1). 388
Additionally, Griffiths et al.2 estimated the time needed to seal a 2 mm-wide fracture with barite to be 389
on the order of about a month. These calculations, however, were performed using data collected on 390
powdered barite samples18. Our new face-specific data show that the activation energy is, within 391
uncertainty, the same for all of the studied crystal faces. These new data provide additional confidence 392
in the barite growth timescales provided in Griffiths et al.2, which suggest that the permeability of the 393
geothermal reservoir adjacent to the injection well could be, unless preventative measures are taken, 394
greatly reduced over short timescales during production. 395
396 397
22
4. Summary and conclusions
398
Barite growth experiments combined with vertical scanning interferometry measurements of 399
the surface topography have been conducted to study the effect of the saturation index (SI) and the 400
temperature on the growth rates and surface features of the (001), (210), and (101) faces of barite. The 401
results confirmed that barite growth is anisotropic with a rate that is promoted by elevated saturation 402
indices and temperatures, while the growth morphologies observed by scanning electron microscopy 403
did not significantly vary with temperature or SI. It was determined that barite growth rate observes a 404
first order reaction with respect to barite saturation state for all faces at all temperatures, with the 405
exception of rate data obtained at 10 °C. Therefore, our results show that a simple linear relation 406
between 𝑟 and (10SI – 1) can account for barite growth. From the dependence of the rate of barite
407
growth with temperature, the activation energy could be defined for each face using the Arrhenius 408
equation, yielding an average value of 35.0 ± 2.5 kJ.mol-1, with no significant difference between the 409
three faces. This result indicates that the morphology of barite crystals will be negligibly affected by 410
temperature variations for a crystal composed of the faces under study. Therefore, the morphology of 411
barite crystals cannot be used as a criterion to determine the temperature at which they crystallized. 412
These data are also compatible with a reaction rate is surface-controlled, with the same rate-limiting 413
step for all faces. The pre-exponential factor in the Arrhenius equation slightly varies with the 414
considered orientation, from exp(12.4) nm.h-1 for the (210) face to exp(14.1) nm.h-1 for the (001) face, 415
which represents a modest anisotropy of barite growth rate. Taken together, this study largely confirms 416
both the measurements of face-specific barite growth rates and the reaction mechanisms reported in 417
previous studies, and may contribute to improve modeling of barite growth rates in natural and 418
anthropogenic systems. 419
23
Acknowledgements
421
This study was partly funded by LABEX grant ANR-11-LABX-0050_G-EAU-THERMIE-422
PROFONDE (this research therefore benefited from state funding managed by the Agence National 423
de la Recherche (ANR) as part of the “Investissements d'avenir” program) and ANR grant CANTARE 424
(ANR-15-CE06-0014-01). The authors are grateful to the National Scientific and Technical Research 425
Council (CONICET) PIP2011-0392 which provided a post-doctoral grant. We also acknowledge the 426
Mincyt-ECOS project for supporting international collaboration between the ICGyC/IIMyC in 427
Argentina and the LHyGeS in France. Colin Fourtet and René Boutin (LHyGeS) are warmly thanked 428
for their help with IC and ICP-AES measurements. Finally, we are grateful for the careful reviews and 429
detailed suggestions made by two anonymous reviewers, which significantly improved an earlier 430
version of the present paper. 431
432
Supporting information
433
Additional data processing and graph illustrating the linear relation between barite growth rates and 434
the saturation state of the solution. 435
436
References
437 438
(1) Bozau, E.; Häußler, S.; van Berk, W. Hydrogeochemical modelling of corrosion effects and 439
barite scaling in deep geothermal wells of the North German Basin using PHREEQC and PHAST. 440
Geothermics 2015, 53, 540-547.
441
(2) Griffiths, L.; Heap, M. J.; Wang, F.; Daval, D.; Gilg, H. A.; Baud, P.; Schmittbuhl, J.; Genter, 442
A. Geothermal implications for fracture-filling hydrothermal precipitation. Geothermics 2016, 64, 443
235-245. 444
(3) Ruiz-Agudo, C.; Putnis, C. V.; Putnis, A. The effect of a copolymer inhibitor on baryte 445
precipitation. Mineral. Mag. 2014, 78, 1423-1430. 446
24 (4) Ruiz-Agudo, C.; Ruiz-Agudo, E.; Putnis, C. V.; Putnis, A. Mechanistic Principles of Barite 447
Formation: From Nanoparticles to Micron-Sized Crystals. Cryst. Growth Des. 2015, 15, 3724-3733. 448
(5) Gérard, A.; Kappelmeyer, O. The Soultz-sous-Forêts project. Geothermics 1987, 16, 393-399. 449
(6) Baria, R.; Baumgärtner, J.; Gérard, A.; Jung, R.; Garnish, J. European HDR research 450
programme at Soultz-sous-Forêts (France) 1987–1996. Geothermics 1999, 28, 655-669. 451
(7) Gérard, A.; Genter, A.; Kohl, T.; Lutz, P.; Rose, P. The deep EGS (enhanced geothermal 452
system) project at Soultz-sous-Forêts (Alsace, France). Geothermics 2006, 35, 473-483. 453
(8) Curti, E.; Fujiwara, K.; Iijima, K.; Tits, J.; Cuesta, C.; Kitamura, A.; Glaus, M. A.; Müller, W. 454
Radium uptake during barite recrystallization at 23±2°C as a function of solution composition: An 455
experimental 133Ba and 226Ra tracer study. Geochim. Cosmochim. Acta 2010, 74, 3553-3570. 456
(9) Rosenberg, Y. O.; Sadeh, Y.; Metz, V.; Pina, C. M.; Ganor, J. Nucleation and growth kinetics 457
of RaxBa1− xSO4 solid solution in NaCl aqueous solutions. Geochim. Cosmochim. Acta 2014, 125, 458
290-307. 459
(10) Klinkenberg, M.; Brandt, F.; Breuer, U.; Bosbach, D. Uptake of Ra during the recrystallization 460
of barite: a microscopic and time of flight-secondary ion mass spectrometry study. Environ. Sci. 461
Technol. 2014, 48, 6620-6627.
462
(11) Brandt, F.; Curti, E.; Klinkenberg, M.; Rozov, K.; Bosbach, D. Replacement of barite by a (Ba, 463
Ra) SO4 solid solution at close-to-equilibrium conditions: A combined experimental and theoretical 464
study. Geochim. Cosmochim. Acta 2015, 155, 1-15. 465
(12) Zhen-Wu, B. Y.; Dideriksen, K.; Olsson, J.; Raahauge, P. J.; Stipp, S. L. S.; Oelkers, E. H. 466
Experimental determination of barite dissolution and precipitation rates as a function of temperature 467
and aqueous fluid composition. Geochim. Cosmochim. Acta 2016, 194, 193-210. 468
(13) Gonzalez-Muñoz, M.; Martinez-Ruiz, F.; Morcillo, F.; Martin-Ramos, J.; Paytan, A. 469
Precipitation of barite by marine bacteria: a possible mechanism for marine barite formation. Geology 470
2012, 40, 675-678.
471
(14) McGrail, B. P.; Schaef, H. T.; Spane, F. A.; Cliff, J. B.; Qafoku, O.; Horner, J. A.; Thompson, 472
C. J.; Owen, A. T.; Sullivan, C. E. Field Validation of Supercritical CO2 Reactivity with Basalts. 473
Environ. Sci. Technol. Lett. 2017, 4, 6-10.
474
(15) Kuwahara, Y.; Liu, W.; Makio, M.; Otsuka, K. In Situ AFM Study of Crystal Growth on a 475
Barite (001) Surface in BaSO4 Solutions at 30° C. Minerals 2016, 6, 117. 476
(16) Bracco, J. N.; Gooijer, Y.; Higgins, S. R. Hydrothermal atomic force microscopy observations 477
of barite step growth rates as a function of the aqueous barium-to-sulfate ratio. Geochim. Cosmochim. 478
Acta 2016, 183, 1-13.
479
(17) Weber, J.; Bracco, J. N.; Poplawsky, J. D.; Ievlev, A. V.; More, K. L.; Lorenz, M.; Bertagni, 480
A. L.; Jindra, S. A.; Starchenko, V.; Higgins, S. R.; Stack, A. G. Unraveling the Effects of Strontium 481
Incorporation on Barite Growth—In Situ and Ex Situ Observations Using Multiscale Chemical 482
Imaging. Cryst. Growth Des. 2018, 18, 5521-5533. 483
(18) Christy, A. G.; Putnis, A. The kinetics of barite dissolution and precipitation in water and 484
sodium chloride brines at 44–85°C. Geochim. Cosmochim. Acta 1993, 57, 2161-2168. 485
(19) Godinho, J. R. A.; Stack, A. G. Growth Kinetics and Morphology of Barite Crystals Derived 486
from Face-Specific Growth Rates. Cryst. Growth Des. 2015, 15, 2064-2071. 487
(20) Daval, D.; Hellmann, R.; Saldi, G. D.; Wirth, R.; Knauss, K. G. Linking nm-scale 488
measurements of the anisotropy of silicate surface reactivity to macroscopic dissolution rate laws: New 489
insights based on diopside. Geochim. Cosmochim. Acta 2013, 107, 121-134. 490
(21) Godinho, J. R.; Piazolo, S.; Evans, L. Simulation of surface dynamics during dissolution as a 491
function of the surface orientation: Implications for non-constant dissolution rates. Earth Planet. Sci. 492
Lett. 2014, 408, 163-170.
493
(22) Pollet-Villard, M.; Daval, D.; Ackerer, P.; Saldi, G. D.; Wild, B.; Knauss, K. G.; Fritz, B. Does 494
crystallographic anisotropy prevent the conventional treatment of aqueous mineral reactivity? A case 495
study based on K-feldspar dissolution kinetics. Geochim. Cosmochim. Acta 2016, 190, 294-308. 496
25 (23) Briese, L.; Arvidson, R. S.; Luttge, A. The effect of crystal size variation on the rate of 497
dissolution – A kinetic Monte Carlo study. Geochim. Cosmochim. Acta 2017, 212, 167-175. 498
(24) Robin, V.; Wild, B.; Daval, D.; Pollet-Villard, M.; Nonat, A.; Nicoleau, L. Experimental study 499
and numerical simulation of the dissolution anisotropy of tricalcium silicate. Chem. Geol. 2018, 497, 500
64-73. 501
(25) Montes-Hernandez, G.; Fernandez-Martinez, A.; Charlet, L.; Renard, F.; Scheinost, A. C.; 502
Bueno, M. Synthesis of a Se-0/calcite composite using hydrothermal carbonation of Ca(OH)(2) 503
coupled to a complex selenocystine fragmentation. Cryst. Growth Des. 2008, 8, 2497-2504. 504
(26) Benzerara, K.; Menguy, N. Looking for traces of life in minerals. CR Palevol 2009, 8, 617-505
628. 506
(27) Guisbiers, G.; José-Yacaman, M. Use of chemical functionalities to control stability of 507
nanoparticles. Reference Module in Chemistry, Molecular Sciences and Chemical Engineering 2017. 508
(28) Wild, B.; Daval, D.; Guyot, F.; Knauss, K. G.; Pollet-Villard, M.; Imfeld, G. pH-dependent 509
control of feldspar dissolution rate by altered surface layers. Chem. Geol. 2016, 442, 148-159. 510
(29) van der Lee, J.; De Windt, L., CHESS Tutorial and Cookbook. Updated for version 3.0. ed.; 511
Paris, 2002; Vol. Manual Nr. LHM/RD/02/13, p 116. 512
(30) Schott, J.; Berner, R. A.; Lennart Sjöberg, E. Mechanism of pyroxene and amphibole 513
weathering--I. Experimental studies of iron-free minerals. Geochim. Cosmochim. Acta 1981, 45, 2123-514
2135. 515
(31) Pina, C. M.; Becker, U.; Risthaus, P.; Bosbach, D.; Putnis, A. Molecular-scale mechanisms of 516
crystal growth in barite. Nature 1998, 395, 483-486. 517
(32) Sánchez-Pastor, N.; Pina, C. M.; Fernández-Díaz, L.; Astilleros, J. M. The effect of CO32- on 518
the growth of barite {0 0 1} and {2 1 0} surfaces: An AFM study. Surf. Sci. 2006, 600, 1369-1381. 519
(33) Jindra, S. A.; Bertagni, A. L.; Bracco, J. N.; Higgins, S. R. Hydrothermal Atomic Force 520
Microscopy Investigation of Barite Growth: Role of Spectator Ions in Elementary Step Edge Growth 521
Kinetics and Hillock Morphology. Cryst. Growth Des. 2017, 17, 6085-6095. 522
(34) Lopez, O.; Zuddas, P.; Faivre, D. The influence of temperature and seawater composition on 523
calcite crystal growth mechanisms and kinetics: Implications for Mg incorporation in calcite lattice. 524
Geochim. Cosmochim. Acta 2009, 73, 337-347.
525
(35) Shiraki, R.; Brantley, S. L. Kinetics of near-equilibrium calcite precipitation at 100°C: An 526
evaluation of elementary reaction-based and affinity-based rate laws. Geochim. Cosmochim. Acta 527
1995, 59, 1457-1471.
528
(36) Higgins, S. R.; Bosbach, D.; Eggleston, C. M.; Knauss, K. G. Kink Dynamics and Step Growth 529
on Barium Sulfate (001): A Hydrothermal Scanning Probe Microscopy Study. J. Phys. Chem. B 2000, 530
104, 6978-6982. 531
(37) Critelli, T.; Marini, L.; Schott, J.; Mavromatis, V.; Apollaro, C.; Rinder, T.; De Rosa, R.; 532
Oelkers, E. Dissolution rate of antigorite from a whole-rock experimental study of serpentinite 533
dissolution from 2< pH< 9 at 25 C: Implications for carbon mitigation via enhanced serpentinite 534
weathering. Appl. Geochem. 2015, 61, 259-271. 535
(38) Bernard, S.; Daval, D.; Ackerer, P.; Pont, S.; Meibom, A. Burial-induced oxygen-isotope re-536
equilibration of fossil foraminifera explains ocean paleotemperature paradoxes. Nat. Commun. 2017, 537
8, 1134.
538
(39) Chanda, P.; Gorski, C. A.; Oakes, R. L.; Fantle, M. S. Low temperature stable mineral 539
recrystallization of foraminiferal tests and implications for the fidelity of geochemical proxies. Earth 540
Planet. Sci. Lett. 2019, 506, 428-440.
541
(40) Oelkers, E. H.; Pogge von Strandmann, P. A. E.; Mavromatis, V. The rapid resetting of the Ca 542
isotopic signatures of calcite at ambient temperature during its congruent dissolution, precipitation, 543
and at equilibrium. Chem. Geol. 2019, 512, 1-10. 544
26 (41) Kushnir, A. R.; Heap, M. J.; Baud, P. Assessing the role of fractures on the permeability of the 545
Permo-Triassic sandstones at the Soultz-sous-Forêts (France) geothermal site. Geothermics 2018, 74, 546
181-189. 547
(42) Aquilina, L.; Pauwels, H.; Genter, A.; Fouillac, C. Water-rock interaction processes in the 548
Triassic sandstone and the granitic basement of the Rhine Graben: Geochemical investigation of a 549
geothermal reservoir. Geochim. Cosmochim. Acta 1997, 61, 4281-4295. 550
(43) Sanjuan, B.; Millot, R.; Dezayes, C.; Brach, M. Main characteristics of the deep geothermal 551
brine (5km) at Soultz-sous-Forêts (France) determined using geochemical and tracer test data. C. R. 552
Geosci. 2010, 342, 546-559.
553
(44) Sanjuan, B.; Millot, R.; Innocent, C.; Dezayes, C.; Scheiber, J.; Brach, M. Major geochemical 554
characteristics of geothermal brines from the Upper Rhine Graben granitic basement with constraints 555
on temperature and circulation. Chem. Geol. 2016, 428, 27-47. 556
(45) Aichholzer, C.; Duringer, P.; Orciani, S.; Genter, A. New stratigraphic interpretation of the 557
Soultz-sous-Forêts 30-year-old geothermal wells calibrated on the recent one from Rittershoffen 558
(Upper Rhine Graben, France). Geotherm. Energy 2016, 4, 13. 559
(46) Heap, M. J.; Kushnir, A. R.; Gilg, H. A.; Wadsworth, F. B.; Reuschlé, T.; Baud, P. 560
Microstructural and petrophysical properties of the Permo-Triassic sandstones (Buntsandstein) from 561
the Soultz-sous-Forêts geothermal site (France). Geotherm. Energy 2017, 5, 26. 562
(47) Heap, M. J.; Villeneuve, M.; Kushnir, A. R.; Farquharson, J. I.; Baud, P.; Reuschlé, T. Rock 563
mass strength and elastic modulus of the Buntsandstein: an important lithostratigraphic unit for 564
geothermal exploitation in the Upper Rhine Graben. Geothermics 2019, 77, 236-256. 565
566 567 568
27
For Table of Contents Use Only
569 570
Manuscript Title
571
Barite growth rates as a function of crystallographic orientation, temperature, and solution saturation 572 state 573 574
Author list
575Mélanie Vital, Damien Daval, Gilles Morvan, Daniel E. Martinez, Michael J. Heap 576 577
TOC Graphic
578 579 580Synopsis
581Barite growth rate was monitored as function of crystallographic orientation, temperature, and solution 582
saturation state by measuring the thickness of the grown layer using vertical scanning interferometry 583
584 585 586