HAL Id: hal-00328393
https://hal.archives-ouvertes.fr/hal-00328393
Submitted on 8 Jul 2005
HAL is a multi-disciplinary open access
archive for the deposit and dissemination of
sci-entific research documents, whether they are
pub-lished or not. The documents may come from
teaching and research institutions in France or
abroad, or from public or private research centers.
L’archive ouverte pluridisciplinaire HAL, est
destinée au dépôt et à la diffusion de documents
scientifiques de niveau recherche, publiés ou non,
émanant des établissements d’enseignement et de
recherche français ou étrangers, des laboratoires
publics ou privés.
depth over ocean during the period September 1997 to
December 2000
G. Myhre, F. Stordal, M. Johnsrud, D. J. Diner, I. V. Geogdzhayev, J. M.
Haywood, B. N. Holben, T. Holzer-Popp, A. Ignatov, R. A. Kahn, et al.
To cite this version:
G. Myhre, F. Stordal, M. Johnsrud, D. J. Diner, I. V. Geogdzhayev, et al.. Intercomparison of
satellite retrieved aerosol optical depth over ocean during the period September 1997 to December
2000. Atmospheric Chemistry and Physics, European Geosciences Union, 2005, 5 (6), pp.1719.
�hal-00328393�
Atmos. Chem. Phys., 5, 1697–1719, 2005 www.atmos-chem-phys.org/acp/5/1697/ SRef-ID: 1680-7324/acp/2005-5-1697 European Geosciences Union
Atmospheric
Chemistry
and Physics
Intercomparison of satellite retrieved aerosol optical depth over
ocean during the period September 1997 to December 2000
G. Myhre1,2, F. Stordal1,2, M. Johnsrud1, D. J. Diner3, I. V. Geogdzhayev4, J. M. Haywood5, B. N. Holben6, T. Holzer-Popp7, A. Ignatov8, R. A. Kahn3, Y. J. Kaufman9, N. Loeb10, J. V. Martonchik3, M. I. Mishchenko4, N. R. Nalli8, L. A. Remer9, M. Schroedter-Homscheidt7, D. Tanr´e11, O. Torres12, and M. Wang13
1Norwegian Institute for Air Research (NILU), Kjeller, Norway 2Department of Geosciences, University of Oslo, Oslo, Norway
3Jet Propulsion Laboratory, California Institute of Technology, Pasadena California, USA 4NASA Goddard Institute for Space Studies, New York, New York, USA
5Met Office, Exeter, UK
6Biospheric Sciences Branch, NASA Goddard Space Flight Center, Greenbelt, Maryland, USA
7Deutsches Zentrum f¨ur Luft- und Raumfahrt e.V. (DLR), Deutsches Fernerkundungsdatenzentrum (DFD), Oberpfaffenhofen, Germany
8NOAA/NESDIS/Office of Research and Applications/Climate Research and Applications Division, Washington, D.C., USA 9Laboratory for Atmospheres, NASA/Goddard Space Flight Center, Greenbelt, Maryland, USA
10Center for Atmospheric Sciences, Hampton University, Hampton, VA., USA
11Laboratoire d’Optique Atmosph´erique, Universit´e de Lille/CNRS, Villeneuve d’Ascq, France
12Joint Center for Earth Systems Technology, University of Maryland Baltimore County, Baltimore, Maryland, USA 13University of Maryland-Baltimore County, NASA Goddard Space Flight Center, Greenbelt, Maryland, USA
Received: 4 October 2004 – Published in Atmos. Chem. Phys. Discuss.: 15 December 2004 Revised: 2 May 2005 – Accepted: 6 June 2005 – Published: 8 July 2005
Abstract. Monthly mean aerosol optical depth (AOD) over
ocean is compared from a total of 9 aerosol retrievals dur-ing a 40 months period. Comparisons of AOD have been made both for the entire period and sub periods. We identify regions where there is large disagreement and good agree-ment between the aerosol satellite retrievals. Significant dif-ferences in AOD have been identified in most of the oceanic regions. Several analyses are performed including spatial correlation between the retrievals as well as comparison with AERONET data. During the 40 months period studied there have been several major aerosol field campaigns as well as events of high aerosol content. It is studied how the aerosol retrievals compare during such circumstances. The differ-ences found in this study are larger than found in a previ-ous study where 5 aerosol retrievals over an 8 months period were compared. Part of the differences can be explained by limitations and deficiencies in some of the aerosol retrievals. In particular, results in coastal regions are promising espe-cially for aerosol retrievals from satellite instruments partic-ularly suited for aerosol research. In depth analyses
explain-Correspondence to: G. Myhre
ing the differences between AOD obtained in different re-trievals are clearly needed. We limit this study to identifying differences and similarities and indicating possible sources that affect the quality of the retrievals. This is a necessary first step towards understanding the differences and improv-ing the retrievals.
1 Introduction
Satellite retrievals of aerosols and clouds have given much insight into the problem of quantification of the direct and indirect aerosol effects (e.g. Husar et al., 1997; Kaufman and Fraser, 1997; Nakajima and Higurashi, 1998; Boucher and Tanre 2000; Nakajima et al., 2001; Tanre et al. 2001; Rosen-feld, 2000; Rosenfeld et al., 2002; Koren et al., 2004). How-ever, significant uncertainties remain regarding the radiative and climate effect of aerosols of anthropogenic origin (Hay-wood and Boucher, 2000; IPCC, 2001; Ramanathan et al., 2001; Kaufman et al., 2002a). For the direct aerosol effect uncertainties exist both due to limited information on spatial and temporal variation in the aerosol optical properties and
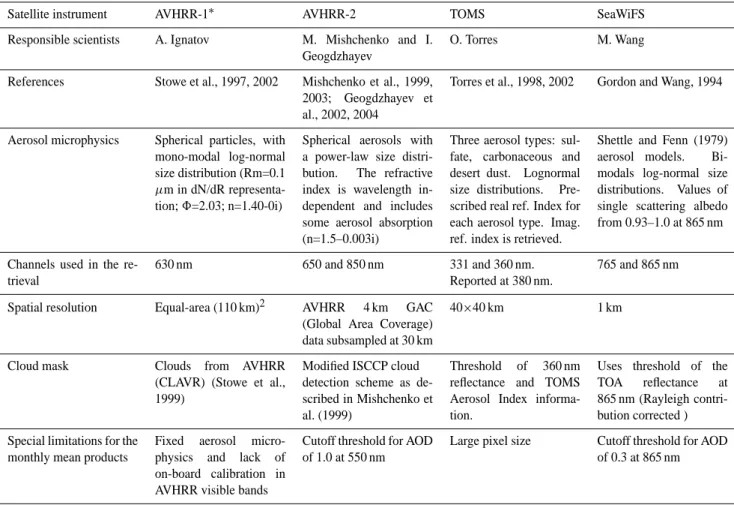
Table 1. Description of aerosol satellite retrievals.
Satellite instrument AVHRR-1∗ AVHRR-2 TOMS SeaWiFS
Responsible scientists A. Ignatov M. Mishchenko and I. Geogdzhayev
O. Torres M. Wang
References Stowe et al., 1997, 2002 Mishchenko et al., 1999, 2003; Geogdzhayev et al., 2002, 2004
Torres et al., 1998, 2002 Gordon and Wang, 1994
Aerosol microphysics Spherical particles, with mono-modal log-normal size distribution (Rm=0.1 µm in dN/dR representa-tion; 8=2.03; n=1.40-0i)
Spherical aerosols with a power-law size distri-bution. The refractive index is wavelength in-dependent and includes some aerosol absorption (n=1.5–0.003i)
Three aerosol types: sul-fate, carbonaceous and desert dust. Lognormal size distributions. Pre-scribed real ref. Index for each aerosol type. Imag. ref. index is retrieved.
Shettle and Fenn (1979) aerosol models. Bi-modals log-normal size distributions. Values of single scattering albedo from 0.93–1.0 at 865 nm Channels used in the
re-trieval
630 nm 650 and 850 nm 331 and 360 nm.
Reported at 380 nm.
765 and 865 nm
Spatial resolution Equal-area (110 km)2 AVHRR 4 km GAC (Global Area Coverage) data subsampled at 30 km
40×40 km 1 km
Cloud mask Clouds from AVHRR (CLAVR) (Stowe et al., 1999)
Modified ISCCP cloud detection scheme as de-scribed in Mishchenko et al. (1999)
Threshold of 360 nm reflectance and TOMS Aerosol Index informa-tion.
Uses threshold of the TOA reflectance at 865 nm (Rayleigh contri-bution corrected ) Special limitations for the
monthly mean products
Fixed aerosol micro-physics and lack of on-board calibration in AVHRR visible bands
Cutoff threshold for AOD of 1.0 at 550 nm
Large pixel size Cutoff threshold for AOD of 0.3 at 865 nm
∗
The differences between AVHRR-1 (2g) and AVHRR-1 (3g/QC) are (i) that an additional quality control is performed for AVHRR-1 (3g/QC) (Ignatov and Stowe, 2002b), (ii) two channels are used in the retrieval (630 and 830 nm), (iii) and another radiative transfer code is used to calculate the look-up-table (Vermote et al., 1997). The AVHRR-1 (3g/QC) is documented in Ignatov and Nalli (2002), Ignatov and Stowe (2002a), Ignatov et al. (2004).
the composition of the aerosols. Of particular importance is the fact that the crucial parameter single scattering albedo is poorly quantified. Satellite data have greatly improved the knowledge about the distribution of aerosols in the at-mosphere. Given the complicated task of retrieving aerosol information from satellite instruments (King et al., 1999), it was perhaps not surprising that Myhre et al. (2004) showed, by comparing 5 satellite aerosol retrievals over ocean for an eight month period (November 1996 to June 1997), that substantial differences in aerosol optical depth (AOD) are present. In general, they found differences in AOD of a fac-tor of two between the different datasets, but in some regions it was even higher. The best agreement in AOD was found in coastal regions with high AOD, whereas the largest discrep-ancies were found over large areas of remote oceanic regions in the southern hemisphere. Cloud screening was implicated as probably one of the main reasons for the large disagree-ment.
In this study we investigate AOD over ocean from sev-eral satellite aerosol retrievals over a 40 months period from September 1997 until December 2000. This is a much longer period than studied in Myhre et al. (2004) and allows inves-tigation of inter-annual variability in AOD. For this period, 4 different aerosol satellite retrievals are investigated that were producing data for the entire period. Out of these 4 retrievals, 3 were also used in the intercomparison study in Myhre et al. (2004). In addition we focus on two shorter time pe-riods; (i) an 8 months period with one additional satellite aerosol retrieval and two supplementary versions of one of the four main retrievals, (ii) a 10 months period with two ad-ditional retrievals for dedicated aerosol research. A particu-larly interesting issue is to see how the long term monitoring satellite retrievals compare to retrievals from satellite instru-ments especially suited for monitoring of aerosols (e.g. such as POLDER, MODIS, MISR).
G. Myhre et al.: Intercomparison of satellite retrieved aerosol optical depth 1699
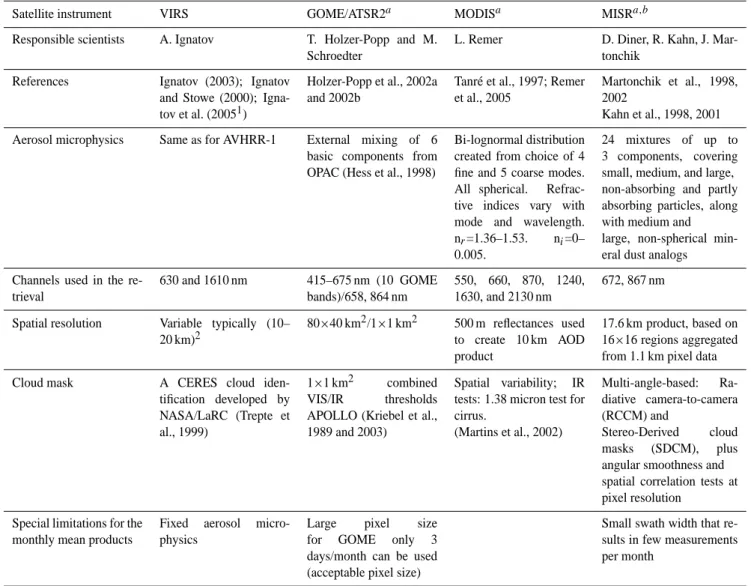
Table 1. Continued.
Satellite instrument VIRS GOME/ATSR2a MODISa MISRa,b
Responsible scientists A. Ignatov T. Holzer-Popp and M. Schroedter
L. Remer D. Diner, R. Kahn, J. Mar-tonchik
References Ignatov (2003); Ignatov and Stowe (2000); Igna-tov et al. (20051)
Holzer-Popp et al., 2002a and 2002b
Tanr´e et al., 1997; Remer et al., 2005
Martonchik et al., 1998, 2002
Kahn et al., 1998, 2001 Aerosol microphysics Same as for AVHRR-1 External mixing of 6
basic components from OPAC (Hess et al., 1998)
Bi-lognormal distribution created from choice of 4 fine and 5 coarse modes. All spherical. Refrac-tive indices vary with mode and wavelength. nr=1.36–1.53. ni=0–
0.005.
24 mixtures of up to 3 components, covering small, medium, and large, non-absorbing and partly absorbing particles, along with medium and large, non-spherical min-eral dust analogs Channels used in the
re-trieval 630 and 1610 nm 415–675 nm (10 GOME bands)/658, 864 nm 550, 660, 870, 1240, 1630, and 2130 nm 672, 867 nm
Spatial resolution Variable typically (10– 20 km)2 80×40 km2/1×1 km2 500 m reflectances used to create 10 km AOD product 17.6 km product, based on 16×16 regions aggregated from 1.1 km pixel data Cloud mask A CERES cloud
iden-tification developed by NASA/LaRC (Trepte et al., 1999)
1×1 km2 combined VIS/IR thresholds APOLLO (Kriebel et al., 1989 and 2003)
Spatial variability; IR tests: 1.38 micron test for cirrus. (Martins et al., 2002) Multi-angle-based: Ra-diative camera-to-camera (RCCM) and Stereo-Derived cloud masks (SDCM), plus angular smoothness and spatial correlation tests at pixel resolution
Special limitations for the monthly mean products
Fixed aerosol micro-physics
Large pixel size for GOME only 3 days/month can be used (acceptable pixel size)
Small swath width that re-sults in few measurements per month
ahas also an aerosol retrieval over land
bMISR Aerosol Product Version 12 is used in this study. Upgrades to the aerosol climatology and low-light-level calibration, applied
in Version 16 and higher, reduce MISR-derived AOD over dark water and under dusty conditions, improving the agreement with sun photometer observations, globally (Kahn et al., 2005). Refinements to the cloud-screening algorithm, currently under study, are expected to correct outliers that sometimes appear, especially at high latitudes, as illustrated in this study.
1Ignatov, A., Minnis, P., Loeb, N., Wielicki, B., Miller, W., Geier, E., Sun-Mack, S., Trepte, Q.: Aerosol retrievals from TRMM/VIRS over
open ocean, J. Appl. Meteorol., in prep., 2005.
A significant advantage of our intercomparison of AOD in this 3 years period compared to the earlier intercompari-son period is that much more ground based sunphotometer data from AERONET are available. This allows a broader comparison between the satellite aerosol retrievals and the AERONET measurements and furthermore an evaluation of under which conditions differences in the retrievals are largest. The aim of this study is to explore data for potential use by the global modelling community for comparing and improving global aerosol models. Hence validation of satel-lite data against AERONET in this study is done on spatial
(1 degree) and temporal (1 month) scales consistent with this task. Refinement of those scales is subject of future research. Finally, we also compare AOD from the various satellite re-trievals in some selected regions and time periods with par-ticular focus on e.g. episodes of large AODs or measurement campaigns. Also, we discuss whether differences in AOD are particularly large for e.g. certain satellite retrievals, oceanic regions, aerosol sizes, and ranges of AOD.
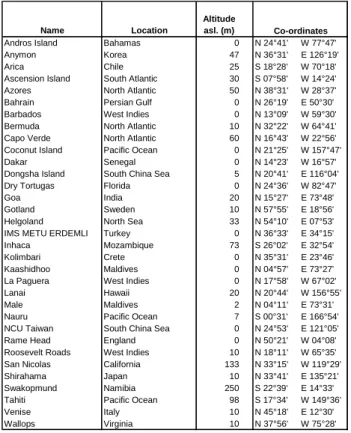
Table 2. Location of AERONET stations used in the comparison.
31 Table2: Location of AERONET stations used in the comparison.
Name Location
Altitude asl. (m)
Andros Island Bahamas 0 N 24°41' W 77°47'
Anymon Korea 47 N 36°31' E 126°19'
Arica Chile 25 S 18°28' W 70°18'
Ascension Island South Atlantic 30 S 07°58' W 14°24'
Azores North Atlantic 50 N 38°31' W 28°37'
Bahrain Persian Gulf 0 N 26°19' E 50°30'
Barbados West Indies 0 N 13°09' W 59°30'
Bermuda North Atlantic 10 N 32°22' W 64°41'
Capo Verde North Atlantic 60 N 16°43' W 22°56'
Coconut Island Pacific Ocean 0 N 21°25' W 157°47'
Dakar Senegal 0 N 14°23' W 16°57'
Dongsha Island South China Sea 5 N 20°41' E 116°04'
Dry Tortugas Florida 0 N 24°36' W 82°47'
Goa India 20 N 15°27' E 73°48'
Gotland Sweden 10 N 57°55' E 18°56'
Helgoland North Sea 33 N 54°10' E 07°53'
IMS METU ERDEMLI Turkey 0 N 36°33' E 34°15'
Inhaca Mozambique 73 S 26°02' E 32°54'
Kolimbari Crete 0 N 35°31' E 23°46'
Kaashidhoo Maldives 0 N 04°57' E 73°27'
La Paguera West Indies 0 N 17°58' W 67°02'
Lanai Hawaii 20 N 20°44' W 156°55'
Male Maldives 2 N 04°11' E 73°31'
Nauru Pacific Ocean 7 S 00°31' E 166°54'
NCU Taiwan South China Sea 0 N 24°53' E 121°05'
Rame Head England 0 N 50°21' W 04°08'
Roosevelt Roads West Indies 10 N 18°11' W 65°35'
San Nicolas California 133 N 33°15' W 119°29'
Shirahama Japan 10 N 33°41' E 135°21'
Swakopmund Namibia 250 S 22°39' E 14°33'
Tahiti Pacific Ocean 98 S 17°34' W 149°36'
Venise Italy 10 N 45°18' E 12°30'
Wallops Virginia 10 N 37°56' W 75°28'
Co-ordinates
2 Method
For the comparison of satellite retrievals, data for the time period September 1997 to December 2000 have been collected. During this entire period, continuous AOD data from four satellite retrievals are available, namely AVHRR, (a one (AVHRR-1) and a two channel (AVHRR-2) retrieval), TOMS, and SeaWiFS. In addition AOD data from VIRS for an 8-month period (January to August 1998) are available. Further, two versions of the one channel AVHRR retrieval for the same time period are available. Since March 2000 data from the retrievals of the dedicated aerosol instruments MODIS and MISR (both onboard the Terra satellite) have become available, and thus we include 10 months of data for these retrievals. For MODIS version 4 data have been used. Due to the MISR capacity of multi angle viewing there is a rather small swath width for this instrument, re-quiring 9 days for full global coverage. Thus monthly mean datasets, which are used in much of this study, contain fewer data points in time for MISR than for the other retrievals. From September 1997 to August 1998 data for some limited regional areas covered by Meteosat-8 domain are included for a retrieval based on a combination of GOME and ATSR-2. The GOME/ATSR-2 retrieval yields only 3 days of mea-surements each month due to pixel size mode programming. Therefore monthly averages need to be compared with care.
It should be noted that this retrieval method was mainly de-veloped for application over land and separation of the ba-sic aerosol components. Due to the large GOME pixel size of 80×40 km2retrieval values at coastal sites may be domi-nated by AOD values derived from dark surface reflectances over land. AVHRR has been producing data since 1981 and TOMS, except for a break from 1992 to 1996, since 1979. September 1997 was chosen as the first month of the com-parison because this was the first month with AOD data from SeaWiFS. Currently, the SeaWiFS data processing is opti-mized for the ocean color measurements. As a result, very thick aerosol AOD cases such as the dust and smoke plumes are usually masked out due to large uncertainties in the ocean color products in these cases. Recall also that SeaWiFS is lacking thermal infrared band, thus significantly complicat-ing separatcomplicat-ing of aerosol from cloud. SeaWiFS has a re-flectance threshold at 865 nm corresponding to AOD of ∼0.3 above which aerosol retrievals are discarded. Thus, the Sea-WiFS AOD is mostly applicable and valid in the open ocean regions (Wang et al., 2000a; Wang et al., 2000b). It should be noted that AVHRR-2 has a similar AOD threshold of 1.0 at 550 nm. Table 1 gives a short description of the 8 retrievals.
The AOD data are reported for different wavelengths; AVHRR-1 at 630 nm, AVHRR-2 at 550 nm, SeaWiFS at 865 nm, TOMS at 380 nm, VIRS at 630 nm, GOME/ATSR-2 at 550 nm, MODIS at 550 nm, and MISR at 558 nm. For comparison in this study, we convert the AOD data for the different wavelengths to the AOD at 550 nm. For SeaW-iFS the ˚Angstr¨om coefficient reported as part of the SeaW-iFS data product is used for conversion. The AVHRR-1 data and the VIRS data have been converted using the ˚Angstr¨om coefficient from AVHRR-2. For TOMS a provisional esti-mate of AOD at 550 nm is made by scaling the 380 nm val-ues with the monthly mean ratio between 550 nm and 380 nm AOD values from TOMS from the period 1979 to 1992 for each grid point. For AVHRR-2, MODIS, GOME/ATSR-2 and MISR the reported wavelength are used. All the satellite data are compared for a 1×1 degree grid on a monthly mean basis.
The satellite retrievals are compared with ground based AOD measurements from AERONET (Holben et al., 1998). Because the satellite retrievals in this comparison mostly in-clude data over ocean only, measurements from AERONET stations located on islands and near coastlines are used. Even so, the grid square where the station is located will in many cases be predominantly over land and therefore have no AOD value from the satellite retrievals. The AERONET data are therefore compared to an average of 9 (3 in latitudinal and 3 in longitudinal direction) 1×1 degrees grid squares of satel-lite data, where the ground station is located in the centre grid square. Note that the comparison of satellite data to the AERONET data is similar to a model to AERONET com-parison, since currently horizontal resolution is around 3 de-grees in many global models. Based on the MODIS data, which are also retrieved over land, the assumption of using 9
G. Myhre et al.: Intercomparison of satellite retrieved aerosol optical depth 1701
32
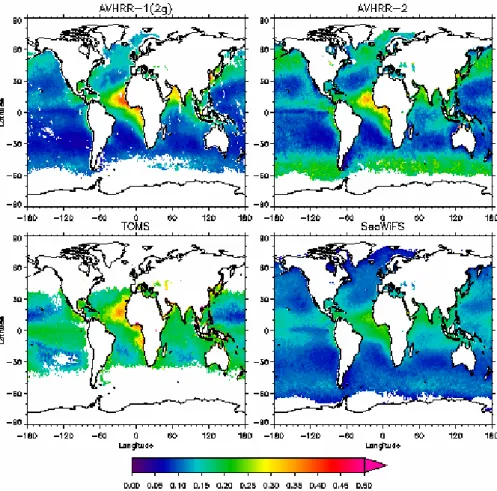
Fig. 1a. Averaged AOD (550 nm) over ocean for the period Sep 97–Dec 00. Values are given with minimum of data for ten months. Maximum 1-degree monthly average AOD is 0.72, 1.00, 1.57, and 0.28, respectively for AVHRR-1(2g), AVHRR-2, TOMS, and SeaWiFS.grid points instead of 1 in the comparison with AERONET is investigated. The results of this investigation is presented in Appendix 1, showing generally very similar results for 9 grid points compared to the closest grid point to an AERONET station. Out of 33 AERONET stations used in this study and listed in Table 2, this assumption seems unsatisfactory for only 3 stations.
3 Intercomparison of satellite AOD
Figure 1a shows the geographical distribution of AOD for a mean of 40 months for 4 satellite retrievals. The figure con-firms results of many previous satellite studies that AOD is generally highest near continental regions. This is evident in all four data sets. The aerosol plume over the Atlantic west of Africa is clearly evident, with mineral dust dominat-ing in the northern region and biomass burndominat-ing dominatdominat-ing in the south and a mixture of these aerosols around Equa-tor. As in Myhre et al. (2004) significant differences can be seen in the southern hemisphere at high latitudes. SeaWiFS has generally lower AOD than the three other retrievals. Fig-ure 1b and c show the geographical distribution of AOD for
the 2 sub periods. The VIRS data show a similar pattern in AOD as the 4 retrievals which are available for the whole pe-riod in this study. Note that VIRS coverage is limited from
∼38 S–38 N, due to the orbital specifics of the Tropical Rain-fall Measuring Mission (TRMM) platform. The magnitude in AOD for VIRS is most similar to AVHRR-1 and TOMS. GOME/ATSR-2 has a sparse geographical coverage of AOD but indicates gradients and AOD values west of Africa that are similar to the other aerosol retrievals. The improved qual-ity control in AOD for AVHRR-1 reduces the coverage of AOD, but influences the magnitude of AOD only weakly where data are available.
MODIS and MISR have higher AOD values in many re-gions compared to the 4 other retrievals shown in Fig. 1c, with MISR AOD usually somewhat higher than MODIS val-ues. The highest AOD values are off the coast of northwest Africa and at high latitudes. The magnitude in AOD varies somewhat between the various retrievals but the pattern in AOD in the tropical Atlantic Ocean is rather robust. The spatial coverage in different AOD in products is limited to those areas which get enough solar illumination to gener-ate sufficient reflected energy to be detected from a sgener-atellite
33
Fig. 1b. Averaged AOD (550 nm) over ocean for the period Jan to Aug 1998. Values are given with minimum of data for two months. Maximum 1-degree monthly average AOD is 0.95 for AVHRR-1(2g), 1.00 for AVHRR-2, 2.53 for TOMS, 0.35 for SeaWiFS, 1.31 for VIRS, 2.73 for GOME/ATSR-2, and 0.64 for AVHRR-1 (3g/QC).in a specific orbit. It is interesting to see the values up to around 0.3 in the southern hemisphere and up to 0.6 in the northern hemisphere at high latitudes for MODIS and MISR. In the region in the southern hemisphere the aerosols are mainly sea salt and to some extent natural sulfate aerosols and episodic anthropogenic aerosols. This is a region with few AERONET measurements and has been identified in Myhre et al. (2004) as the region with largest difference be-tween the various satellite retrievals. The high AOD in the northern Pacific is interesting and is a likely a combination
of outflow of aerosols from the Asian continent and sea salt aerosols generated by the relatively high windspeeds in these regions. The ˚Angstr¨om Exponent is higher than in most of the other oceanic regions. The gradual decrease from the Asian Continent in this parameter indicates a combination of industrial pollution and sea salt aerosols. Note also the ele-vated AOD around 10–20◦N in the eastern part of the Pacific Ocean which is seen to various extent in all the datasets. Two areas with particular differences are near the coast of China and the North Sea. In the former region the AOD varies
G. Myhre et al.: Intercomparison of satellite retrieved aerosol optical depth 1703
34
Figure 1A: Averaged AOD (550 nm) over ocean for the period Sep 97-Dec 00. Values are
given with minimum of data for ten months. Maximum 1-degree monthly average AOD is
0.72, 1.00, 1.57, and 0.28, respectively for AVHRR-1(2g), AVHRR-2, TOMS, and SeaWiFS.
Figure 1B: Averaged AOD (550 nm) over ocean for the period Jan to Aug 1998. Values are
given with minimum of data for two months. Maximum 1-degree monthly average AOD is
0.95 for AVHRR-1(2g), 1.00 for AVHRR-2, 2.53 for TOMS, 0.35 for SeaWiFS, 1.31 for
VIRS, 2.73 for GOME/ATSR-2, and 0.64 for AVHRR-1 (3g/QC).
Figure 1C: Averaged AOD (550 nm) over ocean for the period Mar to Dec 2000. Values are
given with minimum of data for two months. Maximum 1-degree monthly average AOD is
0.81 for AVHRR-1, 1.00 for AVHRR-2, 2.53 for TOMS, 0.31 for SeaWiFS, 2.27 for MODIS,
Fig. 1c. Averaged AOD (550 nm) over ocean for the period Mar to Dec 2000. Values are given with minimum of data for two months. Maximum 1-degree monthly average AOD is 0.81 for AVHRR-1, 1.00 for AVHRR-2, 2.53 for TOMS, 0.31 for SeaWiFS, 2.27 for MODIS, and, 1.62 for MISR. [Note that orbit of NOAA-14 satellite (launched late 1994) whose AVHRR data are used in this study significantly drifted towards later afternoon by year 2000, causing loss of AVHRR-1 retrievals at low sun in the upper left panel.]gradually from about 0.2 to 1.0. In the North Sea MISR shows a particularly high AOD.
In Fig. 2 the global mean of all the 8 data sets with global coverage are shown for the whole period. The global mean AOD differs by at least a factor of 2. AVHRR-2 and Sea-WiFS have considerably weaker annual variability than the other data sets. The inter-annual variability differs somewhat between the AVHRR-1 and TOMS. The AOD from the VIRS retrieval is in the upper range of the AODs represented in the study. A variation over the 8 months can be seen in the VIRS data. Interestingly, a comparison between the 2nd generation and 3rd generation AVHRR-1 product yields differences that are almost as large as differences between various aerosol retrievals on different satellite platforms. The two AVHRR products have similar temporal variation in AOD over the 8 months period. The yearly variation in global AOD is very similar for MODIS and MISR despite differences in their magnitude.
35 and, 1.62 for MISR. [Note that orbit of NOAA-14 satellite (launched late 1994) whose AVHRR data are used in this study significantly drifted towards later afternoon by year 2000, causing loss of AVHRR-1 retrievals at low sun in the upper left panel.]
0.05 0.10 0.15 0.20 0.25 0.30 0.35 S ep 97 No v 9 7 J an 98 Mar 9 8 Ma y 9 8 Ju l 9 8 S ep 98 No v 9 8 J an 99 Mar 9 9 Ma y 9 9 Ju l 9 9 S ep 99 No v 9 9 J an 00 Mar 0 0 Ma y 0 0 Ju l 0 0 S ep 00 No v 0 0 A O D 550 nm
AVHRR-1(2g) AVHRR-2 TOMS SeaWiFS AVHRR-1(3g/QC) VIRS MODIS MISR
Figure 2: Global and monthly mean AOD (550 nm) over ocean from September 1997 to December 2000.
Fig. 2. Global and monthly mean AOD (550 nm) over ocean from September 1997 to December 2000.
Figure 3 shows the zonal mean AOD for the entire 40 month period (a), the 8 months period from January to Au-gust 1998 (b), and the 10 months period from March to December 2000. Similar to what was found in Myhre et
36 Sep 1997-Dec 2000 0.00 0.05 0.10 0.15 0.20 0.25 0.30 0.35 0.40 -9 0 -8 0 -7 0 -6 0 -5 0 -4 0 -3 0 -2 0 -1 0 0 10 20 30 40 50 60 70 80 90 Latitude A O D ( 5 5 0 nm )
AVHRR-1(2g) AVHRR-2 TOMS SeaWiFS
Jan-Aug 1998 0 0.1 0.2 0.3 0.4 0.5 0.6 0.7 0.8 -9 0 -8 0 -7 0 -6 0 -5 0 -4 0 -3 0 -2 0 -1 0 0 10 20 30 40 50 60 70 80 90 Latitude AO D ( 5 5 0 n m )
AVHRR-1(2g) AVHRR-2 TOMS SeaWiFS VIRS AVHRR-1(3g/QC)
Mar-Dec 2000 0 0.1 0.2 0.3 0.4 -9 0 -8 0 -7 0 -6 0 -5 0 -4 0 -3 0 -2 0 -1 0 0 10 20 30 40 50 60 70 80 90 Latitude A O D ( 5 50 nm )
AVHRR-1(2g) AVHRR-2 TOMS SeaWiFS MODIS MISR
Figure 3: Zonal mean AOD as a function of latitude, for the entire period of investigation, as well as for the two selected periods used in Figure 1b and 1c.
Fig. 3. Zonal mean AOD as a function of latitude, for the entire period of investigation, as well as for the two selected periods used in Figs. 1b and c.
al. (2004) the largest differences are found at high latitudes, whereas the results in tropical regions are generally more comparable. The largest differences between MODIS and MISR in the monthly mean are found at high latitudes, in par-ticular in the southern hemisphere. For the entire period the differences are largest in the southern hemisphere, whereas in the latest sub period large differences are also found in the northern hemisphere. A common feature with local maxima near equator and at higher latitudes and local minima at 20– 30 degrees in both hemispheres can be seen to various extent in all the retrievals. Aerosol outflow from Africa, relatively high AOD in the Indian Ocean, and high AOD at higher lati-tudes fit into this picture
Figure 4 illustrates the annual cycle of AOD, and its inter-annual variability, over 4 large oceanic regions defined in Ap-pendix B. The thick lines show the 40 months period mean AOD and the dotted lines show minimum and maximum AOD values during the same period. AVHRR-1 and TOMS have much larger inter-annual variability than AVHRR-2 and
37
North Atlantic Ocean
0.05 0.10 0.15 0.20 0.25 0.30 0.35 0.40
Jan Feb Mar Apr May Jun Jul Aug Sep Oct Nov Dec
A v er ag e A O D 5 5 0 nm
AVHRR-1(2g) AVHRR-2 TOMS SeaWiFS
South Atlantic Ocean
0.05 0.10 0.15 0.20 0.25 0.30 0.35 0.40
Jan Feb Mar Apr May Jun Jul Aug Sep Oct Nov Dec
A v e ra ge A O D 55 0 n m Indian Ocean 0.05 0.10 0.15 0.20 0.25 0.30 0.35 0.40
Jan Feb Mar Apr May Jun Jul Aug Sep Oct Nov Dec
A v er ag e A O D 5 5 0 nm Pacific Ocean 0.05 0.10 0.15 0.20 0.25 0.30 0.35 0.40
Jan Feb Mar Apr May Jun Jul Aug Sep Oct Nov Dec
A v er ag e A O D 5 5 0 nm
Figure 4: Monthly mean AOD (550 nm) for four ocean regions (see definition in Figure A2). The solid curves are averages for the entire period selected in this study. The dashed lines represents highest and lowest values among the years.
Fig. 4. Monthly mean AOD (550 nm) for four ocean regions (see definition in Fig. A2). The solid curves are averages for the entire period selected in this study. The dashed lines represents highest and lowest values among the years.
SeaWiFS. This is also indicated in Fig. 2a, but Fig. 4 shows that this is the case over all the 4 oceanic regions. Generally, AVHRR-1 and TOMS have a larger inter-annual variability from April to November than during the rest of the year.
Figure 5 shows AOD from the nine data sets for 11 smaller coastal regions, in an attempt to cover the oceanic regions with highest AOD. AOD is thus usually higher in these re-gions than the global mean. Further, in general the differ-ence between the AOD from the various retrievals is smaller than for global averages and for larger oceanic regions, as
G. Myhre et al.: Intercomparison of satellite retrieved aerosol optical depth 1705
38 Cape Verde Plateau
0.0 0.2 0.4 0.6 0.8 S e p 97 F eb 98 Ju l 9 8 De c 9 8 Ma y 9 9 Oct 9 9 Mar 00 A ug 00 A O D 550 nm Angola Basin 0.0 0.2 0.4 0.6 0.8 S ep 97 F e b 98 Ju l 9 8 De c 9 8 Ma y 9 9 Oct 9 9 Ma r 0 0 A ug 0 0 A O D 550 nm
East Coast of USA
0.0 0.2 0.4 0.6 0.8 S ep 97 F eb 98 Ju l 9 8 De c 9 8 Ma y 9 9 Oct 9 9 Mar 00 A u g 00 A O D 550 nm Arabian Sea 0.0 0.2 0.4 0.6 0.8 S ep 97 Mar 98 S ep 98 Mar 99 S ep 99 Mar 00 S ep 00 A O D 5 50 nm Bay of Bengal 0.0 0.2 0.4 0.6 0.8 Se p 9 7 F eb 98 Ju l 9 8 De c 9 8 Ma y 9 9 Oct 9 9 Mar 00 A ug 00 A O D 550 n m Red Sea 0.0 0.2 0.4 0.6 0.8 Se p 9 7 F eb 98 Ju l 9 8 De c 9 8 Ma y 9 9 Oct 9 9 Mar 00 A ug 00 A O D 550 nm Black Sea 0.0 0.2 0.4 0.6 0.8 S ep 97 Mar 98 S ep 98 Mar 99 S ep 99 Mar 00 S ep 00 A O D 550 nm Caspian Sea 0.0 0.2 0.4 0.6 0.8 S ep 97 Feb 98 Ju l 9 8 De c 9 8 May 99 Oc t 9 9 Ma r 0 0 A ug 00 A O D 550 nm Mediterranean Sea 0.0 0.2 0.4 0.6 0.8 S ep 97 Mar 98 S ep 98 Mar 99 S ep 99 Mar 00 S ep 00 A O D 550 nm
South China Sea
0.0 0.2 0.4 0.6 0.8 S ep 97 Ma r 9 8 S ep 98 Ma r 9 9 S ep 99 Ma r 0 0 S ep 00 A O D 550 nm
East China Sea and Sea of Japan
0.0 0.2 0.4 0.6 0.8 Se p 9 7 F eb 98 Ju l 9 8 De c 9 8 Ma y 9 9 Oct 9 9 Mar 00 A ug 00 A O D 550 n m AVHRR-1(2g) AVHRR-2 TOMS SeaWiFS AVHRR-1(3g/QC) VIRS GOME/ATSR-2 MODIS MISR
Figure 5: Monthly mean AOD (550 nm) over ocean for 11 near coastal regions (see definition in Figure A2).
Fig. 5. Monthly mean AOD (550 nm) over ocean for 11 near coastal regions (see definition in Fig. A2).
found also in Myhre et al. (2004). In about half of the 11 regions a distinct seasonal variation in AOD can be seen. However, the seasonal amplitude varies between the satellite retrievals. For many of the retrievals the agreement is best at the East coast of USA, and over the Arabian Sea and the Red Sea. The differences between the two AVHRR-1 data sets are smaller than shown in Fig. 2 for global conditions. The VIRS data have many similarities with the AVHRR-1 data sets, although often with somewhat higher values. The agreement in AOD between MODIS and MISR is very good, except for the Caspian Sea where the difference between the retrievals is usually large. Further, there is a tendency that MODIS and MISR as well as GOME/ATSR-2 have higher AOD than the other retrievals.
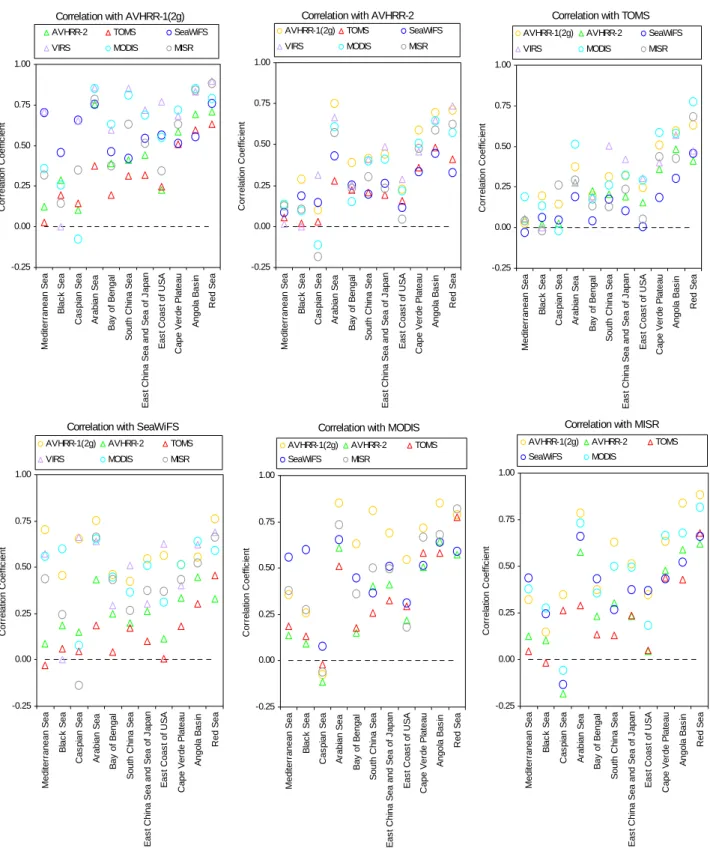
In Fig. 5 an average value for each region was shown. However, despite two datasets having a similar average value, they may have a different spatial distribution. Figure 6 shows the spatial correlation coefficient between various re-trievals for the months with common availability of data. The correlation coefficient between the 1-degree monthly aver-age satellite retrievals is shown for the oceanic regions il-lustrated in Fig. 5 for six of the retrievals. The highest cor-relation coefficient is found for the Angola basin, the Red Sea, and the Arabian Sea, whereas the weakest correlation coefficient is identified in the Caspian Sea. Also in the Mediterranean Sea and the Black Sea the correlation coef-ficients are low. Two apparent explanations of the variations in the correlation coefficient for the regions are differences
39
Correlation with AVHRR-1(2g)
-0.25 0.00 0.25 0.50 0.75 1.00 Medi te rr anean S e a Bl a c k Se a C a s p ian S e a A rabi an S e a B a y of B engal S out h C h ina S e a E a s t C h in a S ea and S ea of J apan E a s t C oas t of U S A C ape V e rde P lat eau A ngol a B a s in R ed S e a C o rr e la tion C oef fic ient
AVHRR-2 TOMS SeaWiFS VIRS MODIS MISR
Correlation with AVHRR-2
-0.25 0.00 0.25 0.50 0.75 1.00 Medi te rr anean S e a Bl a c k Se a C a s p ian S e a A rabi an S e a B a y of B engal S out h C h ina S e a E a s t C h in a S ea and S ea of J apan E a s t C oas t of U S A C ape V e rde P lat eau A ngol a B a s in R ed S e a C o rr e la tion C oef fic ient
AVHRR-1(2g) TOMS SeaWiFS VIRS MODIS MISR
Correlation with TOMS
-0.25 0.00 0.25 0.50 0.75 1.00 Medi te rr anean S e a Bl a c k Se a C a s p ian S e a A rabi an S e a B a y of B engal S out h C h ina S e a E a s t C h in a S ea and S ea of J apan E a s t C oas t of U S A C ape V e rde P lat eau A ngol a B a s in R ed S e a C o rr e la tion C o ef fic ient
AVHRR-1(2g) AVHRR-2 SeaWiFS VIRS MODIS MISR
Correlation with SeaWiFS
-0.25 0.00 0.25 0.50 0.75 1.00 Medi te rr anean S e a Bl a c k Se a C a s p ian S e a A rabi an S e a B a y of B engal S out h C h ina S e a E a s t C h ina S ea and S ea of J apan E a s t C oas t of U S A C ape V e rde P lat eau A ngol a B a s in R ed S e a C o rr e la tion C oef fic ient
AVHRR-1(2g) AVHRR-2 TOMS VIRS MODIS MISR
Correlation with MODIS
-0.25 0.00 0.25 0.50 0.75 1.00 Medi te rr anean S e a Bl a c k Se a C a s p ian S e a A rabi an S e a B a y of B engal S out h C h ina S e a E a s t C h ina S ea and S ea of J apan E a s t C oas t of U S A C ape V e rde P lat eau A ngol a B a s in R ed S e a C o rr e la tion C oef fic ient
AVHRR-1(2g) AVHRR-2 TOMS SeaWiFS MISR
Correlation with MISR
-0.25 0.00 0.25 0.50 0.75 1.00 Medi te rr anean S e a Bl a c k Se a C a s p ian S e a A rabi an S e a B a y of B engal S out h C h ina S e a E a s t C h ina S ea and S ea of J apan E a s t C oas t of U S A C ape V e rde P lat eau A ngol a B a s in R ed S e a C o rr e la tion C oef fic ient
AVHRR-1(2g) AVHRR-2 TOMS SeaWiFS MODIS
Figure 6: Temporal average of spatial correlations on grid square level between
AVHRR-1(2g), AVHRR-2, VIRS, TOMS, SeaWiFS, MODIS and MISR for the 11 regions (see
definition in Figure A2).
Fig. 6. Temporal average of spatial correlations on grid square level between AVHRR-1(2g), AVHRR-2, VIRS, TOMS, SeaWiFS, MODIS and MISR for the 11 regions (see definition in Fig. A2).
G. Myhre et al.: Intercomparison of satellite retrieved aerosol optical depth 1707 in the temporal variation in AOD and variation in aerosol
type and mixture. For a high temporal variation in AOD sampling issues are especially important. Further, variation in aerosol type and mixture may be problematic since most of the retrievals have pre-defined assumptions on absorption, and in many cases also on size. The Mediterranean Sea and Caspian Sea is likely to be dominated by aerosols from in-dustrial pollution with episodic influence by mineral dust plumes. This yields significant temporal variation in AOD. Furthermore, and probably more important is the fact that many aerosol types and sizes are likely present, sometimes even in complicated internal mixtures. On the other hand the Angola basin and the Red Sea are mainly dominated by one aerosol type (besides some sea salt aerosols); namely biomass burning aerosols and mineral dust, respectively. For AVHRR-1 the correlation with other aerosol retrievals is usu-ally high, not surprisingly it is generusu-ally best with VIRS but also highly correlated with MODIS and MISR. For AVHRR-2, TOMS, and SeaWiFS the correlation with other retrievals is usually slightly lower than for AVHRR-1. The correla-tion between these three retrievals is low, and each of them are normally more strongly correlated to the four other re-trievals. The spatial correlation between MODIS and MISR is high, with exceptions for the East coast of USA, the Black Sea, and especially for the Caspian Sea. However, it is in-teresting that AVHRR-1 often has even higher correlation with both MODIS and MISR than the internal correlation be-tween MODIS and MISR. The internal correlation bebe-tween MODIS and MISR is certainly influenced by the low tempo-ral sampling of MISR as discussed above. Note here that in some regions the analysis with AVHRR-1 against MODIS and MISR is based on relatively few months due to data availability. Note also that retrievals in the coastal areas may be possibly affected by the surface reflectance, which may be elevated here over the background oceanic conditions.
The spatial and temporal variation in the aerosol distribu-tion is large, and in some periods episodes of large aerosol amount can occur. This can either be due to large fires (of natural or anthropogenic origin), occurrences of large min-eral dust outbreaks or when meteorological conditions favor high concentration of aerosols resulting from industrial activ-ity. The aim of Fig. 7 is to illustrate how the various satellite retrievals compare under such circumstances. We have se-lected some episodes during the period of this study with high amounts of aerosols. Aerosol campaigns have taken place in many regions around the world, often focusing on areas with large AOD. In Fig. 7 we have included data from regions close to three aerosol campaigns (INDOEX, SAFARI 2000, and SHADE). The agreement between the satellite re-trievals is best when AOD is generally low, and largest dif-ferences are found when AOD is high. In particular, the large biomass burning events in Indonesia in October 97 and Mex-ico in May 98 reveal the largest differences between the satel-lite retrievals. Actually, the differences can be as large as a factor 3–4. In regions dominated by industrial pollution
40 Regional episodes of high AOD
0.0 0.1 0.2 0.3 0.4 0.5 0.6 0.7 0.8 1 2 3 4 5 6 7 8 9 10 11 12 13 14 R e gi on al A v e rag e A O D 5 5 0 nm
AVHRR-1(2g) AVHRR-2 TOMS SeaWiFS
VIRS GOME/ATSR-2 MODIS MISR
Figure 7: Comparison of AOD from satellite retrievals for episodes with high AOD and for periods of aerosol campaigns, 1) Europe Atlantic Coast, Apr 99, 2) Mediterranean Sea, Aug 99, 3) Mediterranean Sea, Aug 00, 4) Cape Verde Plateau, Jun 99, 5) Cape Verde Plateau, Sep 00 (period of SHADE), 6) Angola Coast, Aug 98, 7) Angola Coast, Aug 00 (period of SAFARI2000), 8) Indian Coast, Mar 99 (period of INDOEX), 9) Indonesia, Oct 97, 10) China Sea, May 99, 11) China Sea Mar 00, 12) Mexico, May 98, 13) East Coast USA, May 98, 14) East Coast USA, May 00.
Fig. 7. Comparison of AOD from satellite retrievals for episodes with high AOD and for periods of aerosol campaigns, 1) Europe Atlantic Coast, Apr 99, 2) Mediterranean Sea, Aug 99, 3) Mediter-ranean Sea, Aug 00, 4) Cape Verde Plateau, Jun 99, 5) Cape Verde Plateau, Sep 00 (period of SHADE), 6) Angola Coast, Aug 98, 7) Angola Coast, Aug 00 (period of SAFARI2000), 8) Indian Coast, Mar 99 (period of INDOEX), 9) Indonesia, Oct 97, 10) China Sea, May 99, 11) China Sea Mar 00, 12) Mexico, May 98, 13) East Coast USA, May 98, 14) East Coast USA, May 00.
the results are generally similar or in better agreement than for global mean conditions. One explanation for the differ-ence in the monthly mean AOD during events of high AOD is different sampling. This is related to different swath width and time of overpass that influence the cloud screening and glint mask. Therefore, we can expect that sampling issues are more evident in a small region with high variability than in the large temporal or spatial averages. The relative dif-ferences in AOD for the retrievals were greater for SAFARI 2000 than for INDOEX and SHADE, even when considering only the four retrievals with observations in all campaigns. The AOD was also larger for the region close to SAFARI 2000 than for the INDOEX and SHADE regions. AVHRR-2 and SeaWiFS have usually the lowest values, most likely linked to the upper threshold values for AOD. For the cases including MODIS and MISR data these two retrievals have high AOD, and the agreement between them is good and generally better than the agreement between any other two retrievals.
4 Comparison of AOD between aerosol satellite re-trievals and AERONET
A large advantage compared to Myhre et al. (2004) is that in this study a much larger set of AERONET observations are available for comparison with the satellite retrievals. This is both due to a longer time period of investigation and to the fact that more AERONET stations were in operation.
41
Azores 0.0 0.2 0.4 0.6 0.8 S ep 97 Jan 98 Ma y 9 8 S ep 98 Jan 99 Ma y 9 9 S ep 99 Jan 00 Ma y 0 0 S ep 00 A O D 550 nm Gotland 0.0 0.2 0.4 0.6 S ep 97 Jan 98 Ma y 9 8 S ep 98 Jan 99 Ma y 9 9 S ep 99 Jan 00 Ma y 0 0 S ep 00 A O D 550 nm Helgoland 0.0 0.5 1.0 1.5 S ep 97 Jan 98 Ma y 9 8 S ep 98 Jan 99 Ma y 9 9 S ep 99 Jan 00 Ma y 0 0 S ep 00 A O D 550 nm Erdemli 0.0 0.2 0.4 0.6 0.8 1.0 S ep 97 Jan 98 Ma y 9 8 S ep 98 Jan 99 Ma y 9 9 S ep 99 Jan 00 Ma y 0 0 S ep 00 A O D 550 nm Kolimbari 0.0 0.5 1.0 1.5 S ep 97 Jan 98 Ma y 9 8 S ep 98 Jan 99 Ma y 9 9 S ep 99 Jan 00 Ma y 0 0 S ep 00 A O D 550 nm Rame Head 0.0 0.2 0.4 0.6 0.8 S ep 97 Jan 98 Ma y 9 8 S ep 98 Jan 99 Ma y 9 9 S ep 99 Jan 00 Ma y 0 0 S ep 00 A O D 550 nm Bahrain 0.0 0.5 1.0 1.5 2.0 S ep 97 Jan 9 8 Ma y 9 8 S ep 98 Jan 9 9 Ma y 9 9 S ep 99 Jan 0 0 Ma y 0 0 S ep 00 A O D 550 nm Venice 0.0 0.2 0.4 0.6 0.8 1.0 1.2 S ep 9 7 J an 98 Ma y 9 8 S ep 9 8 J an 99 Ma y 9 9 S ep 9 9 J an 00 Ma y 0 0 S ep 0 0 A O D 550 nm Dakar 0.0 0.5 1.0 1.5 S ep 97 Jan 98 May 98 S ep 98 Jan 99 May 99 S ep 99 Jan 00 May 00 S ep 00 A O D 550 nm Capo Verde 0.0 0.2 0.4 0.6 0.8 1.0 S ep 97 Jan 98 May 98 S ep 98 Jan 99 May 99 S ep 99 Jan 00 May 00 S ep 00 A O D 550 nm Ascension Island 0.0 0.1 0.2 0.3 0.4 S ep 97 Jan 98 May 98 S ep 98 Jan 99 May 99 S ep 99 Jan 00 May 00 S ep 00 A O D 550 nm Wallops 0.0 0.2 0.4 0.6 0.8 Se p 9 7 J an 98 May 98 Se p 9 8 J an 99 May 99 Se p 9 9 J an 00 May 00 Se p 0 0 A O D 550 nm Dry Tortugas 0.0 0.1 0.2 0.3 0.4 0.5 0.6 S ep 97 Jan 98 Ma y 9 8 S ep 98 Jan 99 Ma y 9 9 S ep 99 Jan 00 Ma y 0 0 S ep 00 A O D 550 n m Barbados 0.0 0.1 0.2 0.3 0.4 0.5 0.6 S ep 9 7 J an 98 Ma y 9 8 S ep 9 8 J an 99 Ma y 9 9 S ep 9 9 J an 00 Ma y 0 0 S ep 0 0 A O D 550 nm Bermuda 0.0 0.1 0.2 0.3 0.4 S ep 9 7 J an 98 Ma y 9 8 S ep 9 8 J an 99 Ma y 9 9 S ep 9 9 J an 00 Ma y 0 0 S ep 0 0 A O D 550 nm Roosevelt Roads 0.0 0.2 0.4 0.6 0.8 1.0 S ep 97 Jan 98 Ma y 9 8 S ep 98 Jan 99 Ma y 9 9 S ep 99 Jan 00 Ma y 0 0 S ep 00 A O D 550 nm Andros Island 0.0 0.2 0.4 0.6 0.8 Se p 9 7 J an 98 May 98 Se p 9 8 J an 99 May 99 Se p 9 9 J an 00 May 00 Se p 0 0 A O D 550 nm AVHRR-1(2g) AVHRR-2 TOMS SeaWiFS AVHRR-1(3g/QC) VIRS GOME/ATSR-2 MODIS MISR Aeronet Level 1.5 Aeronet La Paguera 0.0 0.1 0.2 0.3 0.4 0.5 0.6 S ep 97 Jan 9 8 Ma y 98 S ep 98 Jan 9 9 Ma y 99 S ep 99 Jan 0 0 Ma y 00 S ep 00 A O D 550 nmFig. 8. Monthly mean AOD from AERONET and nine satellite retrievals. The satellite data are for 550 nm, while the AERONET data are mean values of AOD at 440 and 670 nm (500 and 670 at some stations). Note the different scales for AOD at different stations.
G. Myhre et al.: Intercomparison of satellite retrieved aerosol optical depth 1709 42 San Nicolas 0.0 0.1 0.2 0.3 0.4 0.5 S ep 9 7 J a n 98 Ma y 9 8 S ep 9 8 J a n 99 Ma y 9 9 S ep 9 9 J a n 00 Ma y 0 0 S ep 0 0 A O D 550 nm Arica 0.0 0.5 1.0 1.5 Se p 9 7 J an 98 May 98 Se p 9 8 J an 99 May 99 Se p 9 9 J an 00 May 00 Se p 0 0 A O D 55 0 nm Lanai 0.0 0.2 0.4 0.6 0.8 S ep 9 7 J a n 98 Ma y 9 8 S ep 9 8 J a n 99 Ma y 9 9 S ep 9 9 J a n 00 Ma y 0 0 S ep 0 0 A O D 550 nm Tahiti 0.0 0.1 0.2 0.3 0.4 Se p 9 7 J an 9 8 May 9 8 Se p 9 8 J an 9 9 May 9 9 Se p 9 9 J an 0 0 May 0 0 Se p 0 0 A O D 550 n m Nauru 0.0 0.1 0.2 0.3 0.4 S ep 97 Jan 98 Ma y 9 8 S ep 98 Jan 99 Ma y 9 9 S ep 99 Jan 00 Ma y 0 0 S ep 00 A O D 550 n m Anmyon 0.0 0.2 0.4 0.6 0.8 1.0 S ep 97 Jan 9 8 May 9 8 S ep 98 Jan 9 9 May 9 9 S ep 99 Jan 0 0 May 0 0 S ep 00 A O D 550 nm Taiw an 0.0 0.2 0.4 0.6 0.8 1.0 S e p 97 Ja n 9 8 Ma y 9 8 S e p 98 Ja n 9 9 Ma y 9 9 S e p 99 Ja n 0 0 Ma y 0 0 S e p 00 A O D 55 0 nm Male 0.0 0.2 0.4 0.6 0.8 S ep 9 7 J a n 98 Ma y 9 8 S ep 9 8 J a n 99 Ma y 9 9 S ep 9 9 J a n 00 Ma y 0 0 S ep 0 0 A O D 550 nm AVHRR-1(2g) AVHRR-2 TOMS SeaWiFS AVHRR-1(3g/QC) VIRS GOME/ATSR-2 MODIS MISR Aeronet Level 1.5 Aeronet Kaashidhoo 0.0 0.1 0.2 0.3 0.4 0.5 0.6 S ep 9 7 J a n 98 Ma y 9 8 S ep 9 8 J a n 99 Ma y 9 9 S ep 9 9 J a n 00 Ma y 0 0 S ep 0 0 A O D 550 nm Dongsha Island 0.0 0.2 0.4 0.6 0.8 S e p 97 Ja n 9 8 Ma y 9 8 S e p 98 Ja n 9 9 Ma y 9 9 S e p 99 Ja n 0 0 Ma y 0 0 S e p 00 A O D 55 0 nm Coconut Island 0.0 0.2 0.4 0.6 0.8 S ep 97 Jan 98 Ma y 9 8 S ep 98 Jan 99 Ma y 9 9 S ep 99 Jan 00 Ma y 0 0 S ep 00 A O D 550 nm Shirahama 0.0 0.2 0.4 0.6 0.8 S ep 97 Jan 98 Ma y 9 8 S ep 98 Jan 99 Ma y 9 9 S ep 99 Jan 00 Ma y 0 0 S ep 00 A O D 55 0 nm Goa 0.0 0.2 0.4 0.6 0.8 1.0 S ep 9 7 J a n 98 Ma y 9 8 S ep 9 8 J a n 99 Ma y 9 9 S ep 9 9 J a n 00 Ma y 0 0 S ep 0 0 A O D 550 nm Inhaca 0.0 0.1 0.2 0.3 0.4 0.5 0.6 S ep 9 7 J a n 98 Ma y 9 8 S ep 9 8 J a n 99 Ma y 9 9 S ep 9 9 J a n 00 Ma y 0 0 S ep 0 0 A O D 550 nm Sw akopmund 0.0 0.5 1.0 1.5 2.0 Se p 9 7 J an 9 8 May 9 8 Se p 9 8 J an 9 9 May 9 9 Se p 9 9 J an 0 0 May 0 0 Se p 0 0 A O D 550 nm
Figure 8: Monthly mean AOD from AERONET and nine satellite retrievals. The satellite data are for 550 nm, while the AERONET data are mean values of AOD at 440 and 670 nm (500 and 670 at some stations). Note the different scales for AOD at different stations.
Fig. 8. Continued.
Validations of the individual aerosol satellite retrievals have been performed for several of the satellite products (e.g. Stowe et al., 2002; Torres et al., 2002; Remer et al., 2002; Holzer-Popp et al., 2002b; Kahn et al., 2005; Liu et al. 2004). Comparison between the satellite retrievals and the AERONET as a function of time is shown in Fig. 8 for the 33 stations listed in Table 2. In general a good agreement is found between the AERONET and satellite retrievals, and
seasonal and inter-annual variations seen in the AERONET data are mainly captured also in the satellite data. The best agreement between the AERONET data and the satel-lite retrievals are probably found at Wallops, Barbados, and Bermuda, whereas at Dakar significant differences are found in the first part of the period where we use the less validated AERONET level 1.5 data.
43 -0.2 0.0 0.2 0.4 0.6 0.8 1.0 Ar ic a B ahr ai n B a rbad os Be rm u d a Ca p o V e rd e D ry T o rt ug as K a as hi dh oo L ana i Sa n N ic o la s Ve n ic e Wa llo p s AERONET Mean AERONET Std. Deviation AVHRR-2 Mean AVHRR-2 Std. Deviation
AVHRR-2 Correlation coefficient (Pearson)
-0.2 0.0 0.2 0.4 0.6 0.8 1.0 Ar ic a B a hr ai n B a rbad os Be rm u d a C apo V e rd e D ry T o rt ug as K aas hi dh oo La na i S an N ic o la s Ve n ic e Wa llo p s AERONET Mean AERONET Std. Deviation TOMS Mean TOMS Std. Deviation
TOMS Correlation coefficient (Pearson)
0.0 0.2 0.4 0.6 0.8 1.0 Ar ic a B a hr ai n B a rbad os Be rm u d a C apo V e rd e D ry T o rt ug as K aas hi dh oo La na i S an N ic o la s Ve n ic e Wa llo p s AERONET Mean AERONET Std. Deviation SeaWiFS Mean SeaWiFS Std. Deviation
SeaWiFS Correlation coefficient (Pearson) 0.0 0.2 0.4 0.6 0.8 1.0 Ar ic a B a hr ai n B a rb ad os Be rm u d a Ca p o V e rd e D ry T o rt uga s K a as hi dh oo La na i Sa n N ic o la s Ve n ic e Wa llo p s AERONET Mean AERONET Std. Deviation AVHRR-1(2g) Mean AVHRR-1(2g) Std. Deviation
AVHRR-1(2g) Correlation coefficient (Pearson)
0.0 0.2 0.4 0.6 0.8 1.0 Ar ic a B a hr ai n B a rb ad os Be rm u d a Ca p o V e rd e D ry T o rt ug as K a as hi d h o o La nai Sa n N ic o la s Ve n ic e Wa llo p s AERONET Mean AERONET Std. Deviation MODIS Mean MODIS Std. Deviation
MODIS Correlation coefficient (Pearson)
-0.2 0.0 0.2 0.4 0.6 0.8 1.0 Ar ic a B a hr ai n B a rb ad os Be rm u d a Ca p o V e rd e D ry T o rt ug as K a as hi d h o o La nai Sa n N ic o la s Ve n ic e Wa llo p s AERONET Mean AERONET Std. Deviation MISR Mean MISR Std. Deviation
MISR Correlation coefficient (Pearson)
Figure 9: AERONET and satellite mean AOD and standard deviation and the correlation coefficient between the satellite retrieval and AERONET data. 11 stations and six satellite retrievals (one in each panel) are included.
Fig. 9. AERONET and satellite mean AOD and standard deviation and the correlation coefficient between the satellite retrieval and AERONET data. 11 stations and six satellite retrievals (one in each panel) are included.
In Fig. 9 a subset of the AERONET stations with longest time series of observations are further studied. Mean and standard deviation for the AERONET data and satellite re-trievals are given in the figure, as well as the corresponding correlation coefficient for each station. No obvious system-atic differences in the satellite retrievals in their comparison with the AERONET averages are apparent. At Lanai and San
Nicolas the mean AOD is higher in all the satellite retrievals compared to the AERONET data. Otherwise no systematic differences can be found for the mean AOD. The standard deviation is smaller or equal in the AERONET data than in the satellite retrievals at Lanai and San Nicolas. SeaWiFS has in often the lowest standard deviations of the seven data sets. The correlation coefficient is usually high and there are no
G. Myhre et al.: Intercomparison of satellite retrieved aerosol optical depth 1711 specific AERONET stations with a consistently low
correla-tion coefficient. Bermuda, Bahrain, and Wallops are stacorrela-tions with the generally highest correlation coefficient, whereas for many of the satellite retrievals it is low at San Nicolas.
Note here that we use a rather large spatial resolution as described in Appendix 1 and the sub-scale spatial variation in AOD can be significant. In particular variation in relative humidity can influence the spatial variation (Haywood et al., 1997; Myhre et al., 2002; Anderson et al., 2003) as water uptake increases the AOD for hygroscopic aerosols consid-erably. Relative humidity is frequently higher close to clouds than in clear sky, and thus AOD may be higher closer to clouds. This is in fact what is found based on AERONET and cloud observations in Kaufman et al. (2002b) and also pointed out by Ignatov and Nalli (2002) and Ignatov et al. (2004) to be a possible explanation. On the other hand, clouds also wash out aerosols, reducing the AOD close to clouds. Koch et al. (2003) found that over land in Europe and North America that clouds and sulfate aerosols are anti-correlated, indicating that clouds are more efficient in wash-ing out sulfate aerosols than in contributwash-ing to aqueous-phase production of sulfate aerosols. However, in which way AOD varies close to clouds should be investigated further, since there could be large regional variations and differences be-tween cloud types and aerosol types. AERONET measure-ments are taken regularly when clouds are not present. In contrast, satellite retrievals occur in clear and cloudy sky con-ditions and cloud-screening procedure is the applied. This leads to analyze more instances over regions in the vicinity of clouds than in AERONET measurements.
Figure 10 shows scatter plots of the satellite retrievals against AERONET data for all the 33 stations included in this study. Note that for the eight retrievals shown in this figure the time period varies for which analysis are performed, and that we have removed level 1.5 data in the scatter plot anal-ysis. There is a tendency that the satellite retrievals have a weak overestimation compared to AERONET for low AOD, but often underestimate high AOD from AERONET. This pattern varies significantly between the various retrievals. SeaWiFS has a good agreement with the AERONET data for low AOD, but the largest underestimation among the satellite data sets for high AERONET AOD values. This is what can be expected since this retrieval has a threshold value for AOD. TOMS has a very few high AOD values that are clear overestimates compared to the AERONET data. AVHRR-1, AVHRR-2, and VIRS differ also most compared to AERONET for high AOD values. MODIS and MISR have relatively more high AOD values than AERONET values compared to the other retrievals. However, these scatter plots reveal that particularly MODIS and partly MISR generally compare better to AERONET than the rest of the retrievals. Also AVHRR-1 has a slope indicating a good agreement with AERONET given all the uncertainties in this comparison which is based on monthly mean data. The two versions of AVHRR-1 differ significantly, due to different sampling and
retrieval procedures used. Two issues regarding this analysis need to be emphasized. The AERONET data used in Fig. 10 are not the same for all retrievals due to differences in time periods. Considering only data in the 10 months period in 2000 impacts the results for AVHRR-1, AVHRR-2, TOMS, and SeaWifs compared to AERONET data to a limited ex-tent. On the other hand including level 1.5 in this scatter analysis would reduce the agreement for these four retrievals with the AERONET data, in particular the underestimation of high AOD values.
When considering monthly means in the comparison of satellite retrievals with AERONET, data sampling issues are important. For the AERONET measurements high frequency data are averaged to daily means. However, the number of days that are included in the AERONET monthly mean of AOD is highly variable. Especially three AERONET monthly data points differ from the satellite retrievals, and they are all based on less than three days of measurements during the whole month. These are Dakar (1 day in Au-gust 2000), Taiwan (2 days in October 2000), and Rame Head (3 days in September 1998). Removing these data points from the analysis increased the slope of the regression-line for all satellite retrievals, except for VIRS and AVHRR-1(3g/QC). For the other retrievals the slope of the regression-line changed from 0.04 to 0.26, with the largest change for MODIS and thereafter MISR. Further, removing all AERONET data with less than three days of measurements during the whole month (30 out of a total of 488 data points) had a relatively small impact, less than 0.05 change in the slope of the regression-line compared to the case when only the three data points discussed above were removed. In most the cases the monthly mean data are based on more than 10 days of measurements. This is the case in 375 of the 488 AERONET monthly mean data used in this study.
For AVHRR-1(2g) a large difference from AERONET oc-curs mainly at Bahrain, in addition to the cases discussed above. However, removing the data points from Bahrain in the analysis influences the slope of the regression-line only to a small extent. For AVHRR-2, TOMS, and SeaWiFS there are no stations with particularly large differences compared to AERONET. For MISR a few AERONET stations reduce the slope of the regression-line significantly. These are in particular Helgoland and Gotland, and to some extent Tai-wan (October 2000 as mentioned above). Removing these data from the analysis for MISR resulted in a regression-line slope of around 0.85 (also shown in Fig. 10), which is a typical value found in the global MISR validation pa-per by Kahn et al. (2005). The high MISR values at Hel-goland and Gotland for MISR can be seen in Figs. 8 and 1c. The high values found in the North Sea for MISR are probably related to cloud screening and to the use of a cli-matology of the near-surface wind speed for the ocean white cap model. This may yield too high AOD under high wind events under cloud-free conditions (Kahn et al., 2005). Re-moving the same values in the analysis for MODIS as for
44
y = 0.67x + 0.07 (y = 0.68x + 0.07) 0.0 0.2 0.4 0.6 0.8 1.0 0.0 0.2 0.4 0.6 0.8 1.0 AERONET A V H R R -1( 2g ) y = 0.40x + 0.11 (y = 0.44x + 0.10) 0.0 0.2 0.4 0.6 0.8 1.0 0.0 0.2 0.4 0.6 0.8 1.0 AERONET A V HR R-2 y = 0.56x + 0.14 0.0 0.2 0.4 0.6 0.8 1.0 0.0 0.2 0.4 0.6 0.8 1.0 AERONET TO M S y = 0.31x + 0.10 (y = 0.33x + 0.10) 0.0 0.2 0.4 0.6 0.8 1.0 0.0 0.2 0.4 0.6 0.8 1.0 AERONET Se a W iF S y = 0.37x + 0.15 0.0 0.2 0.4 0.6 0.8 1.0 0.0 0.2 0.4 0.6 0.8 1.0 AERONET A V H R R -1 (3 g /QC ) y = 0.50x + 0.15 0.0 0.2 0.4 0.6 0.8 1.0 0.0 0.2 0.4 0.6 0.8 1.0 AERONET VI R S y = 0.88x + 0.10 (y = 1.02x + 0.08) 0.0 0.2 0.4 0.6 0.8 1.0 0.0 0.2 0.4 0.6 0.8 1.0 AERONET MO D IS y = 0.70x + 0.15 (y = 0.84x + 0.11) 0.0 0.2 0.4 0.6 0.8 1.0 0.0 0.2 0.4 0.6 0.8 1.0 AERONET MI S RFig. 10. Scatter plot of monthly mean AOD for AERONET data vs. eight satellite retrievals. Satellite data are given for 550 nm, AERONET data are mean of 440 (500 for some stations) and 670 nm. Results are also shown when values from Helgoland, Gotland (all data), and Taiwan October 2000 are removed from the analysis (thin lines, and equations in parenthesis).
G. Myhre et al.: Intercomparison of satellite retrieved aerosol optical depth 1713 MISR increased the slope of the regression-line for MODIS
similar to MISR. Whereas, our comparison with AERONET is based on monthly mean data, the study of Abdou et al. (2005) compare coincident MISR and MODIS AOD with AERONET data during 3 month in 2002 with MISR show-ing an agreement with AERONET which is at least as good as for MODIS.
In Fig. 11 the scatter plots of AERONET data and the satellite retrievals are divided into three groups according to the AERONET ˚Angstr¨om exponent to identify whether differences are related to the size of the aerosols, which is indicative of aerosol type. For AVHRR-1 and TOMS the re-sults seem rather independent of the ˚Angstr¨om exponent. For AVHRR-2 the results indicate reduced agreement with the AERONET data for the smallest aerosols (high ˚Angstr¨om ex-ponent). In the case of the SeaWiFS data, Fig. 10 indicates an underestimation of large AOD from AERONET. Fig. 11 in-dicates that this is least pronounced for the smaller particles. For MODIS there is no systematic difference with ˚Angstr¨om exponent, whereas for MISR the agreement is best for the largest particles (small ˚Angstr¨om exponents). The values discussed above for MISR at Helgoland and Gotland, and Taiwan influence the analysis for the small particles.
5 Summary and discussion
In this study monthly mean aerosol optical depth (AOD) is compared from a total of nine aerosol retrievals during a 40 months period, from September 1997 to December 2000. We have identified that differences in various satellite retrievals are substantial and even larger than found in an earlier study based on five different aerosol retrievals during a period of eight months prior to the period analysed here. Aerosol re-mote sensing from space is a complicated task involving a wide range of physical processes that must be taken into account. Issues related to cloud screening are particularly important. It appears that one problem is that, in many re-trievals, the cloud screening is not strict enough resulting in AOD being contaminated by clouds. On the other hand it also appears that some aerosol retrievals are too strict, i.e. high aerosol loadings are classified as clouds and thus no aerosol information is retrieved. In this study we have seen examples of aerosol retrievals adopting upper threshold val-ues for AOD in an effort to avoid cloud influence. For small particles (e.g. from industrial pollution or biomass burning) this procedure could be improved by introducing an addi-tional criterion for the ˚Angstr¨om exponent. However, this is more difficult for larger particles (e.g. mineral dust and sea salt) with smaller ˚Angstr¨om exponents more similar to those of clouds. For example, retrieval of aerosol information under major dust episodes, where AOD can be significantly above 1.0 is particularly difficult. To distinguish heavy dust loads from clouds is difficult and multi channel information is needed. Dedicated aerosol satellite instruments have this
capacity and therefore this is a tractable problem for these retrievals. Additionally, in conditions of heavy dust loading, sunphotometers may screen out heavy dust loadings by miss-classification as cloud. During the SHADE campaign there was an indication that during the period of maximum AOD during a major dust storm, the procedure for processing level 1.5 to level 2 sunphotometer data led to rejection of much of the sun-photometer data (Haywood et al., 2003). Overall, it cannot be ruled out that both sunphotometers and satellite re-trievals miss-classify some of the major dust storms as clouds and thus are biased towards lower dust conditions.
Despite the fact that the differences in AOD are substan-tial, there are also many promising results. The agreement with regard to spatial and temporal distribution in AOD be-tween the two dedicated aerosol instruments in many of the subregions investigated in this study is impressing. This find-ing is both based on the averaged AOD and its variation in magnitude, as well as spatial and temporal correlation co-efficient. Furthermore, in several regions the other aerosol retrievals compare well to MODIS and MISR. It seems that for comparisons in smaller regions the agreement between the aerosol retrievals is best where the influence of only few aerosol types is typical.
The analysis performed in this study has been used to iden-tify regions with patterns of agreement and disagreement. The seasonal variation in AOD is well reproduced by the aerosol retrievals at Angola Basin, east coast of USA, Ara-bian Sea, and Red Sea. The magnitude of the seasonal varia-tion differs between the retrievals, but their timing of max-imum in AOD in June or July is very similar. For these four regions the main aerosol components vary substantially such as biomass burning aerosols, aerosols from fossil fuel use, and mineral dust. The spatial correlation in AOD for the aerosol retrievals shows also good results for three of these regions, namely Angola Basin, Arabian Sea, and Red Sea. In addition the spatial correlation at the Cape Verde Plateau is high between many of the retrievals. Several of the AERONET stations show good agreement. The pattern found at the stations Bahrain, Barbados, Bermuda, Venice, and Wallops are the most encouraging.
This study clearly shows that the disagreement between aerosol satellite retrievals is particularly large during events of large influence of aerosols, with differences in AOD over a factor of 3. Part of this difference arises from upper thresh-olds in AOD, but this can certainly not explain all the dif-ference. During the INDOEX campaign the difference in AOD between four of the retrievals was relatively small, and smaller than during the other major aerosol campaigns. It is noticeable that MODIS and MISR mostly have higher AOD during the events studies here than the other retrievals. We have identified the Caspian Sea as the region having the largest disagreement between the aerosol retrievals. This is in regard to the magnitude of AOD, its temporal variation, and spatial correlation. The spatial correlation between the aerosol satellite retrievals is very weak for the Caspian Sea
46
Ångst røm < 0.5 y = 0.70x + 0.08 0.0 0.2 0.4 0.6 0.8 1.0 0.0 0.2 0.4 0.6 0.8 1.0 AERONET A V H R R -1 2 g Ångst røm 0.5-1.5 y = 0.59x + 0.07 0.0 0.2 0.4 0.6 0.8 1.0 0.0 0.2 0.4 0.6 0.8 1.0 AERONET A V H R R -1 2 g Ångst røm > 1.5 y = 0.69x + 0.10 0.0 0.2 0.4 0.6 0.8 1.0 0.0 0.2 0.4 0.6 0.8 1.0 AERONET A V H R R -1 2 g Ångst røm < 0.5 y = 0.54x + 0.10 0.0 0.2 0.4 0.6 0.8 1.0 0.0 0.2 0.4 0.6 0.8 1.0 AERONET A V H R R -2 Ångst røm 0.5-1.5 y = 0.27x + 0.13 0.0 0.2 0.4 0.6 0.8 1.0 0.0 0.2 0.4 0.6 0.8 1.0 AERONET A V H R R -2 Ångst røm > 1.5 y = 0.46x + 0.10 0.0 0.2 0.4 0.6 0.8 1.0 0.0 0.2 0.4 0.6 0.8 1.0 AERONET A V H R R -2 Ångst røm < 0.5 y = 0.49x + 0.15 0.0 0.2 0.4 0.6 0.8 1.0 0.0 0.2 0.4 0.6 0.8 1.0 AERONET T O M S Ångst røm 0.5-1.5 y = 0.62x + 0.13 0.0 0.2 0.4 0.6 0.8 1.0 0.0 0.2 0.4 0.6 0.8 1.0 AERONET T O M S Ångst røm > 1.5 y = 0.69x + 0.12 0.0 0.2 0.4 0.6 0.8 1.0 0.0 0.2 0.4 0.6 0.8 1.0 AERONET T O M S Ångst røm < 0.5 y = 0.27x + 0.13 0.0 0.2 0.4 0.6 0.8 1.0 0.0 0.2 0.4 0.6 0.8 1.0 AERONET S e a W i F S Ångst røm 0.5-1.5 y = 0.29x + 0.11 0.0 0.2 0.4 0.6 0.8 1.0 0.0 0.2 0.4 0.6 0.8 1.0 AERONET S e a W i F S Ångst røm > 1.5 y = 0.47x + 0.06 0.0 0.2 0.4 0.6 0.8 1.0 0.0 0.2 0.4 0.6 0.8 1.0 AERONET S e a W i F S Ångst røm < 0.5 y = 0.98x + 0.09 0.0 0.2 0.4 0.6 0.8 1.0 0.0 0.2 0.4 0.6 0.8 1.0 AERONET M O D I S Ångst røm 0.5-1.5 y = 0.80x + 0.11 0.0 0.2 0.4 0.6 0.8 1.0 0.0 0.2 0.4 0.6 0.8 1.0 AERONET M O D I S Ångst røm > 1.5 y = 1.04x + 0.11 0.0 0.2 0.4 0.6 0.8 1.0 0.0 0.2 0.4 0.6 0.8 1.0 AERONET M O D I S Ångst røm < 0.5 y = 0.80x + 0.15 0.0 0.2 0.4 0.6 0.8 1.0 0.0 0.2 0.4 0.6 0.8 1.0 AERONET M I S R Ångst røm 0.5-1.5 y = 0.58x + 0.16 0.0 0.2 0.4 0.6 0.8 1.0 0.0 0.2 0.4 0.6 0.8 1.0 AERONET M I S R Ångst røm > 1.5 y = 0.49x + 0.16 0.0 0.2 0.4 0.6 0.8 1.0 0.0 0.2 0.4 0.6 0.8 1.0 AERONET M I S RFig. 11. Scatter plot of monthly mean AOD for AERONET data vs. satellite retrievals. The analysis is divided into three groups depending on the AERONET ˚Angstr¨om exponent.
G. Myhre et al.: Intercomparison of satellite retrieved aerosol optical depth 1715 48 y = 0.8112x + 0.0334 0.0 0.2 0.4 0.6 0.8 1.0 1.2 0.0 0.2 0.4 0.6 0.8 1.0 1.2 MODIS Centre M O D IS Av e ra g e y = 0.8694x + 0.1375 y = 0.8801x + 0.1089 0.0 0.2 0.4 0.6 0.8 1.0 1.2 0.0 0.2 0.4 0.6 0.8 1.0 1.2 AERONET MO D IS
MODIS Centre MODIS Average
0.0 0.2 0.4 0.6 0.8 1.0 1.2 A n dr o s I s la nd An m y o n Ar ic a A s c e n s io n I s la n d Az o re s Ba h ra in B a rb ad os Be rm u d a Ca p o V e rd e C o c o nu t I s la nd Da k a r D o n g s h a I s la nd D ry T o rt ug as Er d e m li Go a Go tla n d He lg o la n d In ha c a Ko lim b a ri K a as hi d h o o La P agu er a Lan ai Mal e Na u ru NC U T a iw a n Ra m e He a d R o o s ev el t R o ad s Sa n N ic o la s S h ir a ham a S w ak op m u n d Ta h iti Ve n ic e Wa llo p s
Slope Correlation coefficient
Figure A1a: Scatter plot of AOD in grid squares where AERONET stations are located (MODIS Centre) and average AOD for nine grid squares where the AERONET stations are located in the centre square (MODIS Average).
Figure A1b: Scatter plot of AOD from AERONET and AOD from MODIS grid squares where the AERONET stations are located (MODIS Centre) and AOD average for nine grid
Fig. A1. (A1a) Scatter plot of AOD in grid squares where AERONET stations are located (MODIS Centre) and average AOD for nine grid squares where the AERONET stations are located in the centre square (MODIS Average). (A1b) Scatter plot of AOD from AERONET and AOD from MODIS grid squares where the AERONET stations are located (MODIS Centre) and AOD average for nine grid squares where the AERONET stations are located in the centre grid square (MODIS Average). (A1c) Slope and correlation resulting from a regression analysis between AOD from MODIS grid squares where the AERONET stations are located (MODIS Centre) and AOD average for nine grid squares where the AERONET stations are located in the centre grid square (MODIS Average). Results are given for each of the AERONET stations.
and for MODIS and MISR it is even weakly anti-correlated. The Black Sea and Mediterranean Sea are also regions with poor agreement. Particularly large differences between the satellite retrievals are found over remote oceanic regions, in particular at high latitudes southern hemisphere at the edge of possible retrieval of aerosols. The agreement with AERONET data seems particularly poor at Gotland, Hel-goland, Rame Head, and Taiwan.
Comparisons with AERONET data reveal differences among the satellite aerosol retrievals, with MODIS data giv-ing generally the best agreement. Also MISR and AVHRR-1 compare very well against the AERONET data. Note here that the comparison between AERONET and satellite re-trievals is based on monthly mean data, so that many factors may influence the comparison such as sampling and cloud screening. A more detailed comparison with AERONET data should be based on daily data, to explore differences and evaluate different aerosol retrievals.
The two retrievals especially suited for aerosol monitor-ing (MODIS and MISR) are in general in better agreement with AERONET. This is not surprising given fewer limita-tions (Table 1) compared to the other aerosol retrievals in-vestigated. MISR data have been shown to be in even better agreement with AERONET over inland areas on a daily ba-sis (Abdou et al., 2005) compared to the agreement between the two found here for oceanic and coastal areas. Limita-tions like fixed aerosol microphysical models (AVHRR-1 and VIRS), large pixel sizes (TOMS and GOME/ATSR2), and cutoff thresholds for AOD (SeaWiFS and AVHRR-2) are fac-tors that in certain regions impact the quality of the retrievals. However, AVHRR-1 compares well with MODIS and MISR in many coastal regions and with AERONET data. Further, AVHRR-1 and TOMS are generally in best agreement with MODIS and MISR during episodes of large AOD, and in ad-dition AVHRR-2 has a pattern and magnitude of AOD south of 30 S that is quite similar to MODIS and MISR. For better