HAL Id: hal-00316205
https://hal.archives-ouvertes.fr/hal-00316205
Submitted on 1 Jan 1996
HAL is a multi-disciplinary open access
archive for the deposit and dissemination of sci-entific research documents, whether they are pub-lished or not. The documents may come from teaching and research institutions in France or abroad, or from public or private research centers.
L’archive ouverte pluridisciplinaire HAL, est destinée au dépôt et à la diffusion de documents scientifiques de niveau recherche, publiés ou non, émanant des établissements d’enseignement et de recherche français ou étrangers, des laboratoires publics ou privés.
Synoptic-scale fluctuations of total ozone in the
atmosphere
A. Galliani, A. M. Siani, N. J. Muthama, S. Palmieri
To cite this version:
A. Galliani, A. M. Siani, N. J. Muthama, S. Palmieri. Synoptic-scale fluctuations of total ozone in the atmosphere. Annales Geophysicae, European Geosciences Union, 1996, 14 (10), pp.1044-1050. �hal-00316205�
Ann. Geophysicae 14, 1044—1050 (1996) ( EGS — Springer-Verlag 1996
Synoptic-scale fluctuations of total ozone in the atmosphere
A. Galliani1, A. M. Siani1, N. J. Muthama2, S. Palmieri1
1 Physics Department, University of Rome ‘‘La Sapienza’’, P. le A. Moro, 2-00185, Rome, Italy 2 Department of Meteorology, University of Nairobi, P.O. Box 30197, Nairobi, Kenya Received: 25 July 1995/Revised: 13 May 1996/Accepted: 21 May 1996
Abstract. A model, based on ozone-concentration tenden-cy equation, is developed to study synoptic ozone-column variations. The application is referred to a middle-latitude site and to an atmospheric layer extending from the sur-face up to about 35-km altitude. Photochemical effects at the considered location for synoptic time scales are con-sidered negligible. The data input consists of umkehr ozone profile, total ozone (obtained by Brewer No. 067, located at Rome) and horizontal wind at various levels. Analysis of several cases indicates that meridional advec-tion is the main factor responsible for the observed synop-tic-scale ozone fluctuations.
1 Introduction
The importance of synoptic-scale fluctuations in the at-mospheric ozone concentration is twofold. First, UVB irradiance is linked with the day-to-day ozone changes; a 1% decrease in total ozone can cause about 1.5—2% increase in damaging UV dose at ground level (Pyle and Derwent, 1980; Siani, 1995). Second, ozone may be con-sidered a good tracer of stratospheric motions. By analys-ing O3 local time changes, a better understandanalys-ing of the stratosphere dynamics may be achieved. Middle-latitude ozone variability, at time scales of 1—3 days, depends primarily on the transport by atmospheric motions (Dob-son and Harri(Dob-son, 1926; Dob(Dob-son, 1930). Weather systems at middle and high latitudes affect the stratosphere and the tropopause height, which in turn may influence the ozone-layer thickness. In western Europe an ozone-con-centration maximum is often present in the rear side of a cyclone at the passage of a cold front, while a minimum may be found in the south-west sector of a high-pressure area close to the warm front (Go¨tz, 1951).
Correspondence to: S. Palmieri
The problem of modelling and predicting synoptic-scale ozone changes may be faced by means of statistical schemes taking into account the relationship between O3 and other meteorological quantities, like temperature and geopotential height (Poulin and Evans, 1994; Vogel
et al., 1995). Alternatively, dynamical models,
involv-ing trajectory techniques (Go¨tz, 1951) or potential vorticity (Vaughan and Price, 1991), were proposed to interpret and possibly predict day-to-day ozone-column variations. In this paper a preliminary model for the analysis of synoptic-scale ozone-column fluctuations at middle latitudes, based on the O3 tendency equation, is proposed.
2 The ozone tendency equation
In order to analyse synoptic-scale ozone fluctuations, a scheme, based on the tendency equation and combining the continuity equations for air and ozone, is outlined. The ozone tendency equation may be written:
NA
k
A
LoOLt3#+o · (oO3»o2)#oL(sw)
Lz
B
"S!P, (1) where o is the air density, oO3 is the ozone density, s
is the ozone mass mixing ratio, NA is the number of Avogadro, »o2 and w are the horizontal- and vertical-wind velocity, S and P are, respectively, photo-chemical sources and sinks. Integrating Eq. 1 in a column of unit area, from surface to the top of the atmosphere, we obtain NA k
A
= : 0 LoO3 Lt dz# = : 0+o2 ·(oO3 »o2)dz#=: 0o L(sw) Lz dzB
"SI !PI. (2)Assuming that at middle latitudes synoptic total-ozone variations are mainly due to the atmospheric disturbances between the ground and the first 35 km of height (Holton,
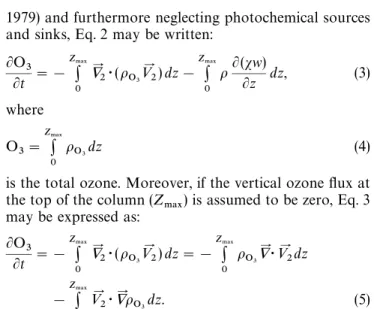
1979) and furthermore neglecting photochemical sources and sinks, Eq. 2 may be written:
LO3 Lt "! Z.!9 : 0 +o2·(oO3 »o2)dz!Z .!9 : 0 o L(sw) Lz dz, (3) where O3"Z.!9: 0 oO3 dz (4)
is the total ozone. Moreover, if the vertical ozone flux at the top of the column (Z.!9) is assumed to be zero, Eq. 3 may be expressed as:
LO3 Lt "!Z .!9 : 0 +o2·(oO3 »o2)dz"!Z:.!9 0 oO3+o · »o2dz !Z .!9 : 0 »o2·+ooO 3dz. (5)
It is important to note that O3 vertical exchanges tween different layers below Z.!9 are not negligible, be-cause the ozone, entering through the column sides at any height, may be distributed vertically along all the column. For the sake of brevity, the first integral on the right side (divergence term) will from now on be indicated as ‘D’ while the second integral (advection term) will be identified as ‘A’. To estimate daily ozone variations by means of the de-scribed scheme, it is necessary to know the wind velocity profile, as well as the O3 vertical distribution together with their horizontal gradients along x and y directions.
3 Model application and results
The model is applied to Rome-station data, considering the atmosphere, from ground to Z.!9 (32 km), divided into eight 4-km-thick layers. The proposed scheme requires the following input:
— total-ozone values to compute time derivatives
(spectro-photometric O3 measurements at the Rome station are used);
— vertical O3 profile; in this case data for the Rome stationwere obtained by means of the Umkehr technique; — total-ozone horizontal gradients; in this application
a grid-mesh centred at Rome, with a spacing suitable to characterise the large synoptic scale (400 km) was as-sumed. Total-ozone fields over Europe were provided by WMO GO3 OS Ozone Mapping Centre (LAP, Thessaloniki). In the relatively small area being con-sidered, ozone gradients in each layer were computed assuming:
O3,i,k"Pk ·O3,i,
where O3 is the total ozone, i indicates the grid point,
k is a layer index and Pk is a proper weight derived on
the basis of the observed vertical profile (Pk \ O3,k/O3);
— horizontal-velocity gradients in each layer; all the
avail-able observational data, with special attention to the 300-hPa level, are considered; moreover mean profiles of horizontal velocity are used to complete the data set.
Table 1. Values of the correlation coefficients between the time ozone variation and the terms of the horizontal advection along the
x and y directions (Ax and Ay, respectively) and of
horizontal-velocity divergence (Dx and Dy, respectively); significance level 5%
rAx rAy rDx rDy
0.3 0.8 !0.2 0.1
Table 2. Ax and Ay are the horizontal advection along x and y, Dx and Dy are the terms of the horizontal-velocity divergence along
x and y,DO3/Dt is the ozone time variation, S is the sum of the four
terms representing horizontal advection and divergence. All the quantities are expressed in units of 106 molecules cm~3 s~1 Day LO3/Lt Ax Ay Dx Dy S
24/12/92 25.8 32.5 !0.3 !2.5 !0.1 29.6 06/03/93 !46.3 6.4 !51.1 !0.7 2.6 !42.8 05/12/93 12.9 5.9 !4.6 16.8 !2.4 15.7
The present preliminary application is referred to a lim-ited number of cases (22), characterised by either increas-ing or decreasincreas-ing total ozone for three consecutive days. Results appear to be quite encouraging and consistent both with experience and physical reasoning. Neverthe-less, the statistical significance should be assessed on a lar-ger data base.
In Table 1 the values of the correlation coefficients between the time ozone variation and the terms of the horizontal advection along the x and y direction (Ax and Ay, respectively) and of horizontal-velocity divergence (Dx and Dy, respectively) are reported. The analysis of all collected cases indicates that horizontal meridional
advec-tion is the most effective factor in determining the
observed day-to-day ozone changes. Three cases of parti-cular interest are sorted and discussed. The first is charac-terised by a marked O3 horizontal zonal advection which produces a definite positive ozone change; in the second case a negative, rather unusual, meridional O3 gradient brings about a local ozone decrease the considered side; in the third situation horizontal-velocity convergence in the zonal direction produces a positive ozone change.
In Table 2 an estimate of the various terms, appearing in Eq. 5, is provided. A detailed discussion of each case follows.
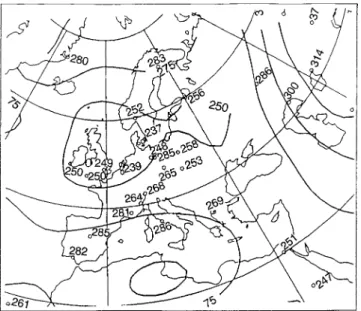
3.1 24 December 1992
A positive time change in the ozone amount (25.8] 106 molecules cm~3 s~1) is recorded in the period 23—25 December. A negative gradient (west-east direction) in the ozone field is discernible (Fig. 1). The 300-hPa map (Fig. 2) shows a low-pressure area centred over Spain responsible for the eastward export of ozone-rich air. Ozone- and wind-velocity profiles are presented in Fig. 3: wind speed in the x direction is relatively large, indicating the existence of a jet stream at the tropopause level and in A. Galliani et al.: Synoptic-scale fluctuations of total ozone in the atmosphere 1045
Fig. 2. 24 December 1992; 300-hPa map (Courtesy of European Meteorological Bulletin, Germany) Fig. 1. 24 December 1992; ozone map (Courtesy of LAP Univ. of
Thessaloniky, Greece)
Fig. 3. 24 December 1992; solid line: O3 profile (1011 molecu-les cm~3); dashed line: zonal velocity profile (0.5 m s~1)
the lower stratosphere, while the meridional component is negligible (this curve is not plotted). Wind- and ozone-fields interaction leads to a marked O3 horizontal advec-tion along x with a very weak opposed effect of the velocity divergence term; in Fig. 4 the contribution of zonal advection to the ozone time change is shown as a function of height.
Fig. 6. 6 March 1993: 300-hPa map (Courtesy of European Meteorological Bulletin, Germany) Fig. 4. 24 December 1992; contribution of zonal advection to the
local variation of the ozone concentration as a function of height
3.2 6 March 1993
The negative horizontal advection along the y direction (northward) seems to be the cause of the decreasing O3 (!46.3]106 molecules cm~3 s~1). As a matter of fact, a strongly negative meridional gradient of ozone is clearly visible in the map (Fig. 5). The 300-hPa field (Fig. 6) is
Fig. 5. 6 March 1993; ozone map (Courtesy of LAP Univ. of Thes-saloniky, Greece)
Fig. 7. 6 March 1993; solid line: O3 profile (1011 moleculescm~3);
dashed line: zonal velocity profile (0.5 m s~1); dotted line: meridional
velocity profile (0.5 m s~1)
Fig. 8. 6 March 1993; contribution of meridional advection to the local variation of the ozone concentration as a function of height
characterised by a definite high-pressure area, affecting western Europe. Fairly vigorous northerly components in the troposphere and in the stratosphere up to 24 km are the dominating feature (Fig. 7). In this case, the horizon-tal-ozone gradients being reversed with respect to the most common situation, north-south flux of ozone-poor air is experienced. The negative contribution of meridi-onal advection to the ozone time change is rapidly in-creasing with height up to a maximum at about 23 km (Fig. 8).
3.3 5 December 1993
A positive time change in the ozone concentration (12.9]106 molecules cm~3 s~1) is recorded. Horizontal-velocity convergence along x determines the positive ozone variation, while horizontal advection along x and y, positive and negative, respectively, compensate each other; in fact the ozone map (Fig. 9) indicates negative meridional and zonal O3 gradients in the area under consideration.
Fig. 9. 5 December 1993: ozone map (Courtesy of LAP Univ. of Thessaloniky, Greece)
The peculiar convergent pattern of the wind velocity south of Rome is due to a low pressure centred over the Gulf of Sirte, very close to the coast of Africa, as may be seen on the 300-hPa map (Fig. 10). The existence of strong northerly currents is shown clearly in Fig. 11, while the contribution of horizontal-velocity convergence is shown in Fig. 12.
4 Possible further development
The described scheme provides a methodology to inter-pret ozone changes having a characteristic duration of 1—3 days, and suggests a possible way to develop a tool for predicting ozone changes. As a matter of fact, total-ozone fluctuations appear to be clearly related to large-scale circulation patterns in the upper troposphere. Neverthe-less, it has to be stressed that results appear to be valuable only when one of the factors involved, either advection or divergence, plays a dominating role, leading to significant ozone time changes. When a larger set of data is available, it should be possible to provide a reliable indication of the actual ozone tendency. The availability of predi-cted fields by global general circulation models is pro-mising for projecting the interpretation 2 or 3 days in advance.
A further application of the proposed model, in the process of implementation, consists in experimenting the possibility of using synoptic ozone fluctuations to derive information about the vertical motion profile in the stratosphere.
5 Conclusions
The correlation between ozone time changes and horizontal meridional transport is in agreement with the
Fig. 10. 5 December 1993; 300-hPa map (Courtesy of European Meteorological Bulletin, Germany)
Fig. 11. 5 December 1993; solid line: O3 profile (1011 molecu-les cm~3); dashed line: zonal velocity profile (0.5 m s~1); dotted line: meridional velocity profile (0.5 m s~1)
literature, indicating horizontal advection and vertical motion in the lower stratosphere, due to the atmospheric disturbances, as the cause of the total-ozone variations.
The dominance of the advection term along the y direction in the ozone tendency equation shows that
Fig. 12. 5 December 1993; contribution of horizontal-velocity diver-gence to the local variation of the ozone concentration as a function of height
the synoptic ozone fluctuations are prevailingly related to the existence of south-north gradients of this trace gas.
A decrease in the total ozone is experienced when a large blocking high-pressure centre is located about 1000—2000 km upstream of the considered area. The A. Galliani et al.: Synoptic-scale fluctuations of total ozone in the atmosphere 1049
ozone increase is very likely to occur when a cold low, extending up to the tropopause, is present up-stream of the point of interest. Occasionally, large-scale velocity convergence or divergence, discernible in the flow patterns, may be an important cause of ozone variations.
Acknowledgements. The authors are indebted to LAP-Univ. of
Thessaloniki, Greece for providing total-ozone maps. We also ap-preciate the constructive criticism and suggestion from two anony-mous reviewers; their suggestions have been incorporated into the paper.
Topical Editor L. Eymard thanks D. Spaenkuch and F. Karcher for their help in evaluating this paper.
References
Dobson, G. M. B., Measurements of the amount of ozone in the Earth’s atmosphere and its relations to other geophysical condi-tions, Part IV, Proc. Roy. Soc., A129, 411—433, 1930.
Dobson, G. M. B., and D. N. Harrison, Measurements of the amount of ozone in the Earth’s atmosphere and its relations to other geophysical conditions, Proc. Roy. Soc., A110, 660—693, 1926.
Go¨tz, F. W. P., Ozone in the atmosphere, in Compendium of
met-eorology, Ed. T. F. Malone, American Society, Boston, Mass.,
1951.
Holton, J. R., An introduction to dynamic meteorology, in
Interna-tional Geophysical Series, Vol. 23, 2nd edn., Academic Press Inc.,
San Diego, Calif. 92101, 295—322, 1979.
Poulin, L., and W. F. J. Evans, METOZ: Total ozone from meteoro-logical parameters, Atmos. Ocean, 32, 285—297, 1994.
Pyle, J. A., and R. G. Derwent, Possible ozone reductions and UV changes at the Earth’s surface, Nature, 286, 373—375, 1980.
Siani, A. M., Attualita` sul monitoraggio dei raggi ultravioletti nell’ambiente, G. Ital. Dermatol. »enerol., Vol. 130, Suppl. 1, No. 2, 1995.
Vaughan, G., and J. D. Price, On the relation total ozone and meteorology, Q. J. R. Meteorol. Soc., 117, 1281—1298, 1991. Vogel, G., D. Spa¨nkuch, E. Schulz, U. Felster, and W. Do¨hler,
Regional short-term forecast of total column ozone, Atmos.
En-viron., 29, 1155—1163, 1995.