HIRSHFELD SURFACE ANALYSIS, TOPOLOGICAL FEATURES AND
NONLINEAR OPTICAL PROPERTIES OF PHTHALONITRILE
DERIVATIVE: LOW TEMPERATURE EXPERIMENTAL
CHARGE DENSITY AND QUANTUM CHEMISTRY STUDIES
H. BENAISSIa, M. DRISSIa, S. YAHIAOUIa, Y. MEGROUSSa, A. CHOUAIHa*, F. HAMZAOUIba
Laboratory of Technology and Solid Properties, University Abdelhamid Ibn Badis of Mostaganem, 27000 Mostaganem, Algeria
b
LPFM Académie de Montpellier, France
The Hansen-Coppens multipolar formalism was used to investigate the experimental electron density (ED) distribution of phthalonitrile derivative from single crystal X-ray data. The crystal displays C–H⋅⋅⋅O and O–H⋅⋅⋅N intra- and intermolecular interactions. The ED topological investigation of the explored molecule was carried out, from that the electron density 𝜌𝑏𝑐𝑝(𝑟) and its Laplacian ∇2𝜌𝑏𝑐𝑝(𝑟) at the bond critical points (b.c.p.) have been calculated. The molecular dipole moment and the electrostatic potential were calculated and compared with those obtained using theoretical calculations. The NLO behavior of the title compound was examined by computing the molecular polarizabilities α and β.
(Received May 6, 2018, Accepted August 6, 2018)
Keywords: Electron density, Dipole moment, Electrostatic potential, Hirshfeld Surface, Hyperpolarizabilty.
1. Introduction
As organic materials for electronics and optics, molecular π-conjugated nonlinear optical (NLO) compounds are attractive materials in crystal engineering beside those of inorganic NLO materials [1,2]. These compounds have several applications such as semiconductors, nonlinear optic and photovoltaic materials [3-6]. NLO organic molecules, in general, have an electron-donating unit (e.g. Nitro or Cyano groups), an electron-withdrawing unit (e.g. NR2 or OR groups) and a transmitter group with double or triple chemical bonds (e.g. π-conjugated aromatic rings) [7]. In addition, incorporating heteroatoms (N, O, S etc.) into the structure of NLO molecules leads to better stability, chemical robustness and increase charge transfer. From this perspective, as important class of organic molecules, phthalonitrile derivatives have various applications in photovoltaic, NLO and other electronic and biological fields [8-12].
As described previously, molecular compounds with NLO properties are constituted by an electron donor (D) and an electron acceptor (A) groups in the two extremities with a conjugated π-electrons system between them. Then, the electronic charge is withdrawn from the donor to the acceptor group by means of the conjugated system. Therefore, a molecular dipole moment occurs from the polarization of the conjugated system giving rise to a charge transfer within the molecule. These kind of compounds are called push–pull materials [13,14]. In the last two decades, several studies on experimental charge density in aromatic push-pull molecules have been reported for their intramolecular charge transfer [15-19]. For this purpose, we have chosen
4-[(E)-(2-hydroxyphenyl) iminomethyl] phenoxy} benzene-1,2-dicarbonitrile, which appears a good
candidate for nonlinear optical applications. Besides investigating charge transfer and low temperature experimental charge density in this molecule, we have examined other molecular properties such as topological properties, the dipole moment and the electrostatic potential of the
title compound. Hirshfeld surface method was used to highlight and quantify the most important molecular interactions in the crystal. Finally, the NLO activity of the molecule is computed. In this work all theoretical calculations were performed using Guassian 03 program [20].
2. Multipolar experimental refinement
Electron density (ED) analysis has been carried out using Hansen-Coppens multipolar atom model [21]. The refinements were performed using MoPro package software [22]. The Hansen-Coppens multipolar refinement enables modeling of the non-spherical fraction of the atomic ED using the atom-centered multipole functions as described by following equation:
𝜌𝑖(𝑟⃗) = 𝑃𝑐𝜌𝑐𝑜𝑟𝑒(𝑟⃗) + 𝑃𝑣𝜅3𝜌𝑣𝑎𝑙𝑒𝑛𝑐𝑒(𝜅𝑟⃗) + ∑ 𝜅′3𝑅 𝑙(𝜅′𝜁𝑟⃗) ∑ ∑ 𝑃𝑙𝑚𝑝𝑑𝑙𝑚𝑝(𝜃, 𝜙) 𝑝 𝑚=𝑙 𝑚=0 𝑙𝑚𝑎𝑥 𝑙=0
where core and valence are normalized spherically averaged free-atom core and valence densities, respectively; 𝑅𝑙(𝜅′𝜁𝑟⃗) is a Slater-type radial function and 𝑑𝑙𝑚𝑝(𝜃, 𝜙) are density normalized real spherical harmonic functions. The populations Pv and Plmp, and the dimensionless expansion-contraction parameters κ and κ′ are refined against experimental data, while the population Pc of the core shell remains fixed. 𝜁 parameter is described by Hansen-Coppens model. In this work, multipolar refinement equation was developed to the third order (lmax = 3). The radial function coefficients for H-atoms were n1 = l and n1 = 2 and 3 for non–H atoms. Scattering factors for non– H atoms have been taken from the international tables for X-ray crystallography [23] and for the H-atoms Stewart data were used [24]. During the refinement, isotropic extinction correction has been applied and chemical constraints were imposed in order to limit the number of variables [25].
In parallel, the topological parameters and the molecular dipole moment of the title compound were also estimated. For highlighting the intra- and intermolecular charge transfer nature, the molecular electrostatic potential has been analyzed. All experimental ED deformation and electrostatic potential maps were plotted using the Moporo Viewer program [26]. Crystallographic details and refinement data are summarized in Table 1.
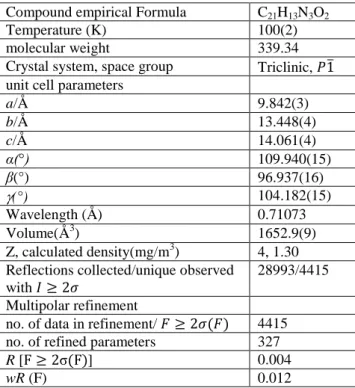
Table 1. Crystallographic and refinement details.
Compound empirical Formula C21H13N3O2
Temperature (K) 100(2)
molecular weight 339.34
Crystal system, space group Triclinic, 𝑃1̅ unit cell parameters
a/Å 9.842(3) b/Å 13.448(4) c/Å 14.061(4) α(°) 109.940(15) β(°) 96.937(16) (°) 104.182(15) Wavelength (Å) 0.71073 Volume(Å3) 1652.9(9) Z, calculated density(mg/m3) 4, 1.30 Reflections collected/unique observed
with 𝐼 ≥ 2𝜎
28993/4415 Multipolar refinement
no. of data in refinement/ 𝐹 ≥ 2𝜎(𝐹) 4415 no. of refined parameters 327
R [F ≥ 2σ(F)] 0.004
Goodness-of-fit 1.155
3. Results and discussion 3.1. Structure description
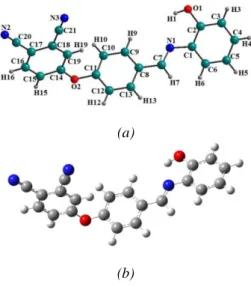
An Diamond [27] view of the title crystal with labeling scheme, taken from the multipolar refinement, is displayed in Figure 1 together with the optimized structure. The title compound crystallizes in the triclinic system with P-1 as space group. The unit cell parameters are a = 9.395 (4) Å, b = 9.577 (4) Å, c = 11.080 (5) Å, α = 80.79 (1)°, = 75.76 (1)°, = 63.31 (1)° and V = 861.9 (6) A3 [28]. Geometrical parameters have been calculated using the density functional theory (DFT/B3LYP/6-31G(d,p)) method. The experimental structural parameters obtained from X-ray crystal structure are compared with those of optimized geometry.
(a)
(b)
Fig. 1. Numbering of atoms for the title crystal: (a) X-ray structure, (b) optimized structure
3.2. Hirshfeld surface and Fingerprint analysis
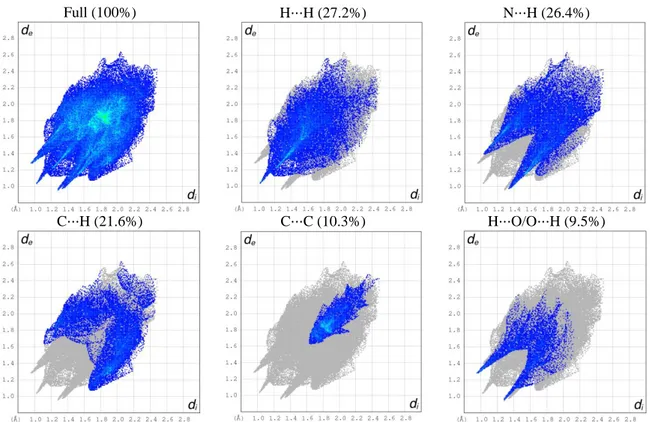
Hydrogen bonds are very important dipole interactions in stabilizing the structures. For highlighting intra- and intermolecular interactions, Crystal Explorer program was used to obtain Hirshfeld Surfaces (HS) and fingerprint plots of the title compound [29]. The three-dimensional HS generated for structure of the title compound is presented in Figure 2. In this figure, red colour indicates distances closer than the sum of the van der Waals (vdW) radii, while white is used for distances near the vdW separation, and blue represents longer distances [30]. Figure 3 shows the HS drawn for the crystal with with dnorm selected intermolecular contacts. As indicated in Figure 3, hydrogen bonding close contacts are highlighted by deep red colour. Other close contacts as H⋅⋅⋅H, C⋅⋅⋅H, N⋅⋅⋅H and C⋅⋅⋅C are observed. Furthermore, the decomposed 2D fingerprint maps, shown in Figure 4, were plotted in order to obtain quantitative information about the individual contribution of all interactions in the crystal packing. The 2D fingerprint plots of the title compound are dominated by H⋅⋅⋅H, N⋅⋅⋅H and C⋅⋅⋅H contacts. As seen in Figure 4, it seems clear that H⋅⋅⋅H intermolecular contacts, which are inherent to organic molecules, represent the biggest contribution (27.2%) to the fingerprint plot. A pair of symmetrical large sharp spikes in the region of (0.8 Å, 1.25 Å) are identified which indicating the presence H⋅⋅⋅O/O⋅⋅⋅H intermolecular interactions and comprises 9.5% of the total HS area.
Fig. 2. View of the HS for the title molecule
Fig. 3. HS mapped for the title compound with dnorm selected intermolecular contacts
Full (100%) H⋅⋅⋅H (27.2%) N⋅⋅⋅H (26.4%)
C⋅⋅⋅H (21.6%) C⋅⋅⋅C (10.3%) H⋅⋅⋅O/O⋅⋅⋅H (9.5%)
Fig. 4. Fingerprint plots with full and individual contribution of the most interactions
3.3. Topological analysis of ED
Topological analysis of the experimental ED was performed with Mopro program. The equation used to calculate the final ED deformation map is:
= 1 𝑉∑[|𝐹𝑚𝑢𝑙(𝐻⃗⃗⃗)|𝑒 𝑖𝜑𝑚𝑢𝑙(𝐻⃗⃗⃗)− |𝐹 𝑠𝑝ℎ(𝐻⃗⃗⃗)| 𝐻 𝑒𝑖𝜑𝑠𝑝ℎ(𝐻⃗⃗⃗)]𝑒−𝑖2𝜋𝐻⃗⃗⃗.𝑟⃗
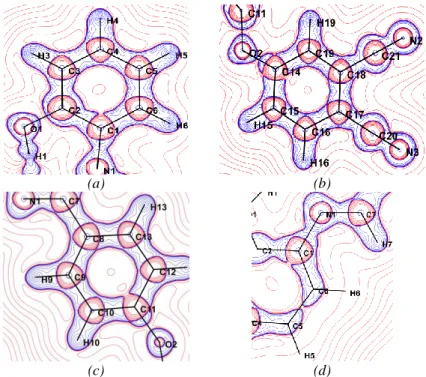
Multipole structure factors Fmul(H) were used to obtain this map, where Fsph(H) is evaluated from high-order refinement. The experimental ED deformation maps are shown in Figure 5 with contour map of 0.05 eÅ-3. As can be noticed in Figure 5, the density peaks appear on all the chemical bonds. Figure 5(a) shows the ED in the benzene ring containing atoms form C14 to C19. It can be seen that the ED distribution is practically located on the chemical bonds. Furthermore, symmetrical distribution of electrons along C21N2 and C20N3 bonds shows clearly the multi connecting part (triple bond). Figure 5(b) shows the electron density distribution with advanced contours for the same cycle in which are observed the lone-pair charge concentrations of N atoms. To more study the electron density of cyano groups, we have explored a second plane perpendicular to the aromatic ring attached these groups, as can be seen in Figures 5(c) and 5(d). It is noted that the triple bond between the nitrogen and the carbon is rich in electrons due to the valence electrons of nitrogen atoms.
contour 0.05
(a)
Advanced contours
(b)
(c) (d)
Fig. 5. (Deformation ED maps. Contour map of 0.05 e.Å-3. The blue coulour indicate the positive density and the red negative density: (a) Six-membered ring (C14-C19),
(b): Ring (C14-C19) with advanced contours, (c): Around C21≡N2 bond, (d) Around
C20≡N3 bond).
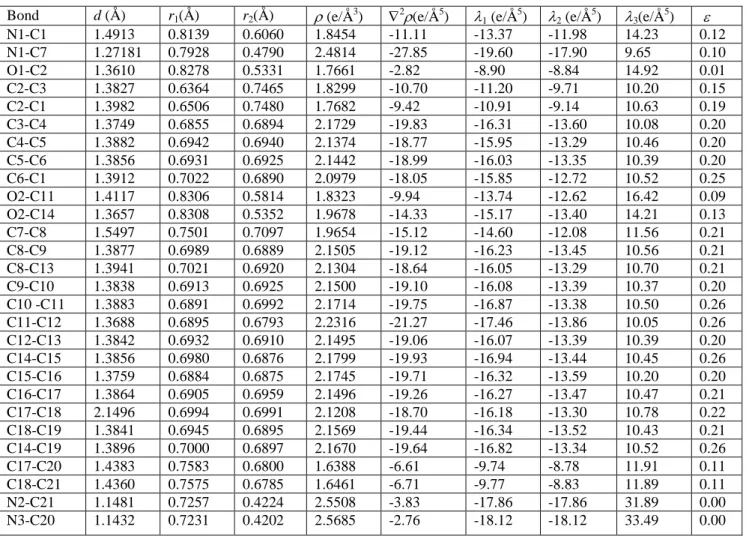
Quantum theory of atoms in molecules (QTAIM) and topological analysis of the ED can be used together to characterize chemical bonding [31]. In the QTAIM model, atoms are linked by a bond path and the bond critical point (b.c.p.) is situated at the minimum along this path. Table 2 summarized the b.c.p. properties of the title crystal determined from multipole refinement using X-ray diffraction data. In previous work, Espinosa et al. reported that these properties are assessed to be 10% of their values [32]. In the title compound, the chemical bonds are described by (3, 1) b.c.ps which provides confirmation on the covalent nature of the bonds in the molecule. The b.c.p EDs, Laplacian values and corresponding distances show the expected consistency. The ED 𝜌𝑏𝑐𝑝(𝑟) of the C5–C6 connection is 2.14 e/Å3, which is identical to the ED of analogue C–C bonds
given in literature [33]. For the C–N bonds, the EDs at the b.c.ps are different and show alternative values.
Notably, the ED of N1–C1 and N1–C7 bonds widely differ and the values are 1.8454 and 2.4814 e/Å3, respectively. Then, we can see that the N1–C7 bond ED has an important value compared to N1–C1 bond; the N1–C7 density increasing may be assigned to the nature of the two bonds. The EDs of the N–C bonds of the cyano groups are 2.5508 e/Å3 (N2–C21) and 2.5685 e/Å3 (N3–C20); these densities are in normal range.
Table 2. The ED topological characteristics at the b.c.ps in the title compound. d is the distance between the two atoms, 𝑟1 and 𝑟2 are the distances from the CP to the atoms,
𝜌 and 𝛻2𝜌 describe the total electron density and its Laplacian, 𝜆1, 𝜆2, 𝜆3 are the principle
curvatures (eigenvalues of Hessian matrix), 𝜀 is the ellipticity.
Bond d (Å) r1(Å) r2(Å) (e/Å3) 2(e/Å5) 1 (e/Å5) 2 (e/Å5) 3(e/Å5)
N1-C1 1.4913 0.8139 0.6060 1.8454 -11.11 -13.37 -11.98 14.23 0.12 N1-C7 1.27181 0.7928 0.4790 2.4814 -27.85 -19.60 -17.90 9.65 0.10 O1-C2 1.3610 0.8278 0.5331 1.7661 -2.82 -8.90 -8.84 14.92 0.01 C2-C3 1.3827 0.6364 0.7465 1.8299 -10.70 -11.20 -9.71 10.20 0.15 C2-C1 1.3982 0.6506 0.7480 1.7682 -9.42 -10.91 -9.14 10.63 0.19 C3-C4 1.3749 0.6855 0.6894 2.1729 -19.83 -16.31 -13.60 10.08 0.20 C4-C5 1.3882 0.6942 0.6940 2.1374 -18.77 -15.95 -13.29 10.46 0.20 C5-C6 1.3856 0.6931 0.6925 2.1442 -18.99 -16.03 -13.35 10.39 0.20 C6-C1 1.3912 0.7022 0.6890 2.0979 -18.05 -15.85 -12.72 10.52 0.25 O2-C11 1.4117 0.8306 0.5814 1.8323 -9.94 -13.74 -12.62 16.42 0.09 O2-C14 1.3657 0.8308 0.5352 1.9678 -14.33 -15.17 -13.40 14.21 0.13 C7-C8 1.5497 0.7501 0.7097 1.9654 -15.12 -14.60 -12.08 11.56 0.21 C8-C9 1.3877 0.6989 0.6889 2.1505 -19.12 -16.23 -13.45 10.56 0.21 C8-C13 1.3941 0.7021 0.6920 2.1304 -18.64 -16.05 -13.29 10.70 0.21 C9-C10 1.3838 0.6913 0.6925 2.1500 -19.10 -16.08 -13.39 10.37 0.20 C10 -C11 1.3883 0.6891 0.6992 2.1714 -19.75 -16.87 -13.38 10.50 0.26 C11-C12 1.3688 0.6895 0.6793 2.2316 -21.27 -17.46 -13.86 10.05 0.26 C12-C13 1.3842 0.6932 0.6910 2.1495 -19.06 -16.07 -13.39 10.39 0.20 C14-C15 1.3856 0.6980 0.6876 2.1799 -19.93 -16.94 -13.44 10.45 0.26 C15-C16 1.3759 0.6884 0.6875 2.1745 -19.71 -16.32 -13.59 10.20 0.20 C16-C17 1.3864 0.6905 0.6959 2.1496 -19.26 -16.27 -13.47 10.47 0.21 C17-C18 2.1496 0.6994 0.6991 2.1208 -18.70 -16.18 -13.30 10.78 0.22 C18-C19 1.3841 0.6945 0.6895 2.1569 -19.44 -16.34 -13.52 10.43 0.21 C14-C19 1.3896 0.7000 0.6897 2.1670 -19.64 -16.82 -13.34 10.52 0.26 C17-C20 1.4383 0.7583 0.6800 1.6388 -6.61 -9.74 -8.78 11.91 0.11 C18-C21 1.4360 0.7575 0.6785 1.6461 -6.71 -9.77 -8.83 11.89 0.11 N2-C21 1.1481 0.7257 0.4224 2.5508 -3.83 -17.86 -17.86 31.89 0.00 N3-C20 1.1432 0.7231 0.4202 2.5685 -2.76 -18.12 -18.12 33.49 0.00 3.4. Laplacian of ED
The Laplacian ∇2𝜌𝑏𝑐𝑝(𝑟) is defined as the second derivative of ED 𝜌𝑏𝑐𝑝(𝑟), which provides information regarding the chemical bonds in the crystal. A negative value (∇2𝜌𝑏𝑐𝑝(𝑟) < 0) of the Laplacian indicates that the charges are localized and the interaction is an open shell type. However, a positive value (∇2𝜌𝑏𝑐𝑝(𝑟) > 0) denotes that the charges are depleted and the interaction is a closed shell type. The experimental Laplacian of ED of the molecule has been calculated (Table 2). The Laplacian value for the N1–C7 bond is stronger (27.85 e/Å5) than on the N1–C1 bond (11.11 e/Å5) which indicates that the N1–C7 bond has a character. The low values are observed for the N2C21 and N3C20 bonds which are - 3.83 and - 2.76 e/Å5, respectively. The total ED at the CC bond b.c.ps in the benzene rings exhibits an alternation of values slightly below and above the average value (2.1157 e/Å3), which is consistent with a
difference in their bond lengths. From the results, intramolecular bonds have Laplacian at the b.c.p with negative values indicating the covalent character of these bonds. Fig. 6 shows the Laplacian maps of ED ∇2𝜌𝑏𝑐𝑝(𝑟) of the title molecule.
(a) (b)
(c) (d)
Fig. 6. (Experimental Laplacian of the ED of the title compound: (a) C1-C6 cycle, (b) C14-C19 cycle, (c) C8-C13 cycle and (d) plane of C1, N1, C7 atoms. Positive
and negative contours are indicated by blue and red lines, respectively).
3.5. Molecular dipole moment
The experimental dipole moment was calculated from the population coefficients of the ED as described in the following equation:
𝜇 = ∑ 𝑞𝑖𝑟𝑖+ ∑
4𝑛 + 3
3𝑘𝑖′′ (𝑃𝑥𝑖𝑖 + 𝑃𝑦𝑖𝑗 + 𝑃𝑧𝑖𝑘) 𝑖
𝑖
where ri are position of atoms, qi atomic charges and Pi are the population coefficients.
From theoretical calculations, the molecular dipole moment (𝜇) can be obtained using the following equation:
𝜇 = (𝜇𝑥2+ 𝜇𝑦2+ 𝜇𝑧2)1/2
The magnitudes of different components are depicted in Table 3. The highest value of dipole moment equal to 10.56 D was obtained with HF/6-31G(d,p). From theoretical and experimental results, dipole moment values are very close.
Table 3. Components of the dipolar moment.
Dipole moment X-ray 6-31G(d,p) HF DFT µx 5.38 10.37 9.66 µy 2.51 0.29 1.68 µz 6.60 2.01 0.57 µ (D) 9.61 10.56 9.82
3.6. Electrostatic potential
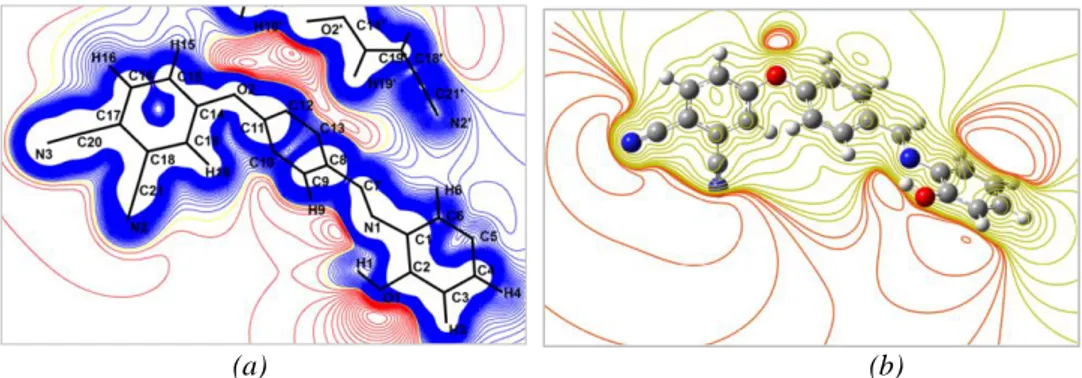
Generally, the electrostatic potential (ESP) may be obtained from X-ray diffraction data or by quantum chemical calculation using theoretical methods. Hence, reactive areas for nucleophilic and electrophilic attacks can be predicted by ESP determination. For our molecule, as can be seen in Figure 9(a) , the ESP map provided by the multipolar refinement is plotted on an ED isosurface. Figure 9(b) shows the theoretical ESP map computed with DFT/B3LYP/6-31G(d,p) level of theory. As can be noted, experimental and theoretical results are wholly similar. From these results and as expected, oxygen and nitrogen atoms, namely O1, O2, N1, N2 and N3, constitute the most electronegative region which are favorable sites for electrophilic attack. Whereas, the aromatic carbon and hydrogen atoms represent the electropositive region implying that these areas are favorable sites for nucleophilic attack.
(a) (b)
Fig. 7. (Electrostatic potential map: (a) experimental, (b) theoretical)
3.7. Non-linear optical properties
For organic NLO materials, the origin of nonlinear behavior has been studied by conducting theoretical and experimental studies [34]. Theoretical calculation plays a significant role in understanding the structure-property relationship which is able to help in designing novel NLO materials. In this context and to understand this phenomenon regarding the investigated molecule, we have seen that it is indispensable to extend this study to the determination of the polarizability α and the first hyperpolarizability 𝛽.
NLO computations were accomplished with the help of quantum chemical methods in particular Hartree-Fock (HF), density functional theory (DFT/B3LYP) and Møller-Plesset (MP2), using 6-31G(d,p) basis set. In addition, PM6 semi-empirical method was used for comparison. The following conventional equations were used to estimate the isotropic polarizability (𝛼) and the first hyperpolarizability (𝛽) tensors:
𝛼 =1
3(𝛼𝑥𝑥+ 𝛼𝑦𝑦+ 𝛼𝑧𝑧) 𝛽 = (𝛽𝑥2+ 𝛽𝑦2+ 𝛽𝑧2)1 2⁄
The whole equation for computing β magnitude is given below: 𝛽 = [(𝛽𝑥𝑥𝑥+ 𝛽𝑥𝑦𝑦+ 𝛽𝑥𝑧𝑧) 2 + (𝛽𝑦𝑦𝑦+ 𝛽𝑦𝑧𝑧+ 𝛽𝑦𝑥𝑥) 2 + (𝛽𝑧𝑧𝑧+ 𝛽𝑧𝑥𝑥+ 𝛽𝑧𝑦𝑦) 2 ]1 2⁄
As 𝛽 is depicted by a 3 × 3 × 3 matrices and using symmetry reported by Kleinman [35], the 3D matrix is reduced to 10 components which are provided by Gaussian program output. These tensors are given in atomic units (a.u.) and were converted into electrostatic units. (α: 1 a.u. = 0.1482×10⁻²⁴ esu ; β: 1 a.u. = 8.6393×10⁻³³ esu).
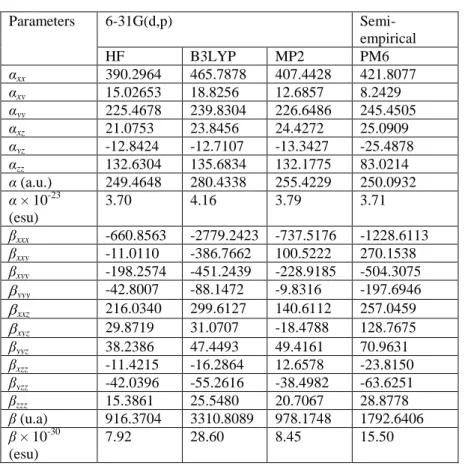
Usually, the ONL activity is directly related to the values of polarizability and hyperpolarizability. The calculated polarizability (α) obtained with B3LYP/6-31G(d,p) basis set is equal to 4.16 × 10⁻²³ esu. As it can be seen from results, the diagonal components are dominant in the computed αij tensors. The most important β value of the title molecule is about 28.60 × 10⁻³⁰ esu calculated with B3LYP/6-31G(d,p). Thus, computed low β value for the title molecule (7.92 10–30 esu obtained at HF/6-31G(d,p)) compared to that of urea (0.1947 10–30 esu) is about 40 times. Therefore, these results indicate that the title molecule have significant NLO comportment.
Table 4 Polarizabilty (α) and hyperpolarizability (β) values of the C21H13N3O2 molecule
obtained by HF, DFT/B3LYP and MP2 methods using 6-31G(d,p) basis set along with the PM6 semi-empirical method.
Parameters 6-31G(d,p) Semi-empirical HF B3LYP MP2 PM6 αxx 390.2964 465.7878 407.4428 421.8077 αxy 15.02653 18.8256 12.6857 8.2429 αyy 225.4678 239.8304 226.6486 245.4505 αxz 21.0753 23.8456 24.4272 25.0909 αyz -12.8424 -12.7107 -13.3427 -25.4878 αzz 132.6304 135.6834 132.1775 83.0214 α (a.u.) 249.4648 280.4338 255.4229 250.0932 α × 10-23 (esu) 3.70 4.16 3.79 3.71 βxxx -660.8563 -2779.2423 -737.5176 -1228.6113 βxxy -11.0110 -386.7662 100.5222 270.1538 βxyy -198.2574 -451.2439 -228.9185 -504.3075 yyy -42.8007 -88.1472 -9.8316 -197.6946 xxz 216.0340 299.6127 140.6112 257.0459 xyz 29.8719 31.0707 -18.4788 128.7675 βyyz 38.2386 47.4493 49.4161 70.9631 βxzz -11.4215 -16.2864 12.6578 -23.8150 βyzz -42.0396 -55.2616 -38.4982 -63.6251 βzzz 15.3861 25.5480 20.7067 28.8778 β (u.a) 916.3704 3310.8089 978.1748 1792.6406 β × 10-30 (esu) 7.92 28.60 8.45 15.50 4. Conclusions
The experimental charge density of phthalonitrile derivative was investigated by means of multipolar refinement using single crystal X-ray diffraction data collected at low temperature. Directional C–H⋅⋅⋅O and O–H⋅⋅⋅N intermolecular interactions have been highlighted using Hirshfeld surface analysis. The close contacts with their individual contributions were established by the fingerprint plots. The high quality of the ED is confirmed by the accumulation of deformation densities on the chemical bonds obtained from multipolar refinement. In order to investigate the electrostatic behavior of the crystal, the X-ray charge density study was carried out. The experimental electrostatic potential was determined and compared to that computed using DFT method. In addition, ESP maps show that the hydrogen atoms represents the positive potential regions while the electronegative atoms constitute the negative potential regions. Negative and positive regions in the molecule are very important for establishing intra- and intermolecular contacts. Nonlinear optical properties have been calculated using computational methods. This study reveals that the title molecule has a significant hyperpolarizability and can be used to develop NLO materials. Finally, structural details, topological, electrostatic and NLO properties reported in this study can be helpful for phthalonitrile derivatives designing.
References
[1] S. R. Forrest, M. E. Thompson, Chem. Rev. 107, 923 (2007).
[2] Ch. Bosshard, R. Spreiter, L. Degiorgi, P. Gunter, Phys. Rev. B66, 205107 (2002) [3] S. Allard, M. Forster, B. Souharce, H. Thiem, U. Scherf, Angew Chem Int Ed. 47, 4070 (2008).
[4] G. S. He, L. S. Tan, Q. Zheng, P. N. Prasad, Chem Rev. 108, 1245 (2008). [5] J. A. Delaire, K. Nakatani, Chem Rev. 100, 1817 (2000).
[6] M. Kivala, F. Diderich, Acc Chem Res. 42, 235 (2009).
[7] F. Bureš, J. Kulhánek, T. Mikysek, J. Ludvík, J. Lokaj, Tetrahedron Lett. 51, 2055 (2010). [8] C. C. Leznoff, A.B.P. Lever (Eds.), Phthalocyanines: Properties and Applications, vols. 1-4, VCH, New York, 1996.
[9] M. Okutan, F. Yakuphanoglu, O. Köysal, M. Durmuş, V. Ahsen, Spectrochim. Acta Part. A 67, 531 (2007).
[10] C. M. Allen, W. M. Sharman, J. E. Van Lier, J. Porphyr. Phthalocyanines 5, 161 (2001). [11] A. Wang, L. Long, C. Zhang, J. Incl Phenom Macrocycl Chem. 71, 1 (2011).
[12] P. Sen, G. Yaşa Atmaca, A. Erdoğmuş, N. Dege, H. Genç, Y. Atalay, S. Zeki Yildiz, Journal of Fluorescence 25(5), 1225 (2015).
[13] Ch. Bosshard, K. Sutter, P. H. Pretre, J. Hulliger, M. Florsheimer, P. Kaatz, P. Gunter, Organic Nonlinear Optical Materials, Advances in Nonlinear Optics, vol. 1, Gordon and Breach, Amsterdam. (1995).
[14] H. S. Nalwa, S. Miyata, Nonlinear Optics of Organic Molecules and Polymers, CRC Press, Boca Raton, 1997.
[15] Y. Megrouss, N. Benhalima, R. Bahoussi, N. Boukabcha, A. Chouaih, F. Hamzaoui, Chin. Phys. B 24(10), 106103 (2015).
[16] F. Hamzaoui, F. Baert, J. Zyss, J. Mater. Chem. 6, 1123 (1996).
[17] M. Drissi, A. Chouaih, Y. Megrouss, F. Hamzaoui, Journal of Crystallography, 2013, ID 326457 (2013).
[18] N. Boubegra, A. Chouaih, M. Drissi, F. Hamzaoui, Chin. Phys. B 23(1), 016103 (2014). [19] R. Srinivasa Gopalan, G. U. Kulkarni, M. Ravi, C. N. R. Rao, New J. Chem. 25, 1108 (2001). [20] M. J. Frisch, et al., Gaussian 03, Revision B.04. Gaussian, Inc., Pittsburgh, 2003.
[21] N. K. Hansen, P. Coppens, Acta Cryst. A 34, 909 (1978).
[22] C. Jelsch, B. Guillot, A. Lagoutte, C. Lecomte, J. Applied Crystallography 38, 38 (2005). [23] E. Prince, A. J. C. Wilson, International Tables for X-Ray Crystallography, vol. C, 2nd edition, Kluwer Academic, Boston, Mass, USA, 1999.
[24] R. F. Stewart, E. R. Davidson, W. T. Simpson, The Journal of Chemical Physicsvol. 42(9), 3175 (1965).
[25] P. Coppens, X-Ray Charge Densities and Chemical Bonding, Oxford, NewYork, NY, USA, 1997.
[26] B. Guillot, Acta Cryst. A 68, 204 (2012).
[27] K. Brandenburg, Diamond, Crystal Impact GbR, Bonn, Germany, 1999. [28] H. Tuncer, A. O. Görgülü, T. Hökelek, Acta Cryst. E 68, 565 (2012).
[29] S. K. Wolff, D. J. Grimwood, J. J. Mckinnon, D. Jayatilaka, M. A. Spackmann, Crystal Explorer 3.0, University of Western Australia, Perth, 2007.
[30] J. J. Mckinnon, D. Jayatilaka, M. A. Spackmann, Chem. Commun. 3814 (2007).
[31] R. F. W. Bader, Atoms in Molecules: A Quantum Theory; Clarendon Press: Oxford, UK, 1990.
[32] E. Espinosa, M. Souhassou, H. Lachekar, C. Lecomte, Acta Cryst. B 55, 563 (1999). [33] M. Kubicki, T. Borowiak, G. Dutkiewicz, M. Souhassou, C. Jelsch, C. Lecomte, J. Phys. Chem. B 106, 3706 (2002).
[34] D. Sajan, H. J. Ravindra, M. Neeraj, I. Hubert Joe, Vibrational Spectroscopy 54, 72 (2010). [35] D. A. Kleinman, Phys. Rev. 126, 1977 (1962).