HAL Id: hal-00328411
https://hal.archives-ouvertes.fr/hal-00328411
Submitted on 8 Nov 2005
HAL is a multi-disciplinary open access
archive for the deposit and dissemination of
sci-entific research documents, whether they are
pub-lished or not. The documents may come from
teaching and research institutions in France or
abroad, or from public or private research centers.
L’archive ouverte pluridisciplinaire HAL, est
destinée au dépôt et à la diffusion de documents
scientifiques de niveau recherche, publiés ou non,
émanant des établissements d’enseignement et de
recherche français ou étrangers, des laboratoires
publics ou privés.
Evidence of systematic errors in SCIAMACHY-observed
CO2 due to aerosols
S. Houweling, W. Hartmann, I. Aben, H. Schrijver, J. Skidmore, G.-J.
Roelofs, Francois-Marie Breon
To cite this version:
S. Houweling, W. Hartmann, I. Aben, H. Schrijver, J. Skidmore, et al.. Evidence of systematic errors
in SCIAMACHY-observed CO2 due to aerosols. Atmospheric Chemistry and Physics, European
Geosciences Union, 2005, 5 (11), pp.3013. �10.5194/acp-5-3003-2005�. �hal-00328411�
www.atmos-chem-phys.org/acp/5/3003/ SRef-ID: 1680-7324/acp/2005-5-3003 European Geosciences Union
Chemistry
and Physics
Evidence of systematic errors in SCIAMACHY-observed CO
2
due to
aerosols
S. Houweling1,2, W. Hartmann1, I. Aben1, H. Schrijver1, J. Skidmore1, G.-J. Roelofs2, and F.-M. Breon3
1National Institute for Space Research (SRON), Utrecht, The Netherlands
2Institute for Marine and Atmospheric Research (IMAU), Utrecht, The Netherlands 3Laboratoire des Sciences du Climat et de l’Environnement, Gif sur Yvette, France Received: 16 March 2005 – Published in Atmos. Chem. Phys. Discuss.: 25 May 2005 Revised: 12 September 2005 – Accepted: 28 October 2005 – Published: 8 November 2005
Abstract. SCIAMACHY CO2measurements show a large variability in total column CO2 over the Sahara desert of up to 10%, which is not anticipated from in situ measure-ments and cannot be explained by results of atmospheric models. Comparisons with colocated aerosol measurements by TOMS and MISR over the Sahara indicate that the sea-sonal variation of SCIAMACHY-observed CO2strongly re-sembles seasonal variations of windblown dust. Correlation coefficients of monthly datasets of colocated MISR aerosol
optical depth and SCIAMACHY CO2vary between 0.6 and
0.8, indicating that about half of the CO2 variance is ex-plained by aerosol optical depth. Radiative transfer model calculations confirm the role of dust and can explain the size of the errors. Sensitivity tests suggest that the remaining vari-ance may largely be explained by variations in the vertical distribution of dust. Further calculations for a few typical aerosol classes and a broad range of atmospheric conditions show that the impact of aerosols on SCIAMACHY retrieved CO2is by far the largest over the Sahara, but may also reach significant levels elsewhere. Over the continents, aerosols lead mostly to overestimated CO2 columns with the excep-tion of biomass burning plumes and dark coniferous forests. Inverse modelling calculations confirm that aerosol
correc-tion of SCIAMACHY CO2measurements is needed to
de-rive meaningful source and sink estimates. Methods for cor-recting aerosol-induced errors exist, but so far mainly on the basis of theoretical considerations. As demonstrated by this study, SCIAMACHY may contribute to a verification of such methods using real data.
Correspondence to: S. Houweling
(s.houweling@phys.uu.nl)
1 Introduction
Remote sensing of CO2 is gaining scientific interest due to advances in technology that are now starting to make such measurements feasible. CO2 is receiving special attention as a candidate for remote sensing because of its important role in global warming and in the global carbon cycle. Our knowledge of CO2 concentration in the atmosphere is cur-rently based on sparse ground-based flask sampling networks
(GLOBALVIEW-CO2, 2004) mostly at remote marine
loca-tions and networks of continuous measurements in developed countries, for example in Europe (CarboEurope-IP, 2004) and the United States (NACP, 2002). Although these moni-toring networks continue to expand, they remain limited by lack of measurements in several parts of the world partic-ularly in the tropics. In the near future, remote sensing is likely to step in and become an important part of global CO2 observing systems due to the unique contribution of being able to fill the gaps in the surface measurement network. The challenge of small atmospheric gradients of CO2 necessi-tates that detection be done with high measurement accuracy (∼1% or better). The motivation for this study is to deter-mine the conditions that need to be fulfilled for short wave infrared measurements in order to meet this requirement.
First attempts to measure CO2from space were published by Ch´edin et al. (2002a,b) using thermal infrared (TIR) chan-nels of NOAA-TOVS, followed by Crevoisier et al. (2004) and Engelen et al. (2004) who applied a similar methodol-ogy to AIRS. These measurements largely reproduce in situ measured seasonal cycles in the tropics. CO2measurements in the short wave infrared (SWIR) from SCIAMACHY were first reported by Buchwitz et al. (2005), and show realis-tic global patterns but seasonal cycle amplitudes that are
2
overestimated by ∼4 times. Note that these studies should be considered first exploratory attempts, because none of the instruments were originally designed to measure CO2 con-centrations. The first dedicated CO2 missions will be the Orbiting Carbon Observatory (OCO) and the Greenhouse gases Observing SATellite (GOSAT) both planned for launch in 2008 (http://oco.jpl.nasa.gov/, http://www.jaxa.jp/). OCO will make use of CO2absorption bands (1.6 and 2.0 µm) that are also detected by SCIAMACHY, although the OCO spec-tral resolution will be higher. Nevertheless, OCO might ben-efit from experience with SCIAMACHY.
This study aims at validation of SCIAMACHY CO2
re-trieval at 1.6 µm (channel 6). In particular we focus on large variability in column CO2 that is observed over the Sahara desert. The Sahara is a logical starting point for validation as its bright surface favors the measured signal to noise ra-tio, and measurement coverage is extensive owing to a high percentage of cloud free measurements. Atmospheric CO2 in this region is expected to behave rather predictably in ab-sence of any significant surface sources and sinks. Concen-trations should largely follow the background as observed at low to mid latitudes of the Northern Hemisphere, as con-firmed by operational flask sampling at Assekrem, Alge-ria, by NOAA/CMDL (Conway et al., 1994). Therefore, the SCIAMACHY-observed variability hints at a significant source of error, most likely related to aerosols. Aerosols per-turb the average optical pathlength and thereby the estimated column optical depth, which has been identified as a poten-tially important source of error (see for example Dufour and Breon, 2003)).
We have compared SCIAMACHY measurements with co-incident aerosol measurements from MISR and TOMS to de-termine the relation between total column CO2and dust. Ra-diative transfer calculations have been carried out to verify the observed relationship. The results are used to extrapo-late the influence of aerosols on SCIAMACHY CO2retrieval globally, including inverse modelling calculations to deter-mine the impact on continental scale sources and sinks esti-mation.
First we describe the CO2retrieval method and the radia-tive transfer modelling of aerosols (Sect. 2.1). Then aerosol measurements are described (Sect. 2.2), followed by a sum-mary of the extrapolation and atmospheric inverse modelling methodology (Sect. 2.3). Section 3.1 shows SCIAMACHY-observed CO2 over the Sahara, and its correlation with aerosol optical depth. In Sect. 3.2 these results are compared with radiative transfer model calculations. Global extrapola-tion and interpretaextrapola-tion by inverse modelling is presented in Sect. 3.3, followed by discussion (Sect. 4) and conclusions (Sect. 5).
2 Methods
2.1 SCIAMACHY
SCIAMACHY was launched in March 2002 onboard
EN-VISAT (Bovensmann et al., 1999). Its 8 detector
chan-nels cover the UV-Visible-SWIR wavelength range. Our
CO2retrieval makes use of channel 6, which measures at a 30×60 km2horizontal resolution and a spectral resolution of 1.48 nm. The instrument scans in across track direction with a 960 km swath alternating between limb and nadir mode. Global coverage is reached in ∼6 days.
CO2columns have been retrieved using the so-called It-erative Maximum Likelihood Method (IMLM) (Schrijver, 1999). First, the model albedo is scaled such that the in-tegral over the modelled spectral window equals that of the measurements. Next, the CO2column is fitted to the mea-sured spectrum using least squares optimization, after which the model spectrum is recalculated. These steps are re-peated until convergence is achieved, i.e. when the relative change in the parameters is less than 1 ‰. Usually 2–4 it-erations are needed to satisfy this criterion. The retrieved CO2 column is normalized to 1013 hPa. For this purpose, a high resolution elevation map is used (ETOPO5 tbase.bin, http://aero.ist.utl.pt/∼dg/) to calculate the average surface
el-evation over the SCIAMACHY footprint. The normaliza-tion factor is calculated from the hydrostatic equanormaliza-tion using the footprint elevation in combination with the coincident ECMWF vertical temperature profile, surface pressure, and orography.
As observed spectra we use calibrated SCIAMACHY top of the atmosphere radiances (level 1). Cloud contaminated measurements and back scans are excluded. The cloud de-tection algorithm makes use of SCIAMACHY’s broadband polarization measurement devices (PMD 2,3 and 4) as de-scribed by Krijger et al. (2005). The retrieval uses a spectral window covering a continuous set of detector pixels rang-ing from 1563 nm to 1585 nm. This window contains part of the CO2absorption band at 1.6 µm and a few significant H2O spectral lines. Contributions from other molecules can be neglected. The measurements are corrected for the orbit specific dark signal. Note that the temporal variations in dark signal that have been reported for SCIAMACHY retrieval in channel 8 (Gloudemans et al., 2005) do not affect this win-dow. Channel 7 also contains a strong CO2band, but suffers from ice formation on the detectors and many dead and bad pixels. All detector pixels within our spectral window func-tioned properly, which was a reason to limit the CO2retrieval to this part of the observed spectrum.
The model that is used to fit the observed spectra calculates the line-by-line absorption of CO2and H2O in the Earth’s at-mosphere according to Beer’s Law. Rayleigh scattering and scattering by aerosols are ignored in this model. To simulate the SCIAMACHY instrument, the forward model is multi-plied by the instruments pixel sensitivity, quantum efficiency,
slit function and Modtran Solar spectrum (Berk et al., 1999). A study by Frankenberg et al. (2004) showed that the CO2 retrieval is sensitive to the local vertical temperature profile. Therefore, ECMWF-derived temperature and pressure data on 1◦×1◦have been applied to calculate high spectral reso-lution CO2and H2O cross-sections. In addition, ECMWF-derived water vapor has been used because the CO2column retrieval was found to be sensitive to H2O. The 6 hourly ECMWF profiles are interpolated to the SCIAMACHY local overpass time (10:00 am equator crossing time). The absorp-tion cross-secabsorp-tions of the two most abundant CO2and H2O isotopomers have been taken from the Hitran 2000 database (Rothman et al., 2003). The contributions of the remaining isotopomers of less than 0.4% for CO2and less than 0.04% for H2O have been neglected. A Voigt line shape has been assumed for all lines.
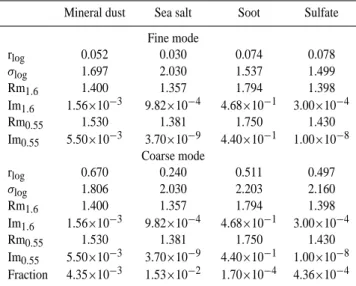
To study the effect of aerosol scattering on the retrieved CO2 column, the retrieval algorithm is tested against syn-thetic spectra that include the effects of aerosol (multiple-) scattering. The synthetic spectra are calculated using a ra-diative transfer model, which accounts for Rayleigh and Mie (multiple-) scattering (Hasekamp and Landgraf, 2002, 2005). The line-by-line calculation of the CO2 optical depth fol-lowed the same procedure as is used to retrieve CO2. A log-normal bimodal particle size distribution is used which includes contributions from typical fine and coarse mode aerosol particles. The corresponding aerosol particle sizes and optical data are taken from d’Almeida et al. (1991) and Holben et al. (1998), respectively (see Table 1).
2.2 Aerosol measurements
Data from two aerosol measuring satellites have been used in this study: The Aerosol Index (AI) of the Earthprobe Total Ozone Mapping Spectrometer (TOMS) (Herman et al., 1997; Torres et al., 1998), and Aerosol Optical Depth (AOD) as measured by the Multi-angle Imaging Spectrometer (MISR) (Kahn et al., 2005). Although MISR provides a more quanti-tative estimate of the aerosol load (i.e. the optical thickness), the TOMS-data aerosol index product has a much better sta-tistical sampling: TOMS covers 90% of the globe each day, whereas MISR has only 3–4 revisits per month. We were not able to use TOMS for a quantitative analysis as it cannot pro-vide aerosol optical depth without additional information on aerosol type and height distribution (Torres et al., 1998).
The footprint of TOMS varies between 50×50 km2 in
nadir to 250×150 km2at extreme off nadir (Prospero et al.,
2000). We have used an interpolated data product at
1.25◦×1◦. The TOMS aerosol index is defined as:
AI=−100. log 10[(I340/I380)meas−(I340/I380)mod], (1) where “meas” refers to the observed ratio of radiances, and “mod” to a model with an aerosol free atmosphere. Over deserts, UV radiation is absorbed at the ground and the sig-nal detected by TOMS is mainly due to Rayleigh
scatter-Table 1. Aerosol size distribution and scattering properties.
Mineral dust Sea salt Soot Sulfate Fine mode rlog 0.052 0.030 0.074 0.078 σlog 1.697 2.030 1.537 1.499 Rm1.6 1.400 1.357 1.794 1.398 Im1.6 1.56×10⁻³ 9.82×10⁻⁴ 4.68×10⁻¹ 3.00×10⁻⁴ Rm0.55 1.530 1.381 1.750 1.430 Im0.55 5.50×10⁻³ 3.70×10⁻⁹ 4.40×10⁻¹ 1.00×10⁻⁸ Coarse mode rlog 0.670 0.240 0.511 0.497 σlog 1.806 2.030 2.203 2.160 Rm1.6 1.400 1.357 1.794 1.398 Im1.6 1.56×10⁻³ 9.82×10⁻⁴ 4.68×10⁻¹ 3.00×10⁻⁴ Rm0.55 1.530 1.381 1.750 1.430 Im0.55 5.50×10⁻³ 3.70×10⁻⁹ 4.40×10⁻¹ 1.00×10⁻⁸ Fraction 4.35×10⁻³ 1.53×10⁻² 1.70×10⁻⁴ 4.36×10⁻⁴ rlog, σlog: central value and standard deviation of the log-normal
size distribution (µm). Rmx, Imx: Real and imaginary part of the
index of refraction at “x” µm. Fraction: Fractional contribution of the coarse mode to the number concentration.
ing. UV absorbing aerosols, such as soot and mineral dust, are detected by absorption of UV light that is backscattered from the layer beneath. Because of this, the sensitivity of TOMS AI to aerosols increases about proportionally with aerosol layer height, while any aerosol below ∼1000 m is unlikely to be detected. Despite this limitation, good cor-relation between TOMS AI and in situ measurements has been found (Chiapello et al., 1999; Hsu et al., 1999). The data used in this study have been downloaded from http: //toms.gsfc.nasa.gov/eptoms/ep v8.html.
The MISR instrument measures continuously in different directions, allowing the instrument to differentiate between aerosols and the Earth’s surface. Cameras are aimed at nine angles in the orbital plane ranging from 70◦ backward to 70◦forward detecting 4 narrow spectral bands. The instru-ment has a spatial resolution of 1.1×1.1 km2. The product we used was averaged to 0.5◦×0.5◦(downloaded from http: //eosweb.larc.nasa.gov/PRODOCS/misr/table misr.html). A comparison with ground-based measurements of the AErosol RObotic NETwork (AERONET) (Holben et al., 1998) indi-cates that for arid conditions the MISR AOD product has an 8% uncertainty at 18×18 km2reducing to 5% at 50×50 km2, without any obvious systematic biases or trend (Martonchik et al., 2004; Kahn et al., 2005).
2.3 Global extrapolation
The global and seasonal variation of aerosol-induced re-trieval errors has been calculated using the radiative trans-fer modelling approach described in Sect. 2.1 using global
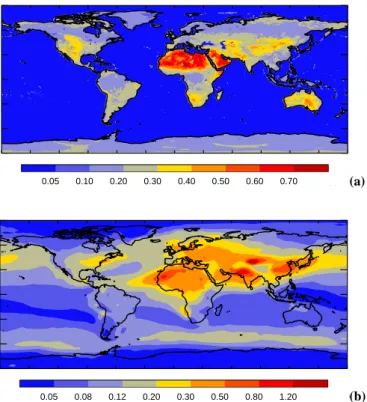
2 0.05 0.10 0.20 0.30 0.40 0.50 0.60 0.70 (-) (a) 0.05 0.08 0.12 0.20 0.30 0.50 0.80 1.20 (AOD)(b) Fig. 1. Input data used for aerosol error calculation; (a) annually averaged surface albedo at 1.64 µm, (b) annually averaged aerosol optical depth at 550 nm. Note that annual averages are shown here, while monthly data have been used to calculate the errors.
maps of surface albedo and aerosol optical thickness. Four different classes of aerosol have been distinguished: min-eral dust, soot, sea salt, and sulfate aerosol. Table 1 sum-marizes the aerosol class-specific size and scattering prop-erties that have been used. MODIS-derived global White Sky albedo maps have been used for 1.64 µm on 0.5◦×0.5◦ horizontal resolution for each month of the year 2001 (http: //modis.gsfc.nasa.gov/). This level 3 product has been con-structed using a land cover description for data gap filling (see Fig. 1). The seasonal and global distribution of aerosol optical depth for each aerosol class has been taken from out-put of the LMDz model (Hauglustaine et al., 2004). We have used monthly averaged aerosol columns at 3.75×2.5◦ hori-zontal resolution (see Fig. 1).
For each 0.5◦×0.5◦ grid box located over the continents monthly averaged aerosol errors have been calculated ac-cording to the local albedo and aerosol optical depth. The calculations are limited to the continents because the low surface albedo of the sea surface prevents any useful SCIA-MACHY measurements over the oceans, neglecting the po-tential use of occasional sun glint measurements. To reduce computation time, lookup tables have been prepared for each aerosol class, spanning the range of realistic values of albedo and AOD at intervals of 0.1. As a further simplification, the total aerosol error is calculated as the sum of the
contribu-tions of each aerosol class. These simplificacontribu-tions are justified by calculated relations between AOD and CO2 that do not deviate much from linearity for a common range of albedo of 0.1–0.4 and AOD<0.3 (see Fig. 4). AOD values >0.3 are mainly encountered in regions where a single aerosol class dominates, as is the case, for example, for mineral dust over the Sahara.
The global and monthly maps of aerosol error have been used to quantify the impact of aerosols on the CO2 sources and sinks that would be obtained if SCIAMACHY CO2
mea-surements were used for inverse modelling. The inverse
modelling procedure follows a classical Bayesian approach (see e.g. Tarantola (1987)). The same set-up has been used as described in Houweling et al. (2003), where details can be found. In short, atmospheric transport is calculated us-ing the Eulerian Tracer Model 3 (TM3) by Heimann and K¨orner (2003). The state vector consists of monthly fluxes for each 8◦×10◦ degree grid box of the transport model.
Realistic prior CO2fluxes and uncertainties have been
pre-scribed (see Houweling et al. (2003)). Simulated
SCIA-MACHY measurements have been averaged in weekly in-tervals on 8◦×10◦. A 1% uncertainty has been assumed for single column measurements. Two inverse modelling calcu-lations have been carried out: (A) with, and (B) without an error due to aerosols. The only difference between these in-versions is that in inversion A the aerosol error is added to the measurements. The impact of the aerosol errors on the results of the inversion is quantified by the difference in cal-culated posterior flux of inversion A and B.
3 Results
3.1 Correlation of CO2and Dust measurements
Figure 2 shows the peculiar phenomenon of large CO2 vari-ability as it was initially observed. It also points out the lo-cation of our study domain extending from 20◦W–50◦E and 15◦N–35◦N covering a large fraction of the Sahara desert. Monthly values were obtained by averaging SCIAMACHY measurements that fall within the same 0.5◦×0.5◦grid box. Cloud-free measurements were selected with a CO2retrieval uncertainty <1%, which is satisfied for about 75% of the measurements within our study region (or ∼15 000 mea-surements per month). CO2 varies between fairly realistic column depths of ∼8×10²¹molec./cm2 to values as high as 9×10²¹molec./cm2 (or column mean mixing ratios be-tween 370 and 415 ppm), spanning a range of about 10%. For comparison, air samples collected by NOAA/CMDL at Assekrem (23◦100N, 5◦250E, 2728 m a.s.l.) show variations in CO2 that barely exceed 1% around an average value of 375 ppm for 2003. Since the CO2variability higher up in the atmosphere should not be much larger than near the surface, we can only conclude that SCIAMACHY largely overesti-mates CO2variability pointing at a highly significant source
8.100 8.200 8.300 8.400 8.500 8.600 8.700 8.800 (x1021 ) (x10 molec/cm )21 2 (a) 0.250 0.500 0.750 1.000 1.250 1.500 1.750 2.000 (AOT) (b) 7.800 7.900 8.000 8.100 8.200 8.300 8.400 8.500 (x1021 ) (x10 molec/cm )21 2 (c) 0.250 0.500 0.750 1.000 1.250 1.500 1.750 2.000 (AOT)(d)
2 0 1 2 3 MISR AOT 6 7 8 9 10 11 SCIA CO 2 (x10 21 /cm 2) corr.coef= 0.78 slope= 0.81 intercept= 8.00 std x= 0.28 std y= 0.22 (a) 0.0 0.2 0.4 0.6 0.8 1.0 1.2 1.4 MISR AOT 6 7 8 9 10 11 SCIA CO 2 (x10 21/cm 2) corr.coef= 0.66 slope= 0.93 intercept= 7.87 std x= 0.15 std y= 0.14 (b) Fig. 3. Relation between colocated SCIAMACHY CO2and MISR
AOD measurements (550 nm) over the Sahara for July 2003 (a) and October 2003 (b).
of error. Regions of elevated CO2typically extend over a few hundred kilometers, forming patterns that are highly variable in time. In addition, there is a pronounced seasonal variation in the number of apparent CO2enhancements and the regions where they appear most frequently. Of the whole year of 2003 that was analyzed, July and October were outstanding examples of respectively high and low frequencies of events of elevated CO2 (see Fig. 2). For comparison Fig. 2 also shows coincident TOMS AI, indicating that the observed pat-terns of CO2strongly resemble that of mineral dust aerosol. Similar agreement between TOMS AI and SCIAMACHY CO2 was found for other months of 2003. It is known that the seasonal variations in TOMS AI correspond well with annually recurring seasonal variations in sand storm activity (Prospero et al., 2000), peaking in July and subsiding towards the end of the year.
Although TOMS AI has proven to be a useful qualita-tive indicator of large scale variations in windblown dust we move to MISR for a more detailed and quantitative analy-sis. At the price, however, of a lower measurement coverage of MISR compared with TOMS which reduces the number of SCIAMACHY colocations (from 14 000 to about 3500 per month). Figure 3 presents colocations of SCIAMACHY CO2and MISR AOD for July and October 2003, confirming a relationship between these parameters. Pearson correlation coefficients range from 0.6 to 0.8 indicating that AOD ex-plains about 50% of the observed variance in CO2. Part of the remaining variance is explained by variations in surface albedo, which, as we will show later, influences the optical path in the presence of aerosols. To limit the influence of surface albedo, data were selected with measured (apparent) albedo values between 0.45 and 0.65. Another part of the variance is explained by errors in the CO2column normal-ization. Since the normalization correction is not a linear function of surface elevation, the sub-footprint scale orogra-phy variations do not cancel out in the footprint mean. If scattering on aerosol particles is taken into account the sur-face extrapolation function becomes even more complex and difficult to correct. To reduce the impact of these errors we discard measurements in 0.5◦×0.5◦grid box where the stan-dard deviation of 1×1 km2orography exceeds 100 m. In ad-dition to these specific filtering rules, the same selection pro-cedure was followed as in Fig. 2. Selection by scan angle may seem another logical choice given the angular depen-dence of aerosol scattering. Even though the swath of SCIA-MACHY in nadir covers angles between roughly −30 to 30 degrees, no clear relationship was found between scan angle and retrieved CO2. Therefore, scan angle selection has been ignored to maximize the number of colocated measurements. 3.2 Relation between CO2retrieval and aerosol
Radiative transfer model calculations were carried out to study the relationship between windblown dust and SCIAMACHY-retrieved CO2. The aim of these calculations is to find out whether aerosol-induced pathlength deviations can explain the size of observed CO2variations. The upper panel of Fig. 4 presents results of these model calculations, showing the calculated CO2retrieval error as function of sur-face albedo and aerosol optical depth. For bright sursur-faces and low optical depths surface reflection dominates. Under these conditions, an increase of AOD leads to increased per-turbation of the optical path, on average extending the opti-cal pathlength. Towards darker surfaces and higher optiopti-cal depths the average altitude at which photons are scattered back to space increases, thereby reducing the mean optical pathlength.
The calculated size of the path length deviation is sensitive to the vertical profile of aerosol. Published in situ and remote sensing measurements of dust over the Sahara and the West Atlantic Ocean indicate that dust layers extend to 600 hPa, or
0.0 0.5 1.0 1.5 2.0 AOT (550nm) -20 -10 0 10 20 delta CO 2 (%) albedo=0.01 albedo=0.05 albedo=0.10 albedo=0.20 albedo=0.30 albedo=0.40 albedo=0.50 albedo=0.60 albedo=0.70 (a) 0.0 0.5 1.0 1.5 2.0 AOT (550nm) 8.0 8.5 9.0 9.5 CO 2 (x10 21 cm -2) albedo=0.50 albedo=0.50 albedo=0.60 albedo=0.60 albedo=0.70 albedo=0.70 (b) Fig. 4. Model simulated relation between mineral dust aerosol and retrieved column CO2for different surface albedos (a), and
com-parison with SCIAMACHY measurements (b) for July (red) and October (green) over the Sahara. Solid lines, model calculations for July; dashed lines, model calculations for October.
about 5 km altitude, in summer (Karyampudi et al., 1999; de Reus et al., 2000). In addition, the first 1–2 km show lower dust load, which is true in particular for the marine boundary layer along the west coast of Africa in summer (Karyam-pudi et al., 1999; Haywood et al., 2003). Over land the ver-tical distribution is highly variable with occasional intensive dust plumes near the surface and remnants of previous dust events higher up. Due to lack of detailed local information, our computations assume a layer of evenly distributed dust extending from the surface to 5 km in July and 3 km in Oc-tober. The lower mixing depth in October is in line with seasonal variations in the vertical dust profile as simulated by the LMDz model. The sensitivity of pathlength deviation (and thus CO2mixing ratio) to mixing height is demonstrated in Fig. 4 by the differences between the calculations for July (0–5 km, solid lines) and October (0–3 km, dashed lines).
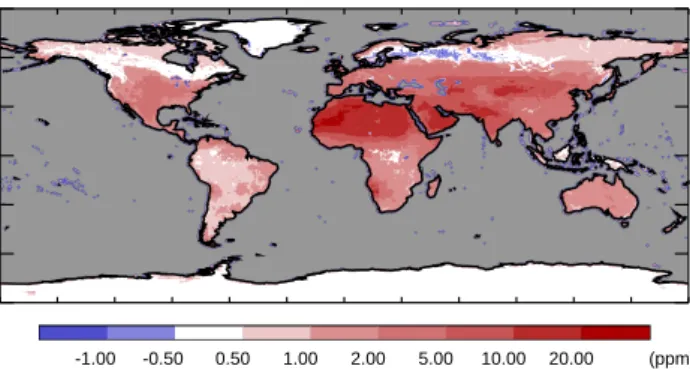
-1.00 -0.50 0.50 1.00 2.00 5.00 10.00 20.00 (ppm)
Fig. 5. Model simulated annually averaged error in continental CO2
concentrations due to aerosol.
Besides mixing height, the calculations for July and October differ also by the assumed temperature, humidity and solar zenith angle. However, the influence of these other factors is only minor.
The lower panel of Fig. 4 compares modeled and measurement-derived CO2 columns. For this purpose, the measurements shown in Fig. 3 have been averaged into bins of 0.1 AOD. The figure shows only the modelled curves for surface albedos that span the same range as the apparent albe-dos determined from the SCIAMACHY measurements. Note that there is a difference between surface albedo and the ap-parent albedo as seen by SCIAMACHY, which is a combina-tion of aerosol and surface reflectance. Over the bright sur-face of the Sahara dust aerosols reduce the apparent albedo. The difference between surface albedo and apparent albedo ranges between insignificant values at low AOD to ∼0.05 at AOD=2. This explains why modelled (surface) albedos for 0.5 to 0.7 are shown, while the measurements represent (apparent) albedos between 0.45 and 0.65. As can be seen in Fig. 4 the observed and model derived relations between CO2 and AOD are in reasonable agreement. The sensitiv-ity of the modelled CO2column to the vertical aerosol pro-file may largely account for the large standard deviations of the measurements. In line with the model calculations, the measurements show lower values in October than in July, al-though the measured difference seems slightly less.
3.3 Global extrapolation
This subsection addresses the question of how significant
aerosol-induced errors in SCIAMACHY-observed CO2 are
on the global scale. The upper panel of Fig. 5 shows an-nually averaged CO2 errors as calculated by the procedure that was outlined in Sect. 2.3. The radiative transfer model calculations assume that the aerosol optical thickness is dis-tributed evenly over a globally uniform 1 km thick boundary layer decaying towards higher altitudes with the third power of pressure. This procedure has been applied to all aerosol classes except dust, which has been evenly distributed over the first 3 km only.
2
Not surprisingly, the largest errors are found over the deserts, owing to the high surface albedo in combination with relatively large aerosol loads. These conditions are satis-fied the most over the Sahara desert. High aerosol optical thicknesses are also predicted for some parts of Asia but the errors in CO2are lower because of a lower surface albedo (see Fig. 1). The relatively coarse dust and sea salt parti-cles scatter SWIR radiation more efficiently than the much smaller sulfate and soot particles. The influence of sea salt particles, however, remains limited in the absence of SCIA-MACHY measurements over the oceans. As can be seen in Fig. 5 the sign of the annual mean aerosol error is predomi-nantly positive. The model predicts that, for aerosol classes other than soot, CO2columns will be overestimated for sur-face albedos >0.1, which is generally the case over land (see Fig. 1). Nevertheless, monthly maps of aerosol error (not presented) show reductions of column CO2in regions with intensive biomass burning, explained by absorption of radia-tion on soot particles, and in dense boreal coniferous forests with low surface albedo.
Inverse modelling calculations confirm that the aerosol-induced errors in the measured CO2 total column are too large to allow meaningful source and sink estimates. Gen-erally, large errors are found with a pronounced maximum over the Sahara. The posterior fluxes have been integrated annually over the 22 continental scale TRANSCOM regions (Gurney et al., 2002). For North Africa several Pg of carbon are needed to bring the model in agreement with the mea-surements. Even for Temperate North America (the contigu-ous United States) an error of 0.4 Pg/yr is found, exceeding the uncertainty of inverse modelling estimates for this region on the basis of the surface monitoring network reported by Gurney et al. (2002). In practice, one would decide to ig-nore the data over deserts and use the remaining data to ob-tain improved flux estimates. For SCIAMACHY this means a reduction of the number of available data by as much as about 33%, which is explained by the predominantly cloud free conditions over deserts. Still, our inversion results show errors in the annual CO2 flux of a few tenths of a Pg car-bon for several continental TRANSCOM regions. This is explained partly by incomplete filtering of desert dust con-taminated data and partly due to other sources of aerosol. These results confirm that the influence of aerosols on SCIA-MACHY retrieved CO2are a global problem, that must be corrected to allow a meaningful interpretation.
4 Discussion
In the previous section we have demonstrated a reasonable
correspondence between SCIAMACHY-retrieved CO2 and
TOMS and MISR observed dust over the Sahara. The ques-tion arises of how good the correlaques-tion should be if path-length perturbation by dust aerosols were the main mecha-nism explaining the observed CO2variability. We have tried
to quantify the influence of other potential sources of error
by correlating SCIAMACHY CO2with orography, apparent
and surface albedo, column mean temperature, and specific humidity. None of these parameters could explain a signifi-cant part of the remaining variance. Our claim that the ver-tical distribution is an important factor is mainly supported by the sensitivity of our multiple scattering calculations to the assumed aerosol vertical profile. Besides this, the corre-lation between TOMS and MISR data hints in the same di-rection. Those correlations are comparable with the correla-tion between SCIAMACHY and MISR. Like SCIAMACHY, TOMS AI is sensitive to the vertical distribution of aerosol, although the relationship is quite different. In cases where both MISR and TOMS show high dust load SCIAMACHY CO2tends to be notably high as well, which might be ex-plained by a combination of high albedo, high dust load and the occurrence of dust at higher elevation. Part of the re-maining variance may also be explained by undetected cirrus clouds, although this should only play a minor role over the Sahara owing to the large scale subsidence of air at these lat-itudes suppressing cloud formation.
When comparing Fig. 2 and 3 it may seem that TOMS AI
correlates better with SCIAMACHY CO2than MISR AOD.
If the same data selection procedure is followed to compute correlations between SCIAMACHY and TOMS, however, it turns out that these correlations are in fact lower by ∼r=0.1. It looks like the correlation on the scale of a few 100 km2is higher than that on the scale of the measurements. This may be explained by errors comparing different data products resulting from differences in footprints and overpass time, which might average out partially at larger scales. While the vertical distribution of dust remains a plausible candidate to explain the remaining variance, we cannot exclude contribu-tions from other processes that are currently overwhelmed by dust in our data but, in absence of dust, may nevertheless be significant at the high level of accuracy that is required for CO2. For example, our calculated aerosol errors do not seem to explain the overestimated SCIAMACHY-observed CO2seasonal cycle of 20 ppm in the retrievals versus 5 ppm in the model reported reported by (Buchwitz et al., 2005), hinting at some other significant source of error.
Our global assessment points out that aerosol-induced er-rors of ∼10% of the CO2column, as found over the Sahara, are not representative for the rest of the world but rather should be considered a worst case. Nonetheless, averaged over all continents, the error amounts to ∼3 ppm, which is substantially higher then the 1 ppm that was previously pub-lished by Dufour and Breon (2003), who took only single scattering (either by aerosols or by the Earth surface) into account. As a consequence of the use of such a simplified radiative transfer model, Dufour and Breon (2003) [as well as O’Brien and Rayner (2002)] only report underestimation of CO2due to aerosols, while our multiple scattering calcu-lations point to a more complex behavior related to surface albedo supporting the model analysis by Mao and Randolph
Kawa (2004) and resulting in overestimation for most condi-tions encountered over the continents. The fact that we can
largely explain the SCIAMACHY CO2 measurements over
the Sahara confirms that our current approach is probably more realistic. Although the importance of multiple scatter-ing over bright surfaces and high aerosol loads of the Sahara may seem obvious, according to our results, it should also be taken into account elsewhere. Nevertheless, our global approach is also limited, in particular, by the simplified treat-ment of the vertical aerosol profile. For example, a layer of enhanced aerosol optical thickness near the tropopause that is predicted by the LMDz model has been neglected as sen-sitivity tests suggest that its impact should only be minor.
Analysis of SCIAMACHY CO2 and aerosol measurements
in other regions could provide further insight, and has been planned as a next step.
What are the options for correcting the SCIAMACHY CO2data product for aerosols? One possibility is to include an aerosol scattering algorithm in the CO2retrieval, which, for SCIAMACHY, would require additional information on the local aerosol optical depth and its vertical distribution, as well as information on the local surface albedo. Further information could be gained from CO2 absorption around 2.0 µm. Those wavelengths, however, are measured by an-other SCIAMACHY channel which suffers from ice layer formation (see Gloudemans et al., 2005) and possibly other calibration problems (see Lichtenberg et al., 2005) introduc-ing significant complications. The use of O2absorption in the O2 A-band has been proposed to directly measure the CO2/O2 mixing ratio (O’Brien and Rayner, 2002; Dufour and Breon, 2003; Buchwitz et al., 2005). Therein lies the advantage that this parameter can easily be converted to the dry air mixing ratio, which is the relevant parameter for at-mospheric modelling. It has been suggested that the same procedure would eliminate aerosol-induced pathlength de-viations. However, this has not yet been proven for SCIA-MACHY measurements and problems are expected to arise from different scattering properties at 0.7 µm (O2-A) and 1.6 µm (CO2) (see van Diedenhoven et al., 2005). In
sum-mary, there are options to correct SCIAMACHY CO2
mea-surements for aerosols, which call for further investigation. Uncorrected or partially corrected CO2measurements might still be valuable in regions with moderate surface albedo and relatively low aerosol loads.
What is the relevance of our findings for other satellite missions aiming at measuring CO2? Towards longer wave-lengths aerosol scattering will become less important, which is why aerosols are not expected to complicate CO2 mea-surements in TIR. However, AIRS meamea-surements do show a significant influence of desert dust on the observed infrared brightness temperatures, with potential implications for CO2 measurements at these wavelengths (Pierangelo et al., 2004). For the OCO mission a combination of measurements at 0.7 µm (O2-A), 1.6 µm (CO2) and 2.0 µm (CO2) has been proposed at high spectral resolution (0.075 nm) to correct for
the effect of scattering layers on the apparent CO2 content. According to the theoretical study by Kuang et al. (2002) this approach should allow a precision of ∼0.3–2.5 ppm for aerosol optical thicknesses less than 0.3. Although SCIA-MACHY cannot be used to fully test the OCO approach, it might nevertheless be possible to verify certain assump-tions of theoretical performance assessments, for example, related to the path length perturbation due to aerosol scatter-ing when measurscatter-ing in sun glint. A potential alternative op-tion in SWIR is the use of active instrumentaop-tion, such as a DIfferential Absorption Lidar (DIAL). In this case the delay between the emission and detection of laser pulses provides a measure of path length, which could in principle be used to strongly reduce the influence of aerosols.
5 Conclusions
We have analyzed SCIAMACHY measurements of total col-umn CO2 showing large variability over the Sahara. The
correlation of SCIAMACHY CO2and coincident TOMS AI
and MISR AOD measurements provides strong evidence that the unrealistically large CO2variability of 10% (37 ppm) of the total column is caused by mineral dust aerosol. Radia-tive transfer model calculations show that aerosol-induced pathlength enhancement can explain the size of the observed variations. Aerosol optical depth explains about 50% of the observed CO2 variability. Model calculations show large sensitivity of the CO2 column to the aerosol vertical pro-file, which seems the most likely candidate to explain the remaining variance. A model-based extrapolation to regions outside the Sahara leads to the conclusion that aerosols will
mostly increase SCIAMACHY-observed CO2mixing ratios
over continents, by 3 ppm on average. Inverse modelling cal-culations clearly point out that such errors are too large to allow improved source and sink estimates. However, fur-ther analysis of SCIAMACHY measurements is needed to confirm the model predicted size of aerosol-induced errors outside the Sahara. The outcome of this study has important implications for future instruments aiming at measuring CO2 from space at SWIR wavelengths, and may be used to verify theoretical assessments of methods to account for pathlength perturbation by aerosol scattering.
Acknowledgements. We like to thank the SCIAMACHY and
EN-VISAT teams who have participated in the planning, building, launching and operating of the SCIAMACHY instrument. Further, we thank The Netherlands SCIAMACHY Data Centre (NL-SCIA-DC) for providing us data and processing services. This work has benefited from useful discussions with O. Hasekamp and B. van Diedenhoven, and a constructive review by R. Engelen. The MISR data were obtained from the NASA Langley Research Centre Atmo-spheric Sciences Data Center. The TOMS data were made available by the Goddard Space Flight Centre. We thank SARA for the use of their high performance computing facilities. Part of this study was financially supported by the EC project COCO (EVG1-CT-2001-00056).
2
Edited by: H. Kelder
References
Berk, A., Anderson, G. P., Acharya, P. K., Chetwynd, J. H., Bern-stein, L. S., Shettle, E. P., Matthew, M. W., and Adler-Golden, S. M.: MODTRAN-4 user’s manual, Tech. rep., Air Force Re-search Laboratory, Hanscom MA, 1999.
Bovensmann, H., Burrows, J. P., Buchwitz, M., Frerick, J., No¨el, S., Rozanov, V. V., Chance, K. V., and Goede, A. P. H.: SCIA-MACHY: Mission objectives and measurement modes, J. Atmos. Sci., 56, 127–150, 1999.
Buchwitz, M., de Beek, R., Burrows, J. P., Bovensmann, H., Warneke, T., Notholt, J., Meirink, J. F., Goede, A. P. H., Bergam-aschi, P., K¨orner, S., Heimann, M., Muller, J.-F., and Schulz, A.: Atmospheric methane and carbon dioxide from SCIAMACHY satellite data: initial comparison with chemistry and transport models, Atmos. Chem. Phys., 5, 941–962, 2005,
SRef-ID: 1680-7324/acp/2005-5-941.
Buchwitz, M., de Beek, R., Burrows, J. P., Bovensmann, H., Warneke, T., Notholt, J., Meirink, J. F., Goede, A. P. H., Bergam-aschi, P., K¨orner, S., Heimann, M., Muller, J.-F., and Schulz, A.: Atmospheric methane and carbon dioxide from SCIAMACHY satellite data: Initial comparison with chemistry and transport models, Atmos. Chem. Phys., 5, 941–962, 2005,
SRef-ID: 1680-7324/acp/2005-5-941.
CarboEurope-IP: Assessment of the European Terrestrial Carbon balance, Tech. rep., EU Sixth Framework Programme, priority 1.1.6.3 Global Change and Ecosystems, 2004.
Ch´edin, A., Hollingsworth, A., Scott, N. A., Serrar, S., Crevoisier, C., and Armante, R.: Annual and seasonal variations of at-mospheric CO2,N2O and CO concentrations retrieved from
NOAA/TOVS satellite observations, Geophys. Res. Lett., 29, doi:10.1029/2001GL14 082, 2002a.
Ch´edin, A., Serrar, S., Armante, R., Scott, N. A., and Hollingsworth, A.: Signatures of annual and seasonal variations of CO2and other greenhouse gases from comparisons between
NOAA TOVS observations and radiation model simulations, J. Clim., 15, 95–116, 2002b.
Chiapello, I., Prospero, J. M., Herman, J. R., and Hsu, N. C.: De-tection of mineral dust over the North Atlantic Ocean and Africa with the Nimbus 7 TOMS, J. Geophys. Res., 104, 9277–9292, 1999.
Conway, T. J., Tans, P. P., Waterman, L. S., and Thoning, K. W.: Evidence for interannual variability of the carbon cycle from the national oceanic and atmospheric administration climate moni-toring and diagnostics laboratory global air sampling network, J. Geophys. Res., 99, 22 831–22 855, 1994.
Crevoisier, C., Heilliette, S., Ch´edin, A., Serrar, S., Armante, R., and Scott, N. A.: Midtropospheric CO2concentration retrieval from AIRS observations in the tropics, Geophys. Res. Lett., 31, doi:10.1029/2004GL020 141, 2004.
d’Almeida, G. A., Koepke, P., and Shettle, E. P.: Atmospheric aerosols: Global climatology and radiative characteristics, A. Deepak Publishing, Hampton, Virginia, USA, 1991.
de Reus, M., Dentener, F. J., Thomas, A., Borrmann, S., Str¨om, J., and Lelieveld, J.: Airborne observations of dust aerosol over the North Atlantic Ocean during ACE 2: Indications for heteroge-neous ozone destruction, J. Geophys. Res., 105, 15 263–15 275, 2000.
Dufour, E. and Breon, F.-M.: Spaceborne estimate of atmospheric CO2 column using the differential absorption method: Error
analysis, Appl. Opt., 42, 3595–3609, 2003.
Engelen, R. J., Andersson, E., Chevallier, F., Hollingsworth, A., Matricardi, M., McNally, A. P., and J.-N. Th´epaut, P. D. W.: Estimating atmospheric CO2 from advanced infrared satellite
radiances within an operational 4D-Var data assimilation sys-tem: Methodology and first results, J. Geophys. Res., 109, doi:10.1029/2004JD004 777, 2004.
Frankenberg, C., Platt, U., and Wagner, T.: Iterative maximun a posteriori (IMAP)-DOAS for retrieval of strongly absorbing trace gases: Model studies for CH4and CO2retrieval from near infrared spectra of SCIAMACHY onboard ENVISAT, Atmos. Chem. Phys., 5, 9–22, 2005,
SRef-ID: 1680-7324/acp/2005-5-9.
GLOBALVIEW-CO2: Cooperative Atmospheric Data Integration
Project – Carbon Dioxide. [CD-ROM], Tech. rep., Clim. Monit. and Diagnostics Lab., Natl. Oceanic and Atmos. Admin., Boul-der, Colo., also available on internet via anonymous FTP to ftp.cmdl.noaa.gov, path: ccg/co2/GLOBALVIEW, 2004. Gloudemans, A. M. S., Schrijver, H., Kleipool, Q., van den Broek,
M. M. P., Straume, A. G., Lichtenberg, G., van Hees, R. M., Aben, I., and Meirink, J. F.: The impact of SCIAMACHY near-infrared instrument calibration on CH4 and CO total columns,
Atmos. Chem. Phys., 5, 2369–2383, 2005, SRef-ID: 1680-7324/acp/2005-5-2369.
Gurney, K. R., Law, R. M., Denning, A. S., et al.: Towards robust regional estimates of CO2sources and sinks using atmospheric transport models, Nature, 415, 626–630, 2002.
Hasekamp, O. P. and Landgraf, J.: A linearized vector radiative transfer model for atmospheric trace gas retrieval, J. Quant, Spec-trosc. Radiat. Transfer, 75, 221–238, 2002.
Hasekamp, O. P. and Landgraf, J.: Linearization of vector radiative transfer with respect to aerosol properties and its use in remote sensing, J. Geophys. Res., in press, 2005.
Hauglustaine, D. A., Hourdin, F., Jourdain, L., Filiberti, M.-A., Walters, S., Lamarque, J.-F., and Holland, E. A.: In-teractive chemistry in the Laboratoire de M´et´eorologie Dy-namique general circulation model: Description and back-ground tropospheric chemistry evaluation, J. Geophys. Res., 109, doi:10.1029/2003JD003 957, 2004.
Haywood, J., Francis, P., Osborne, S., Glew, M., Loeb, N., High-wood, E., Tanre, D., Myhre, G., Formenti, P., and Hirst, E.: Ra-diative properties and direct raRa-diative effect of Saharan dust mea-sured by the C-130 aircraft during SHADE: 1. Solar spectrum, J. Geophys. Res., 108, doi:10.1029/2002JD002 687, 2003. Heimann, M. and K¨orner, S.: The global atmospheric tracer model
TM3, Model description and user’s manual Release 3.8a, Max Planck Institute of Biogeochemistry, 2003.
Herman, J. R., Bhartia, P. K., Torres, O., Hsu, C., Seftor, C., and Celarier, E.: Global distribution of UV-absorbing aerosols from Nimbus 7/TOMS data, J. Geophys. Res., 102, 16 911–16 922, 1997.
Holben, B. N., Eck, T. F., Slutsker, I., Tanre, D., Buis, J. P., Set-zer, A., Vermote, E., Reagan, J. A., Kaufman, Y. J., Nakajima, T., Lavenu, F., Jankowiak, I., and Smirnov, A.: AERONET – a federated instrument network and data archive for aerosol char-acterization, Rem. Sens. Environ., 66, 1–16, 1998.
Houweling, S., Breon, F.-M., Aben, I., R¨odenbeck, C., Gloor, M., Heimann, M., and Ciais, P.: Inverse modeling of CO2sources
and sinks using satellite data: A synthetic inter-comparison of measurement techniques and their performance as a function of space and time, Atmos. Chem. Phys., 4, 523–548, 2003, SRef-ID: 1680-7324/acp/2004-4-523.
Hsu, N. C., Herman, J. R., Torres, O., Holben, B. N., Tanre, D., Eck, T. F., Smirnov, A., Chatenet, B., and Lavenu, F.: Comparisons of the TOMS aerosol index with sun-photometer aerosol opti-cal thickness: Results and applications, J. Geophys. Res., 104, 6269–6280, 1999.
Kahn, R. A., Gaitley, B. J., Martonchik, J. V., Diner, D. J., Crean, K. A., and Holben, B.: Multiangle Imaging Spectroradiometer (MISR) global aerosol optical depth validation based on 2 years of coincident Aerosol Robotic Network (AERONET) observa-tions, J. Geophys. Res., 110, doi:10.1029/2004JD004 706, 2005. Karyampudi, V. M., Palm, S. P., Reagan, J. A., Fang, H., Grant, W. B., Hoff, R. M., Moulin, C., Pierce, H. F., Torres, O., Browell, E. V., and Harvey Melfi, S.: Validation of the Saharan dust plume conceptual model using lidar, Meteosat, and ECMWF data, Bull. Am. Meteorol. Soc., 80, 1045–1075, 1999.
Krijger, J. M., Aben, I., and Schrijver, H.: Distinction between clouds and ice/snow covered surfaces in the identification of cloud-free observations using SCIAMACHY PMDs, Atmos. Chem. Phys., 5, 2729–2738, 2005,
SRef-ID: 1680-7324/acp/2005-5-2729.
Kuang, Z., Margolis, J., Toon, G., Crisp, D., and Yung, Y.: Space-born measurements of atmospheric CO2by high-resolution NIR spectrometry of reflected sunlight: An introductory study, Geo-phys. Res. Lett., 29, doi:10.1029/2001GL014 298, 2002. Mao, J. and Randolph Kawa, S.: Sensitivity Studies for
Space-Based Measurement of Atmospheric Total Column Carbon Diox-ide by Reflected Sunlight, Appl. Opt., 43, 914–927, 2004. Martonchik, J. V., Diner, D. J., Kahn, R., Gaitley, B., and
Hol-ben, B. N.: Comparison of MISR and AERONET aerosol optical depths over desert sites, Geophys. Res. Lett., 31, doi:10.1029/2004GL019 807, 2004.
NACP: The North American Carbon Plan, A report of the NACP committee of the U.S. carbon cycle sterring Group, Tech. rep., S. C. Wofsy and R. C. Harriss, co-chairs, 2002.
O’Brien, D. M. and Rayner, P. J.: Global observations of the carbon budget, 2. CO2column from differential absorption of reflected
sunlight in the 1.61 µm band of CO2, J. Geophys. Res., 107,
doi:10.1029/2001JD000 617, 2002.
Pierangelo, C., Ch´edin, A., Heilliette, S., Jacquinet-Husson, N., and Armante, R.: Dust altitude and infrared optical depth from AIRS, Atmos. Chem. Phys., 4, 1813–1822, 2004,
SRef-ID: 1680-7324/acp/2004-4-1813.
Prospero, J. M., Ginoux, P., Torres, O., Nicholson, S. E., and Gill, T. E.: Environmental characterization of global sources of atmo-spheric soil dust identified with the Nimbus 7 total ozone map-ping spectrometer (TOMS) absorbing aerosol product, Rev. Geo-phys., 40, doi:10.1029/2000RG000 095, 2000.
Rothman, R. L., Barbe, A., Benner, D. C., et al.: The HITRAN molecular spectroscopic database, edition of 2000 including up-dates through 2001, J. Quant. Spectrosc. Radiat. Transfer, 82, 5–44, 2003.
Schrijver, H.: Retrieval of carbon monoxide, methane and nitrous oxide from Sciamachy measurements, in: Proc. European Sym-posium on Atmospheric Measurements from Space, pp. 285– 294, ESA WPP-161 1, ESTEC Noordwijk, The Netherlands, 1999.
Tarantola, A.: Inverse Problem Theory, Methods for Data Fitting and Model Parameter Estimation, Elsevier, New York, 1987. Torres, O., Bhartia, P. K., Herman, J. R., Ahmad, Z., and Gleason,
J.: Derivation od aerosol properties from satellite measurements of backscattered ultraviolet radiation: Theoretical basis, J. Geo-phys. Res., 103, 17 099–17 110, 1998.
van Diedenhoven, B., Hasekamp, O. P., and Aben, I.: Surface pressure retrieval from SCIAMACHY measurements in the O2
A Band: validation of the measurements and sensitivity on aerosols, Atmos. Chem. Phys., 5, 2109–2120, 2005,