HAL Id: cea-03122166
https://hal-cea.archives-ouvertes.fr/cea-03122166
Submitted on 13 Apr 2021
HAL is a multi-disciplinary open access
archive for the deposit and dissemination of
sci-entific research documents, whether they are
pub-lished or not. The documents may come from
teaching and research institutions in France or
abroad, or from public or private research centers.
L’archive ouverte pluridisciplinaire HAL, est
destinée au dépôt et à la diffusion de documents
scientifiques de niveau recherche, publiés ou non,
émanant des établissements d’enseignement et de
recherche français ou étrangers, des laboratoires
publics ou privés.
systems using multi-carrier signals
Christophe Layer, Esteban Cabanillas, Moussa Kafal, Antoine Dupret
To cite this version:
Christophe Layer, Esteban Cabanillas, Moussa Kafal, Antoine Dupret. Enhancing the spatial
reso-lution for wire fault detection systems using multi-carrier signals. IEEE Sensors Journal, Institute
of Electrical and Electronics Engineers, 2018, 18 (23), pp.9857-9866. �10.1109/JSEN.2018.2872409�.
�cea-03122166�
Enhacing the Spatial Resolution for Wire Fault
Detection Systems using Multi-Carrier Signals
Esteban Cabanillas, Christophe Layer, Senior Member, IEEE,
Moussa Kafal, Member, IEEE and Antoine Dupret, Member, IEEE
Abstract—Recently, the world is witnessing a vast daily de-velopment in technology accompanied with more and more complex electronic systems. They are hosting cumulated lengths of electrical cables that are subject one day or another to the occurrence of wiring faults. Accordingly, wire diagnosis became essentially important for ensuring safety, security, integrity and optimal performance. On the other hand, the emergence of sensor networks and connected objects have created the need for embedded and non invasive fault diagnosis solutions. Notably, multi-carrier reflectometry methods have shown promising and efficient results in locating upcoming defects on wires in an online manner. Nevertheless, their precision stays within the physical limits of their components, especially the sampling frequency of their analog/digital transitions. In this paper, we will propose several approaches combining multi-carrier reflectometry with phase analysis techniques to overcome this limit. Accordingly, an improvement in the precision of the fault localization and a high spatial resolution is obtained. Based on an FPGA implementation, our novel methods and the resulting systems have proven a five-times better accuracy than state-of-the-art methods on the same platform.
Keywords—Reflectometry, phase analysis, Fourier transform, multi-carrier, defect diagnosis, high precision sensing.
I. INTRODUCTION
Since the invention of the first known typical electrical cable in 1892, the world is living a paradigm shift of hy-draulic, pneumatic, mechanical, control and auxiliary systems to electrical systems. In fact, this was accompanied with a huge demand for electrical components along with a massive reckoning on electrical cables. For instance, they can be found in transportation systems, communication networks, industrial machinery, power plants, infrastructures, in addition to most of today’s human facilities and utilities.
In practice, cables are always used in distribution networks where a set of cables, usually of the same type, interconnect according to well defined topology standards (bus, star, mesh, ring, tree, etc.). On the other hand, one day or another, any complex system embracing cumulated lengths of wired
E. Cabanillas, M. Kafal, C. Layer and A. Dupret are with the Commissariat `a l’ ´Energie Atomique (CEA), Department of Architectures and Embedded Soft-ware Engineering (DACLE), at the Laboratoire de Fiabilisation et d’Int´egration des Capteurs (LFIC), Nano-Innov Bˆat. 862-PC172, 91191 Gif-sur-Yvette Cedex, France.{name.surname}@cea.fr.
An introductory version of this paper has been presented at the 2017 IEEE SENSORS Conference and published in its proceedings under the reference http://ieeexplore.ieee.org/document/8234182
Manuscript received April 00, 0000; revised June 00, 0000.
connections is highly likely exposed to internal and external compelling conditions. These include factors not limited to heating, humidity, pressure, vibration, etc., thus leading to the appearance of anomalies often referred to as faults.
Wiring faults may be localized on a point or short section of a line or distributed on a longer length. For instance, they may lead to a total interruption of transmission as in the case of hard faults (open or short circuits) that can also electrically sever a line into two separate portions. Meanwhile, soft faults are characterized by slightly modifying the cable properties, without causing a significant impact on the whole system operation (insulation damage, frays, cracks, etc.).
Throughout the last few decades, strenuous efforts have been invested in research and industry to study and develop techniques capable of detecting the presence, location and characteristics of wiring faults. As a matter of fact, a great number of embedded systems dedicated to safety and comfort communicate with increasingly important data rates in order to fulfill severe real-time constraints. These constraints imply to have at disposal a trustworthy physical support to guarantee both quality of service and reliability. Accordingly, monitoring failures and troubleshooting cables have become an important issue in order to ensure safe operation, high performance and cost effectiveness. Incipient or soft faults have been extensively handled in current literature where recent studies have focused on the application of time reversal (TR) to the problem of soft fault location and showed high accuracy and robustness against fault impedances [1]–[6]. Impedance spectroscopy [7], inverse scattering [8] and methods based on the estimation of the per unit length resistance profileR(z) of a cable under test (CUT) [9] have also proven proficiency in this mission.
While several electric and nonelectric wire diagnosis meth-ods have been proposed, reflectometry-based methmeth-ods are still the cutting edge of most embedded and distributed wire diagnosis systems [10]–[13]. Basically relying on the analysis of the electrical waves reflected on impedance mismatches (IMis) along a network under test (NUT), Time-Domain Reflectometry (TDR) injects a test signal x(t) on the CUT, analyzes the behavior of the IMis’s reflected echo y(t) and detects the potential reflections through a correlation Γxy(t)
given by Γxy(t) = Z ∞ −∞ y(τ + t) · x∗ (τ ) dτ (1) withτ denoting the lag.
Despite the criticality of soft fault detection due to their: 1) dispersive nature accompanied with phase pattern change of the testing signal, 2) weak reflected echoes that can be easily masked by minor vibrations in a NUT or the presence of noise, etc. [11], [14], [15], studies conducted on accident investigations of fires in facilities, airplane crashes, system breakdowns, etc. have shown a strong correlation with hard faults [16]. Although, hard faults have been the center pivot of research in the early stages of reflectometry methods, major concerns related to the accuracy and resolution of location, complexity of testing setups in addition to the application in online operating systems have been and are still forming a debatable controversial issue. More importantly is the problem of intermittent hard faults that are not permanent faults and occur in very short durations. Particularly, an arc fault creates a high power discharge of electricity between two or more conductors; this can be considered as a short circuit during a very short instant. Such sporadic faults may have duration less than 1 ms. Thus, they are not always guaranteed to be caught during a standard reflectometry measurement after which the wiring system would behave normally as if nothing happened. However, the intermittent transients are the incipient events of a precursor of permanent faults to come.
Reviewing subsequent and more recent literature [11], [17], standard TDR methods are based on the idea of testing the NUT by means of a specifically designed signal (pulsed, harmonic, or an ad hoc signal, etc.) applied to an input port coupled to the NUT. As any method based on time-domain analysis, TDR relies on the availability of potentially large bandwidths, in order to create the conditions for spatial resolution. The spatial resolution ∆R enabled by a test signal
is directly proportional to its spatial support or that of its autocorrelation function, given by
∆R= k
v
BW (2)
where v is the speed of propagation of electrical signals along the cables of the NUT andBW is the bandwidth of the test signals;k is a constant of the order of unity, dependent on the shape of the test signals. Limitations are thus introduced by the ability of cables in an NUT to support such bandwidths, as in the case of low-frequency networks, such as power grids. Besides, this shall also entail complex testing setups, poor performance in terms of energy efficiency, and consequently preventing this method from being suitable for embedded systems and distributed sensors networks.
It is important to note that, live testing is of practical importance, since it does not require turning off all the electronic equipment that normally use the NUT as a power or communication infrastructure; also known as embedded testing, this approach works in the background of the normal operation of the NUT. But online network testing without impacting the functionality of a system necessitates specific testing signals that do not interfere with the useful signals operating in the network. Eventually, Spread Spectrum TDR (SSTDR) [10], Multi Carrier TDR (MCTDR) [18], [19], Or-thogonal Multi-tone TDR (OMTDR) [20], [21], Chaos TDR (CTDR) [22], [23] and modulated variants of the OMTDR
[24], [25] provided promising and robust results in live cable-diagnosis. Particularly, they have allowed a complete control of the spectrum of the injected signal which shall not interfere with the system under test (SUT).
In the literature of OMTDR, the Orthogonal Frequency Division Multiplexing (OFDM) concept is used [20]. Basi-cally, it divides the channel bandwidth into many sub-carriers independently modulated, hence achieving high data rate trans-mission, interference robustness against native signals on live cables, bandwidth efficiency and complete spectrum control. On the other hand, enhancing the spatial resolution and fault location accuracy relies on methods that periodically inject the testing signal into the CUT [26], [27]. Such approaches would require real-time sampling thus imposing the use of high-speed analogue-to-digital converters (ADC), which can be both expensive and power consuming. To bypass this problem, stroboscopic sampling can increase the performance of the de-tector by emulating a faking oversampling which periodically time-shifts the sampling phase [28]. Nevertheless, they are still costly, very slow, and totally jitter intolerant. Regrettably, their long acquisition times make them also unsuitable and inefficient for intermittent fault detection.
To cope with the aforementioned limitations, we propose in this paper several approaches based on the fusion of the OFDM multi-carrier signals used in the OMTDR with low-cost efficient stroboscopic sampling techniques and frequency domain analysis methods. The result would be the production of low complexity system architectures capable of performing relatively fast acquisitions while resulting in a high spatial resolution and precision of the fault’s locations.
The paper is organized as follows. Section II describes the basic aspects of the OMTDR method during which a brief overview of the system’s hardware implementation is reviewed. In this section, we show that improving the fault location accuracy is directly related to increasing the sampling fre-quency of the analog-to-digital and digital-to-analog converters (ADC and DAC). Section III shows that developing faster ADCs and DACs is confronted by several obstacles namely the system’s complexity and cost. Accordingly, three different approaches are presented to provide an efficient, low cost and less complex solutions. The first is demonstrated by an existing stroboscopic sampling technique based on the incremental phase-offset shifting method presented in section III-A. Later on, section III-B displays a novel technique relying on the usage of a constant frequency offset. The third method is a novel approach based on the phase analysis of the multi-carrier reflected signals and is presented in section III-C. A feasibility proof is accomplished in section IV where simulation and experimental results using an FPGA platform and external analog converters are established to validate the potential reliability and efficient implementation of the proposed tech-niques. Section IV-C presents a comparison between the three presented methods and that of the standard OMTDR method (SOMTDR) in therms of the fault location error and acquisition duration. Finally, section V concludes this paper by addressing the final remarks on the performance of the proposed methods and draws some perspectives for future work.
II. PRINCIPLES OF THE STANDARDOMTDR SYSTEM
A simplified model of an OMTDR system is presented in Fig. 1. The sub-carriers of the reflectometry signal X(f ) are computed by the OFDM generator block, which performs an N -PSK digital modulation and applies a Hermitian symmetry. Each sub-carrier is defined as:
|X(fn)| = 1 ∀ fn and φ(fn) = φn = i
2π
M (3) where M is the PSK modulation order (4 for Q-PSK, 8 for 8-PSK, etc.) andi can take any value between 0 and M − 1.
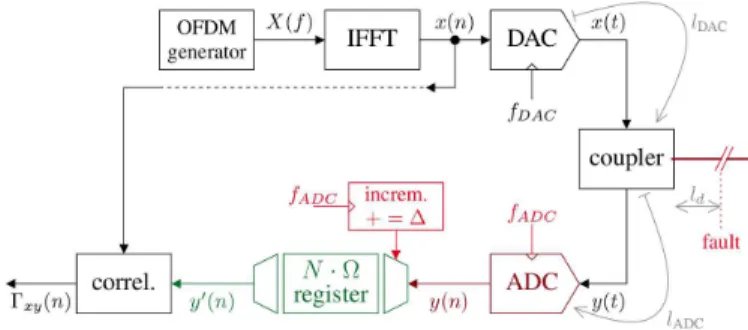
Fig. 1. Schematic diagram of a standard OMTDR based cable diagnosis system using a correlator between the injected signalx(n) and the reflected signaly(n) to detect the location of a fault in a CUT.
The time-domain discrete signal x(n) is obtained by com-puting an Inverse Fast-Fourier Transform (IFFT) of the OFDM sub-carriers after-which a DAC generates x(t), the analog domain version of x(n). x(t) is then injected to the coupler linking the DAC with the CUT and the ADC. The injected signal x(t) travels over the CUT and reflects back once an impedance mismatch is met. In this case, the reflected signal y(t) is sampled by the ADC to give rise to the discrete signaly(n). The process of estimating the fault location is ac-complished by a correlator block applying a cross-correlation function between the injected and reflected signal. In effect, the OMTDR reflectometry method is equivalent to an OFDM communicating system which determines a multi-path channel transfer function before data transmission.
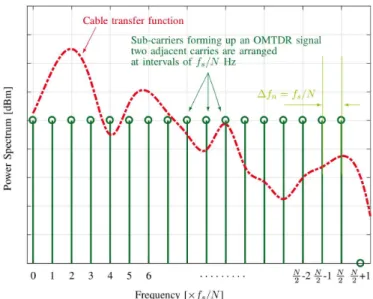
Fig. 2 illustrates both the OMTDR signal spectrum X(fn)
withfnbeing the frequency of each orthogonal sub-carrier, and
the frequency domain cable transfer functionH(f ). In partic-ular,H(f ) is computed as a function of the cable’s attenuation function HC(f ) and a phase function φC(f ). Thereupon, the
frequency domain received signalY (fn) discretely defined for
each sub-carrier of frequencyfn is defined as:
Y (fn) = X(fn)HC(fn)e
−jφC(fn)
(4) Applying time-domain cross-correlation is reciprocal to fre-quency domain multiplication. Accordingly, the cable transfer function can be obtained by:
H(fn) = Y (fn)X∗(fn) (5) = X(fn)HC(fn)e −jφC(fn) X∗ (fn) (6) = ejφn HC(fn)e −jφC(fn) e−jφn (7) = HC(fn)e −jφC(fn) (8) where (∗
) is the conjugate of a complex value. The cable impulse response is then obtained by performing an IFFT to the resulting frequency domain cable transfer function H(f ). This impulse response is often referred to as reflectogram, and is used to localize and analyze each impedance discontinuity over the CUT. As a matter of fact, two properties usually determine the performance of a reflectometry system: the maximal distance to the fault lmax and the spatial resolution
δl .
Starting with lmax, its value is a function of the number of
sub-carriers,N , considered in the injected OMTDR signal: lmax= vg ∆fn = N · vg fs (9) As seen in Fig. 2,∆fn is the frequency difference between
two adjacent sub-carriers, fs is the DAC and ADC sampling
frequency and vg is the propagation speed on the cable.
A trade-off between the desired lmax and N is done for
each reflectometry system since the number of sub-carriers is directly related to FFT/IFFT sizes and consequently to the digital system complexity.
The spatial resolution δl refers to the accuracy of position
of a fault along the CUT, as shown in Fig. 3. This propertyδl
is defined as follows:
δl=
vg
2fs
(10) In fact, maximizing δl is a major challenge for future
reflec-tometry system implementations. Accordingly, the sampling frequency of the ADC and DAC should be incremented. Unfortunately, this will physically limit their accuracy and skyrocket their cost leading to a non practical system imple-mentation from a commercial marketing aspect. Moreover, as described in eq. (9), increasing the sampling frequency reduces
Fig. 2. Positive part of the spectrum of an OMTDR signalX(fn) with N sub-carriers (green) and the cable frequency-domain transfer function (red) defined in the same band as the multi-carrier signal, i.e.,fs/2 with fsbeing the DAC sampling frequency.
Fig. 3. Two reflectograms illustrating the spatial resolution δl. The mea-surement error of a fault location over a CUT is always lower thanvg/Ts meters, which is represented by the length difference between solid red and dashed-green reflectograms.
lmax, and so is the range of the fault detection system for a
given number of sub-carriers N . Following, we present three different techniques capable of efficiently bypassing the limits ofδl without degrading the range or the material complexity.
III. METHODS FOR ENHANCING THE SPATIAL RESOLUTION
It has been explained in the previous section that increasing the sampling frequency of the ADC would improve the local-ization of any defect appearing on the CUT. However, more efficient conversion devices such as DAC or ADC become very expensive as either the resolution or the sampling frequencies increase. This section will present three promising methods for drastically improving the precision of the detection, using standard components for the ADC and also avoiding the use of clock-domain crossing mechanisms.
A. Incremental phase-offset shifting (IPS)
Because the periodically injected signalx(t) is assumed to be stationary on the CUT, it is possible to rely on an incre-mental phase-offset shifting technique to sample the received signal at arbitrarily spaced time-stamps.
This method includes three main steps.
1) First, an acquisition and memorization ofN values of y(n) is performed from the ADC; sampled at fs= fADC
with a reference phase-offsetΦ.
2) Second, the delay of the sampling clock is incremented by a constant amount∆Φafter waiting for the sampling
clock to be stabilized.
3) Third, the two previous steps are repeatedΩ times, with Ω being the equivalent oversampling factor.
The system given in Fig. 4 depicts the implementation of the above-mentioned process. Specifically, the spatial resolution is
improved through a pseudo oversampling achieved by increas-ing the phase of the ADC samplincreas-ing clock usincreas-ing a constant phase-shift. This is accomplished periodically by an acquisition period equivalent to N · TADC withTADC= 1/fADC.
Regrettably, the actual drawback of this method is that the time necessary to lock the clock phase loop between two shifts can be very long and depends on the technology used, such as the DLL (Delay Locked Loops) in FPGAs.
B. Using constant frequency offset (CFO)
This approach might recall Verniers method which is widely used in digital PLL for fine delay measurement between two pulses [29], but applied to a periodic time measurement with finite subdivision. Thus, the system is constructed so that the ADC sampling period (TADC) is spaced at a constant fraction of
the fixed DAC period (TDAC). The equivalent spatial resolution
is equal to:
δl= (TDAC− TADC) mod TDAC. (11)
With Ω being the oversampling factor to be achieved, it is sufficient to increaseTADC such that
TADC= TDAC·
Ω + 1
Ω . (12)
Fig. 5 presents the implementation of the aforementioned process. In fact, the spatial resolution is here improved through an oversampling period achieved using a constant time-shift between the emission clock instant and the sampling of the N sampling points, with Ω · N · TADC being the complete
acquisition period.
The received signal is then acquired everyTADCstep so that
each sample is interleaved y(t + TADC) 7→ y(n + 1) 7→ y
′
((n + ∆)mod[N · Ω]) (13) The register structure is a simple reordering buffer with a constant interleaving scheme. The write memory address is calculated with an adder of∆ modulo N ·Ω (i.e. the remainder of their Euclidean division) and the read memory address is simply incremental.
Fig. 4. Schematic diagram of an OMTDR based cable diagnosis system using a correlator between the injected signalx(n) and the received signal y(n) to detect the location of the fault. The acquisition resolution is improved through a pseudo oversampling achieved using a constant phase-shift increasing on the sampling clock of the ADC.
Fig. 5. Schematic diagram of a cable diagnosis system using a correlator between the injected signal x(n) and the received signal y(n) to detect the location of the fault. Acquisition resolution is improved through the reconstruction of the received signal which is sampled at fADC, a slightly different clock frequency than that of the DACfDAC.
Fig. 6 represents a simplified version of the oversampling method described in this section using a constant frequency offset between DAC and ADC, where a periodic signalx(t) is sent through the CUT with four samples (A, B, C and D). The oversampling factor is hereby Ω = 4 and fADC= 4/5 · fDAC.
Notably, the presented oversampling process does not re-quire any high-performance DAC or ADC devices. As a result, less complex and lower cost systems are achieved. Further-more, no complex mechanism is necessary to resynchronize burst-acquisitions between two phase-shifts as required by the DLL explained in the previous section. On the other hand, the presence of a given fault must be guaranteed for a given amount of time in order to finalize the recomposition pro-cedure. In fact, interleaving the acquisition points produces a spreading of the signature of the fault over a longer acquisition period. Thus, the proposed approach might fail in detecting very short-duration (100 µsec) intermittent hard faults in a CUT.
Fig. 6. Representation of a simplified version of the oversampling method using a constant frequency offset between DAC and ADC. The injected signal is composed of four samples (A, B, C and D). The oversampling factorΩ = 4 andfADC= 4/5 · fDAC.
C. Analysis of the reflected signal phase (SPA)
The propagation of an electromagnetic signal through a CUT of length l has been defined in section II in the frequency domain as
Y (f ) = X(f )H(f )e−jφ(l,f ) with φ(l, f ) = 2πf l
vg
(14) In the case of a system detecting and locating faults in a CUT by reflectometry,l is twice the distance to fault. This distance can be obtained by accurately controlling the frequency f of the injected signal with an a priori knowledge of vg.
The arctangent of Y (f ) yields the phase φ(l, f ) of the reflected signal propagating over a CUT of lengthl. Since the arctangent function returns a value within[−π, π], φ(l, f ) can be equal or greater than that of a frequencyfj, even iffi< fj.
Consequently, the sought-after lengthl′
is not the same for two different signals with frequenciesfi andfj with a potentially
wrong estimation for both cases. Getting a reliable estimation of the fault location on the CUT is possible by using multi-carrier signals. The multi-multi-carrier signal spectrum X(f ) has been already defined in section II as a group of sub-carriers with different frequencies fn having the following amplitude
and phase functions:
|X(fn)| = 1 ∀ fn and ∠X(fn) = φn (15)
Accordingly, the fault’s location is relatively obtained from the difference between the phases of two adjacent sub-carriers given by: φ(l, fn+1) − φ(l, fn) = 2πfn+1 l vg − 2πfn l vg . (16) The fault’s estimated locationl′
can thus be retrieved as: l′ = vg 2π φ(l, fn+1) − φ(l, fn) fn+1− fn = vg 2π ∆φ ∆f (17) It is noteworthy that choosing the right frequency spacing between sub-carriers ∆f is fundamental to avoid getting a
phase difference ∆φ > 2π. Accordingly, the maximum value
of∆f can be obtained by fixing a maximum fault location:
∆φ= 2π∆f lmax vg < 2π =⇒ ∆f < vg lmax (18) The system model describing the elements performing fault detection from multi-carrier phase analysis is presented in Fig. 7. As for OFDM, the time-domain multi-carrier signal is generated by a multi-carrier generator which sets the am-plitude and phase of every single sub-carrier. An IFFT block then transforms the multi-carrier spectrum from the frequency domain into the time domain. Markedly, the DAC, ADC and the CUT are connected to each other.
In our case, the novel system is simplified by using a single FFT block rather than a complex correlator containing an FFT/IFFT block. The new FFT block feeds a phase computing block, relying on standard computing methods for trigonomet-ric functions such as that described in [30]. Note that integer arithmetic (fixed point) operation is precise enough in the area of fault detection and diagnosis. The maximal value of ∆f,
defined in eq. (18), can be set by choosing the right number of sub-carriers, N, and the DAC sampling frequency fs.
Fig. 7. Schematic diagram of the novel cable diagnosis system using a single FFT block to analyze the phase of the reflected reflectometry signal and locate a fault using the variation of the phase versus the variation of the frequency.
Locating a fault using the system presented in Fig. 7 is accomplished in three steps [31]. The first step begins by injecting the multi-carrier signal when the cable is still not connected to the reflectometry device (open-circuited). Connecting and disconnecting the cable can be autonomously done by implementing a switch. The phase φ0(l, fn) of the
sub-carrier of frequencyfn with no cable coupled is defined
as: φ0(l, fn) = φn+ φ(lDAC+ lADC, fn) (19) = φn+ 2πfn lDAC+ lADC vg (20) where φn is the initial phase of the sub-carrier of frequency
fn as given by eq. (3), lDAC is the path length between the
DAC and the coupler, while lADC is the path length between
the coupler and the ADC. Each value φ0(l, fn) is stored as a
reference measurement in the register in front of the subtracter. In the second step, the CUT is bounded to the coupler. The phase of the sub-carrier with frequencyfn for a cable with a
fault at a distance ld can be expressed as:
φd(l, fn) = φn+ φ(lDAC+ lADC, fn) + φ(2ld, fn) = φn+ 2πfn lDAC+ lADC vg + 2πfn 2ld vg (21) The last step consists in subtracting from φd(l, fn) the
phases stored in the registering block in front of the subtracter: φ′
d(l, fn) = φ0(l, fn) − φd(l, fn) = 2πfn
2ld
vg
(22) It is noteworthy that the part of the phase induced by the dis-tanceslDACandlADChas been avoided by applying a baselining
approach where the a reference measure is subtracted from the CUT measure [15]. Accordingly, the only unknown parameter isld which can be estimated from eq. (17) by considering two
adjacent frequencies. Furthermore, taking several adjacent sub-carriers permits a linear regression which yields a more precise estimate of the fault location. As a result, the phase value must be a continuous function, not bounded within [−π, π]. Such a
function is obtained by cumulating the phase values of previous frequencies. Thus, the phase value for a given frequencyfn+M
and a given fault location l is as follows: φ′ c(l, fn+M) = M X i=0 φ′ d(l, fn+i) (23)
It is important to point that the presented method has shown several advantages in an embedded system scenario when compared to standard OMTR methods based on OFDM signals. As a matter of fact, it is capable of cutting some frequency bands without any degradation in the diagnosis of the CUT. The autocorrelation function of an OFDM signal is strongly degraded when one or several carriers are attenuated, and so is the sensitivity and the precision of the OMTDR. This is not an issue for the phase analysis since the user chooses the first and last frequencies used to estimate the fault location.
The proposed method is expected to perform well in terms of resolution and fault location accuracy for point to point cables (easy known network configuration) whereas an increased complexity of the network (branches, junction, etc.) can alter the method’s proper application. This is true as any ambiguity in the prior knowledge of the NUTs topology can lead to a total corruption of the phase function which can no longer be precisely calculated. Meanwhile, new methods integrat-ing optimization algorithms with reflectometry methods have succeeded in unveiling the topology of any unknown wiring network [32]–[35]. Particularly, this can be a potential starting point towards testing complex networks with the proposed phase analysis method.
IV. RESULTS AND ANALYSIS
The performance of the SOMTDR reflectometry system recalled in section II and the aforementioned three proposed resolution enhancing methods are firstly evaluated by numer-ical simulations and then by experimental validation. More importantly, the last part of this section will present a per-formance analysis between all methods in terms of location accuracy and processing time.
A. Simulation results
In literature, the methods used to simulate and study the transmission line behavior are different. Most of them are ob-tained from the time dependent telegraphers equations modeled by RLCG circuit parameters for an infinitesimal length of the line. Notably, these equations describe the evolution of voltage and current as functions of the per unit length parameters demonstrated by the quantitiesR (resistance), L (inductance), C (capacitance) and G (conductance).
In our work, we opted to use the finite difference time domain (FDTD) method in an in-house solver developed under Matlab in order to solve telegraphers equations and model the signal propagation in a transmission line. Accordingly, the transfer functionh(t) of the CUT is simply obtained by inte-grating the cable’s RLCG parameters in the developed model. These parameters may be theoretically calculated according to the physical and electrical proprieties of the transmission
line such as conductor diameter, material, stranding, etc [36], [37]. Otherwise, they may be estimated based on the channel response measurement accomplished by using a vector network analyzer (VNA) as we did in our case study [38], [39]. The coupler’s transfer function has been determined from spice simulation.
A mixed domain model (analog and digital) has been also developed in order to quantify the performance in terms of spatial resolution of the proposed techniques. The analog domain is simulated from floating point reflectometry signals which are combined to the coupler and the CUT transfer functions. On the other hand, 10 bits fixed-point signals are used to model the digital domain, i.e. before the DAC and after the ADC. The reflectometry testing signal is an OMTDR signal composed from N = 128 sub-carriers. The oversampling factor considered for the IPS and CFO techniques described in section III-A and III-B is Ω = 16.
To better illustrate the potential efficiency of the proposed methods, two different cable configurations have been consid-ered. The first CUT model is a standard coaxial EN WZFRF15 cable with a propagation speed vg = 1.85 · 108 m/s while the other is a twisted pair MLB-24 cable used for general purpose aeronautical applications with vg = 1.44 · 108 m/s. Open-circuited hard faults were created at different distances from the coupling point with a 0.5 cm incremental distance step for both configurations.
The simulation results of the first cable are presented in Fig. 8 while those obtained for the MLB-24 cable are plotted in Fig. 9. As predicted, eq. (10) produces a spatial resolution of δl = 46 cm and δl = 38 cm while applying the standard
OMTDR system for the first and second cable configurations respectively. Significantly, the resolution is highly enhanced with the stroboscopic sampling techniques presented by the standard IPS method in section III-A and the CFO technique detailed in sec. III-B, with δl considerably decreasing to a
significant 3 cm and 2.4 cm respectively. More importantly, a notable accuracy is observed with the phase analysis based SPA technique of sec. III-C. Remarkably, an estimation error (lower than 1 cm) is obtained primarily due to the fixed-point operations done in the FFT and arctangent blocks.
B. Experimental validation
In order to check the feasibility of the proposed techniques for practical implementation, the reflectometry systems pre-sented in Figs. 1, 4, 5 and 7 have been implemented in a specific architecture on a Field-Programmable Gate Array (FPGA) board driving a 10-bit DAC and a 10-bit ADC. Both converters are tightly coupled and connected to the same type coaxial cable considered in the numerical validation of the previous section. In fact, this architecture has been developed and designed to inject/receive OMTDR signals. The OMTDR-based reflectometry method is integrated in the FPGA chip developed at our lab as an electronic board under the name of “ArianneV2” presented in Fig.10. The injection/acquisition procedure to collect the OMTDR response is accomplished by a software developed in Python. This program performs the OMTDR-based communication via a Computer Unit (CU) by
Fig. 8. Computational simulation comparison between the estimated and actual fault location for a standard coaxial EN WZFRF15 CUT after applying the SOMTDR correlation-based reflectometry and the IPS, CFO and SPA techniques.†Zoom around 29m.
Fig. 9. Computational simulation comparison between the estimated and ac-tual fault location for a twisted pair MLB-24 CUT after applying the SOMTDR correlation-based reflectometry and the IPS, CFO and SPA techniques.†Zoom around 29m.
either a wired or a wireless link. The whole experimental setup is demonstrated in the implementation of Fig. 10 where a wired connection was used between ”ArianneV2” board and a stan-dard state-of-the art computer. The DAC and ADC sampling frequency is set at fs= 188.8 MHz. For the implementation
of the method based on sampling frequency offset (section III-B), the ADC sampling frequency is fs = 177.7 MHz,
which produces an oversampling ofΩ = 16. The multi-carrier signal is an OFDM signal composed ofN = 128 sub-carriers. As specified by the OMTDR method, these sub-carriers are equally distributed in the interval from 0 to 188.8 MHz. The frequency spacing between the sub-carriers is around 1.475 MHz, which permits testing a cable ranging up to lmax= 125.3 m with a propagation speed vg= 1.85 · 108m/s.
Fig. 10. The ”ArianneV2” electronic board used for generating, injecting, receiving and processing the OMTDR signals into a CUT.
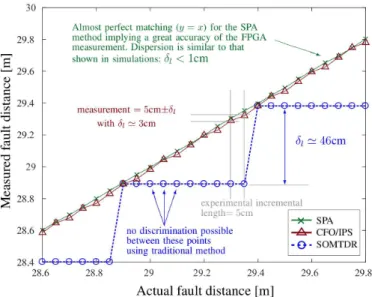
Fig. 11. Measurement of the fault location on an ArianneV2 platform versus the actual fault distance for a system applying the SOMTDR correlation-based reflectometry and the IPS, CFO and SPA techniques.
also used in the experimental post-processing validation. Several acquisitions have been accomplished for different open-circuit fault locations along the CUT. The obtained results of the measurements are illustrated in Fig. 11 where each point represents an acquisition on the FPGA system. As seen on Fig. 11, the resolution of the estimation obtained by the standard OMTDR-based technique, i.e., the red line, is δl= 46 cm. Significantly, the resolution described in eq. (10)
is now greatly improved with the novel techniques proposed in section III. The dark red (triangle) line represents the standard IPS and novel CFO stroboscopic sampling techniques of sections III-A & III-B. Both techniques show an almost aligned similar spatial resolution of δl ≃ 3 cm, which is
consistent and agrees with the previous simulation results. On the other hand, a significant spatial resolution is obtained with the SPA technique of section III-C. As noted on Fig. 11, there is no actual discontinuity between two adjacent points using this novel method. The granularity reveals the repetition steps during our test-bench, where the faults have been produced
with a spacing of 5 cm. The maximum measured error at each point was δl < 1 cm. More importantly, the actual
spatial resolution of our new SPA method is finally a function of the digital quantification of the DAC and the ADC, the fixed point FFT and arctangent computing, in addition to the experimentally coupled noise.
C. Performance Analysis
In order to better quantify and understand the obtained results, a brief summary of the performance of each OMTDR-based reflectometry method investigated in this work is pre-sented in Table I. Showing the lower average and maximal errors, the SPA technique is shown to be the best in terms of resolution and fault location accuracy. Notably, the technique has also proven to be faster in terms of acquisition time. On the other hand, the acquisition time of the CFO technique is more than 3 times faster than that of the standard IPS stro-boscopic sampling method. For both techniques, the maximal and average measurement error is almost similar.
From another aspect, the SPA technique has shown to have degraded performance once complex branched networks are addressed. Thus, it couldn’t be adapted for the diagnosis over complex cable topologies. In fact, this may be returned to the unstable phase pattern obtained in branched NUTs. Under this condition, the CFO method seems to be the most reliable in terms of accuracy and diagnoses latency.
TABLE I. PERFORMANCES COMPARISON FOR THE PRESENTED FAULT LOCATION METHODS
Method Max. error[cm] error [cm]Average Acquisitiontime [ns] TopologiesComplex SOMTDR 45.7 24.9 640 ✓ IPS 3.2 1.7 39300 ✓ CFO 3 1.5 11520 ✓ SPA <1 <1 640 ✗
V. CONCLUSION
This paper investigated the potential of multi-carrier re-flectometry, particularly the one based on OFDM signals (OMTDR), in precisely locating hard faults while resulting in a high spatial resolution. It has been shown that the performance of standard OMTDR based methods are greatly confronted by the physical limits attached to state-of-the-art converters. In fact, improving the spatial resolution while preserving highly accurate fault positions in short acquisition and processing periods necessitate outperforming ADCs and DACs. Accord-ingly, an increased complexity of hardware implementation and highly expensive elements are required.
To cope with these problems, we have recalled a standard method and proposed a novel one both based on the strobo-scopic sampling technique: the IPS and the CFO respectively. Markedly, they have proven to be efficient in enhancing the spatial resolution and returning accurate estimates of fault’s locations. Notably, they have also shown a significant over-sampling emulation while using standard traditional ADCs and DACs. Simulation and experimental results demonstrated
a remarkable ability of precisely locating hard faults with a maximum error at least 10 times lower than that afforded by standard OMTDR methods.
More importantly, we have also proposed a novel SPA method based on the analysis of the phase evolution of multi-carrier signals which is founded on the fact that the characteristics of a fault in a cable are specified in its phase information. Significantly, the obtained results have shown an implementation capacity using state-of-the-art material, which allows its integration into low cost and embedded hardware systems. Its surprising ability to locate faults in a maximum error of less that 1 cm is a milestone in the domain of fault detection and location techniques. Besides, the short acquisition time needed, less than 640 ns, makes its perfectly compatible for testing cables suffering from very short duration intermittent faults. On the other hand, its inconsistency with branched cable networks forms an interesting topic to be investigated in future work. More importantly, future work will need to deal with the performance and the robustness of the proposed methods in noisy environments.
REFERENCES
[1] M. Kafal, J. Benoit, A. Cozza, and L. Pichon, “A statistical study of dort method for locating soft faults in complex wire networks,” IEEE Transactions on Magnetics, vol. 54, no. 3, pp. 1–4, 2018.
[2] A. Orlandi, F. Rachidi, and M. Paolone, “Extension of the Unmatched-Media Time Reversal Method to Locate Soft Faults in Transmission Lines,” IEEE Transactions on Electromagnetic Compatibility, 2018. [3] M. Kafal, J. Benoit, A. Cozza, and L. Pichon, “Soft fault diagnosis
in wire networks using time reversal concept and subspace methods,” Proc. EEETEM, 2017.
[4] A. Orlandi, “Electromagnetic Time Reversal Approach to Locate Multi-ple Soft Faults,” IEEE Transactions on Electromagnetic Compatibility, vol. 60, no. 4, pp. 1010–1013, 2018.
[5] M. Kafal, A. Cozza, and L. Pichon, “An enhanced dort approach for locating multiple soft-faults in complex wire networks,” in Radio Science Conference (URSI AT-RASC), 2015 1st URSI Atlantic. IEEE, 2015, pp. 1–1.
[6] L. El Sahmarany, L. Berry, N. Ravot, F. Auzanneau, and P. Bonnet, “Time reversal for soft faults diagnosis in wire networks,” Progress In Electromagnetics Research, vol. 31, pp. 45–58, 2013.
[7] Q. Zhang, M. Sorine, and M. Admane, “Inverse scattering for soft fault diagnosis in electric transmission lines,” IEEE transactions on antennas and propagation, 59(1), pp. 141–148.
[8] Q. Shi, and O. Kanoun, “Wire fault location in coaxial cables by impedance spectroscopy,” IEEE Sensors Journal, vol. 13, no. 11, pp. 4465–4473, 2013.
[9] N. Berrabah, Q. Zhang, M. Franchet, and D. Vautrin, “Estimation of a cable resistance profile with readaptation of mismatched measurement instrument.” In Electromagnetics in Advanced Applications (ICEAA), 2017 International Conference on (pp. 1276–1279).
[10] P. Smith, C. Furse, and J. Gunther, “Analysis of Spread Spectrum Time Domain Reflectometry for Wire Fault Location,” in Sensors Journal, IEEE, vol. 5, no. 6, pp. 1469–1478, 2005.
[11] L. A. Griffiths, R. Parakh, C. Furse, and B. Baker, “The invisible fray: A critical analysis of the use of reflectometry for fray location,” Sensors Journal, IEEE, vol. 6, no. 3, pp. 697–706, 2006.
[12] C. Furse, P. Smith, M. Safavi, and C. Lo, “Feasibility of spread spectrum sensors for location of arcs on live wires,” Sensors Journal, IEEE, vol. 5, no. 6, pp. 1445–1450, 2005.
[13] P. Tsai, C. Lo, Y.C. Chung, C. Furse, “Mixed-signal reflectometer for location of faults on aging wiring,” Sensors Journal, IEEE, vol. 5, no. 6, pp. 1479–1482, 2005.
[14] A. Cozza, and L. Pichon, “Echo response of faults in transmission lines: Models and limitations to fault detection,” IEEE Transactions on Microwave Theory and Techniques, vol. 64, no. 12, pp. 4155-4164, 2016.
[15] M. Kafal and J. Benoit, “Baselining: A critical approach used for soft fault detection in wire networks,” EEETEM, 2017.
[16] F. Auzanneau, “Wire troubleshooting and diagnosis: Review and per-spectives,” Progress In Electromagnetics Research B, vol. 49, pp. 253– 279, 2013.
[17] T.-W. Pan, C.-W. Hsue, and J.-F. Huang, “Time-Domain Reflectometry using Arbitrary Incident Waveforms,” IEEE Trans. Microw. Theory Tech., vol. 50, no. 11, pp. 2558—2563, 2002.
[18] A. Lelong, M. Olivas, “Online Wire Diagnosis using Multi-Carrier Time Domain Reflectometry for Fault Location”, in Proc. IEEE Sensors Conference, pp. 751–754, 2009.
[19] S. Naik, C. Furse, and B. Farhang-Boroujeny, “Multicarrier Reflectom-etry,” Sensors Journal, IEEE, vol. 6, no. 3, pp. 812–818, 2006. [20] W. Ben Hassen, F. Auzanneau, L. Incarbone, F. Peres, and A.
Tchangani, “OMTDR using BER Estimation for Ambiguities Cancel-lation in Ramified Networks Diagnosis,” in Proc. IEEE 8th Int. Conf. Intell. Sensors, Sensor Netw. Inf. Process., pp. 414–419, 2013. [21] W. B. Hassen, N. Ravot, A. Dupret, A. Zanchetta, F. Morel, L. Pillon,
N. Imbert, N. Boisrivent, and C. Chuc, “Omtdr-based embedded cable diagnosis for mutliple fire zones detection and location in aircraft engines,” in SENSORS, 2017 IEEE, pp. 1–3, 2017.
[22] F. Auzanneau, N. Ravot, and L. Incarbone, “Chaos Time Domain Reflectometry for Online Defect Detection in Noisy Wired Networks,” Sensors Journal, IEEE, vol. 16, no. 22, pp. 8027–8034, 2016. [23] F. Auzanneau, C. Layer, “Microsecond intermittent fault detection for
wire and connector defect prognostics”, Sensors, IEEE, 2017. [24] C. Layer, E. Cabanillas, and J. Benoit, “Using Quadrature Modulation
for Precise Fault Location over Wired Communication Channels,” in Proc. IEEE International Conference on New Circuits and Systems (NEWCAS), 2017.
[25] E. Cabanillas, and C. Layer, “Automated Phase-Offset Correction using Reflectometry in Fault Detection Systems”, IEEE International Midwest Symposium on Circuits and Systems(MWSCAS), pp. 1414–1417, 2017. [26] J. Guilhemsang, F. Auzanneau, and Y. Bonhomme, “Method for improving fault detection and positioning precision using reflectometry in a wired electrical network,” U.S. Patent No. 8,620,605. Washington, DC: U.S. Patent and Trademark Office, 2013.
[27] P. T. Hulina,“Method for improving fault detection and positioning precision using reflectometry in a wired electrical network,” U.S. Patent No. 5,521,512. Washington, DC: U.S. Patent and Trademark Office, 1996.
[28] B. Hermann, “Apparatus for determining disturbances along electrical lines utilizing the impulse reflection method including adjustable equal-izing means and stroboscopic sampling,” U.S. Patent No. 3,244,975. 5 Apr. 1966.
[29] P. Dudek, S. Szczepanski and J. V. Hatfield, ”A high-resolution CMOS time-to-digital converter utilizing a Vernier delay line,” in IEEE Journal of Solid-State Circuits, vol. 35, no. 2, pp. 240-247, Feb. 2000. [30] R. Andraka, “A Survey of CORDIC Algorithms for FPGA based
Computers”, in Proc. ACM/SIGDA 6th International Symposium on Field Programmable Gate Arrays, pp. 191–200, 1998.
[31] E. Cabanillas, C. Layer, and M. Kafal, “On the phase analysis of multi-carrier signals for high-precision fault detection by reflectometry”, in Proc. IEEE Sensors Conference, 2017.
[32] M. Smail, H. Bouchekara, L. Pichon, H. Boudjefdjouf, and R. Mehasni, “Diagnosis of wiring networks using particle swarm optimization and genetic algorithms,” Computers & Electrical Engineering, vol. 40, no. 7, pp. 2236–2245, 2014.
[33] M. Kafal, J. Benoit, G. Beck, and A. Dupret, “Constructing the topology of complex wire networks using reflectometry response and newton-based optimization algorithms,” in IEEE AUTOTESTCON, pp. 1–6, 2017.
[34] M. Kafal, J. Benoit, and C. Layer, “A joint reflectometry-optimization algorithm for mapping the topology of an unknown wire network,” in IEEE SENSORS, pp. 1–3, 2017.
[35] M. Kafal, J. Benoit, and E. Cabanillas, “Blind diagnosis of a black-boxed fully-loaded wiring network for configuration structuring and fault monitoring,” in Instrumentation and Measurement Technology Conference (I2MTC), 2018 IEEE International. IEEE, 2018, pp. 1–6. [36] Q. Shi, U. Tr¨oltzsch, and O. Kanoun, “Analysis of the parameters of a lossy coaxial cable for cable fault location,” in Systems, Signals and Devices (SSD), 2011 8th International Multi-Conference on. IEEE, 2011, pp. 1–6.
[37] T. K. Truong, “Twisted-pair transmission-line distributed parameters,” EDN Mag., 2000.
[38] J. Cohen and N. Gregis, “Method of determining lineal parameters of a transmission line,” Patent US20 170 269 137A1, 2014.
[39] X. Jiao and Y. Liao, “A linear estimator for transmission line parameters based on distributed parameter line model,” in Power and Energy Conference at Illinois (PECI), 2017 IEEE. IEEE, 2017, pp. 1–8.