HAL Id: halshs-01551097
https://halshs.archives-ouvertes.fr/halshs-01551097
Submitted on 30 Jun 2017
HAL is a multi-disciplinary open access archive for the deposit and dissemination of sci-entific research documents, whether they are pub-lished or not. The documents may come from teaching and research institutions in France or abroad, or from public or private research centers.
L’archive ouverte pluridisciplinaire HAL, est destinée au dépôt et à la diffusion de documents scientifiques de niveau recherche, publiés ou non, émanant des établissements d’enseignement et de recherche français ou étrangers, des laboratoires publics ou privés.
Electricity supply reliability and households decision to
connect to the grid
Arnaud Millien
To cite this version:
Arnaud Millien. Electricity supply reliability and households decision to connect to the grid. 2017. �halshs-01551097�
Documents de Travail du
Centre d’Economie de la Sorbonne
Electricity supply reliability and households decision to connect to the grid
Arnaud MILLIEN
Electricity supply reliability and households decision to
connect to the grid
Arnaud Millien
10 mai 2017
Abstract
The 7th Sustainable Development Goal aims to "ensure access to affordable, reliable,
sustai-nable and modern energy for all". Because the cost to increase electrical capacity in Africa alone
has been estimated at $800bn, this article investigates the extent to which electricity reliability could contribute to a reduction in the marginal cost of grid extension by attracting more custo-mers. Using lightning as an instrument for outages severity, the article evaluates the assumption that less uncertainty about electricity availability would lead to a larger number of connected households.
The article finds that a one percentage point increase in electricity reliability would yield a 0.67 percentage point increase in connections. Therefore, delivering fully reliable electrical power would allow an electricity company to achieve its targeted growth of customer base 15 months earlier than planned.
The effect of reliability is highest for middle-rich households, which are the most reluctant to subscribe in the presence of total, severe or partial outages. A one-percentage-point upgrade in reliability increase the likelihood that these households will be connected by 1.28 percentage points.
This article also finds that households are more sensitive to outages in areas where outages are less frequent. In addition, the impact of reliability on households decision to connect could be at least 5% greater than the effect of poverty ; if the frequency of outages is too high, the wealth or poverty effect might vanish and households would respond only to the excessively low reliability. These results confirm the uncertainty assumption, that is, regular and severe outages yield an uninsurable context that deters households from subscribing to the electric service.
Keywords : electrification, reliability, outages, Kenya, instrumental variable
JEL : Q4, QO1, O18, O55, C26, C52
Aknowledgments
The author thanks Jean-Claude Berthelemy for his compelling improvements and on-going discussions ; Rémi Bazilier, Mathilde Maurel, Mouez Fodha, Fatou Cisse and Max Brüning for their relevant insights and comments ; Sandra Poncet and the teaching team of Maison des Sciences Economiques for their professional research advice ; Afrobarometer for providing the data ; Victor Béguerie for his guidance on the poverty index ; Olivier Santoni for supplementing the geographical data ; Chris Davis for providing support in the use of Enipedia ; and Justice Mensah for his support
and openness to innovation. Any errors that remain are those of the author.
Introduction
Achieving the 7th Sustainable Development Goal will be expensive : the cost to increase elec-tricity supply in Africa could amount to $800bn. Moreover, severe and regular shortages might deter households from buying a subscription to the electricity provider, which in turn will increase the marginal cost of grid extension. Consequently investor risk might increase, which could jeo-pardize future investment in new infrastructures. The low-quality context of supplied electricity could thus increase the global cost of electrification far higher than the cost of building new plants and lines.
Electricity quality can impact the cost of grid extension in several ways. First, the expected benefits of electrification would vanish if low-quality service yielded only a small increase in connections. In addition, reliability itself appears to be a condition for sustainable development of the electrical grid ; as shown by [Lee et al., 2014] in Kenya, a lack of connections lead to a tenfold increase in the marginal cost of installing new transformers. Regular outages could thus dramatically reduce investors’ expected returns, making them reluctant to fund any new electricity project, whereas sub-Saharan countries’ financial resources and access to external funding are scarce. A reduced ability to renew infrastructures and capacity might then cause those countries to enter a vicious cycle : aging infrastructure increases the frequency of outages, which inhibits subscriptions to the electric service, and thereby reduces the resources available to fund their replacement.
Evaluating the external benefits of reliability is crucial, because regular severe outages create uncertainty, which may change households consumption or firms production choices, leading to costly long-run inefficiencies. Addressing this question is urgent because the economic cost of outages increases exponentially with their duration and severity [Kaseke, 2011].
In this context, policy makers and investors must determine how to extend electrification in a sustainable manner by providing service quality. They cannot focus solely on the expected net present value of projects, which long-run achievement could be itself affected if a lack of reliability would let gain a fewer-than-expected number of customers. Achieving this objective lead to a trade-off between extensive and intensive investments, the first of which fund the building of new utilities and lines and the second support improvements to reliability. This article proposes to identify the customer segment that should be targeted first by an electric company, in order to maximize the return to quality.
[Andersen and Dalgaard, 2013] have been the first to demonstrate the detrimental impact of electrical outages on growth in sub-Saharan Africa, finding that an increase of 2.3 outages per month reduces annual growth by 1.5 points. Their contribution is all the more important because it relies on an external instrument [Deaton, 2010] to solve the main identification issue faced by the literature on electrification, namely, the endogenous placement of the grid [Lipscomb et al., 2012], [Van de Walle et al., 2013]. Lightning is not only external to grid extension or management but also strongly correlated with outages, although it remains exogenous to the outcome. Hence, lightning captures the causal impact of outages on growth.
methodology of [Andersen and Dalgaard, 2013] to evaluate the impact of reliability on the likeli-hood that households are connected to the electrical grid. Relying on the consistency of the same instrumentation, the article checks the prediction of the macro-level model with a finer level of observations. Using micro-level data is relevant because [Chakravorty et al., 2014] showed that the macro result can be verified by focusing on the households’ revenue channel. In addition, the micro-level approach eliminates certain possible confounding factors that must be accounted for at the macro level, such whether the country is resource rich or located on the coast.
Another contribution of this article is that it focuses on one of the channels through which electrical shortages could impact annual growth, i.e., changes in households behavior due to the uncertainty context. Given that most -if not all- of the literature is based on an underlying assumption of exogenous and homogeneous quality of electricity supply, disentangling this channel will permit an assessment of whether reliability is a condition for the sustainable development of electricity.
I also extend the referral specification. Because [Lee et al., 2014] found that the wealth ef-fect outweighs the impact of distance to transformers, I introduce a poverty index as a control. Additionally, I exploit a peculiarity of Kenya -namely, that 75% of the generation capacity is constrained by natural geographical features (i.e., rivers, volcanos and coastal access)- by ex-tending the set of instruments to include distance to the closest generator, as suggested by [Van de Walle et al., 2013].
Finally, this article incorporates the notion of “under-grid” households, extending the work of [Lee et al., 2014] at the smallest granularity level : whereas they worked with compound data on households, I exploit the Afrobarometer survey that collects individual information on all household members.
Section I outlines the questions addressed by the literature, and Section II describes the elec-tricity context in Kenya. Section III presents the data, and Section IV explains the identification strategy. Empirical results and robustness checks are provided in sections V and VI. Section VII concludes with a "what-if" scenario.
1
Literature review : known issues and opened questions
1.1
Evaluation of the technical-economic costs of electricity
One strand of the literature evaluates the technical-economic costs of electricity production, considering either its output (cost of kWh) or its disruption (cost of outages). The levelized cost of electricity (LCOE) assesses ex ante the economic feasibility of projects, whereas the value of lost load (VoLL) and contingent valuation methods (CVM) evaluate the reliability’s benefit, by measuring how much has been or could be lost due to outages.
The LCOE expresses the lifetime unit cost of kWh based on expected investment and future running expenses. Because electricity projects usually require large capital expenses (“capex”), it is crucial for investors to get an exante synthetic measurement, in which lower operational expenses (“opex”) might ease the recovery delay. This approach involves the producer of electricity in cost structure management before the project is brought to market because, unlike a net present value, the LCOE only takes into account the expected expenses, both upfront and long-term. [Nordman, 2014] uses an LCOE measurement to conduct a cost/benefit analysis of wind power station deployment in the tea sector in Kenya. Comparing distributed generation utilities with grid extension in India, [Harish et al., 2014] couple the LCOE with the loss of consumer surplus and find that the break-even point for an off-grid solution is at least 17 km from the grid, or even 6 km if fuel and oil subsidies in the grid are discounted.
However, the LCOE only provides a technical-economic measurement of the main expected output (i.e., the cost of kWh) based on the project’s design and management. In addition, it focuses on internal parameters that are ex ante valuated, and thus does not allow an assessment
of the external benefits after the project has been implemented, thereby precluding any feedback that could sustain investors long-run knowledge and interests. Notably, the LCOE does explain why or how the occurrence of outages could modify firms’ or households’ economic behavior.
The cost of reliability is defined by the VoLL as the average cost of unsupplied electricity in monetary unit per electricity unit (kWh) [Praktiknjo et al., 2011]. Outages are evaluated as the economic loss of surplus that they trigger, not as damages to devices or the production deficit. The VoLL has been estimated with Monte Carlo simulations in advanced countries such as Austria [Reichl et al., 2013] ; in German households [Praktiknjo et al., 2011] ; and after the explosion of a power station in Cyprus [Zachariadis and Poullikkas, 2012].
The VoLL appears to be better suited for advanced countries because its starting point relies on an assumption of full reliability : within a perfect electricity market, the cost of outages is seen as a divergence from the equilibrium. In contrast, in developing countries, the reliability context may be affected by a number of upstream factors, such as a low investment attractiveness ; limited access to funding which limits the ability for maintenance and replacement ; a poor governance of electricity i.e. insufficient regulation and management of balancing ; the poverty constraint on existing grids, which can trigger theft, pilfering and vandalism of lines or meters [Shah, 2009], thereby exacerbating the inefficiency of transport due to on-line losses [Khandker et al., 2014], [Berthélemy, 2016].
The VoLL also fails to take into account how a context of persistent outages might transform consumers’ preferences into constrained choices because it assumes that the demand for electricity is exogenous and inelastic, whereas context can actually modify per se the demand curve for electricity.
Contingent methods have been used extensively, as noted by [Praktiknjo et al., 2011] in their meta-analysis of 16 studies. Contingent methods rely primarily on the firm’s cost management fra-mework, integrating the direct and indirect costs triggered by outages in an attempt to obtain the complete cost of an electricity shortage [Pasha et al., 1989]. [Diboma and Tamo Tatietse, 2013] have classified these methods into three segments. The CVM relies on a survey that assesses consumers’ willingness-to-pay (WTP) to avoid outages, and their willingness-to-accept (WTA) outages. This method has been used by [Kjolle et al., 2008] to evaluate the cost of outages in Norway. With the contingent ranking method (CRM), consumers are asked to rank outage scenarios. The CRM has been used by [Willis and Garrod, 1997] for a study in the UK. The direct worth (DW) method asks consumers to evaluate their losses given a set of predefined outages scenarios [Küfeoğlu and Lehtonen, 2015]. Using this type of survey and invoice data, [Diboma and Tamo Tatietse, 2013] have evaluated the complete cost of power interruptions for firms in Cameroon.
However, the alleged impact relies on households’ declarations and thus suffer from two main confounders. First, the survey’s participants self-evaluate the cost of outages and could thus yield a Hawthorne effect : they might exaggerate the reported information, as they hope any future quality enhancement resulting from the researcher’s interest. In addition, none of those cost studies uses any econometric methodology, and some of them do not even use any observational data. Therefore, they provide no evidence of the causal link between electrical reliability and development.
1.2
How the literature evaluates the impact of outages on firms’
in-vestment decision
A second well-developed strand of the literature evaluates the impact of outages on firms behavior, bringing a comprehensive framework of the agents’ response to the uncertainty context by self-producing electricity. However, these studies do not explain how a greater reliability could sustain firms production preferences for other goods and services that might support the economic development. Conversely, the level of investment or product variety might be affected by the
outages context. In addition, this framework does not apply to households.
Scientific monographs have provided clues about the damaging inefficiencies caused by constrai-ned production choices, whereby persistent outages might ultimately impair the expected bene-fits of electrification. In Kenya, [Kirubi et al., 2009] observed that handicraft workers constantly switch between manual and electrical tools due to regular outages. In India, [Smith and Urpelainen, 2016] also observed an increase in diesel irrigation pumps after the electrification of villages, despite the fact that those devices are costlier and less efficient than electrical pumps. These short-run constrained choices might lead to long-run inefficiencies ; for example, after an eightfold increase in the price of fuel, the poorest farmer in Orissa abandoned high value-added crops for low-return rain-fed farming in open fields [Shah, 2007]. Although eastern India is one of the wealthiest areas in the world in terms of groundwater resources, farmers no longer had the means to exploit it and thus, also lost centennial socio-economic know-how.
[Alby et al., 2010] established a theoretical framework that describes the conditions in which a firm would opt to invest in self-generation to cope with the uncertainty context. It relates the probability of acquiring a generator with the number of outages and adjusts the firms’ utility for the cost of self-generation.
Recent econometric works have demonstrated the impact of outages on firms decision to generate [Allcott et al., 2014] and have considered the combined impact of outages and self-generation on productivity in sub-Saharan Africa [Mensah, 2016]. Interestingly, the latter study uses the same instrument as [Allcott et al., 2014] for outages (i.e., the availability of water re-sources), as well as the parsimonious specification introduced by [Andersen and Dalgaard, 2013]. Using a difference-in-difference methodology, he finds that investment in self-generation has a positive short-run effect on firm revenue but a negative long-run effect on productivity, due to higher cost of self-produced kWh.
[Oseni and Pollitt, 2015] go further by evaluating the expected benefits of self-insurance in 8 countries in sub-Saharan Africa. Because the economic cost of outages can be enormous1, this self-insurance is not everywhere affordable. In addition, self-generation does not necessarily reduce the losses caused by electrical shortages because the featured firms might still have large operational vulnerabilities and insufficient means to cope with all other costs stemming from the lack of power. This result is important for it shows that the context of regular outages might cause damages much larger than the capacity to hedge them, which sustains the un-insurable uncertainty rather than the assumption of risk.
Consequently, the frequency of outages does not appear to be the significant determinant for investing in a self-generator ; rather, the determining factors are a firm’s means or structural constraints, including its size, electrical consumption, trade openness, product variety or the country in which it is located. [Fisher-Vanden et al., 2015] thus advocate the assumption that a firm’s expectation of outages -not the actual occurrence of outages- underpins its decision whether to outfit itself with a generator, conditional on its sectoral need and financial means to hedge this risk. Only [Arnold et al., 2006] have attempted to measure the effect of this perception held by firms, using a probit model in the annex without any instrumentation or controls.
Research on firms yields two important conclusions : first, exploring the impact of outages on agents behavior is feasible and second, the expectation of regular outages rather than their simple observation might be the true determinant of agents decision. To the best of my knowledge, this approach has not yet been extended to households. However, the motivation of households to subscribe to electricity might also be rooted in other factors, such as their consumption preferences.
1.3
Evaluating the benefits of electrification or reliability ?
With a much smaller number of works, the last strand of the literature has started to evaluate the benefits of electrification for households, considering its impact on other socio-economic
ties, such as the reallocation of time between household members, education, income and health. Certain authors, such as [Andersen and Dalgaard, 2013] and [Chakravorty et al., 2014], started to evaluate the quality effect on income at the macro and micro levels, respectively. However none of these studies assesses the potential impact of reliability on households behavior, through the creation of conditions for a lasting evolution of consumption preferences.
1.3.1 Evaluating the benefits of electrification relies on strong assumptions
A subset of authors have evaluated the impact of electrification from a global perspective. In a seminal work, [Rud, 2012] uses the Green Revolution in India as a natural experiment, employing groundwater availability as an instrument for the share of connected agricultural units. However, the causal impact of industrialization found in that study does not reveal whether firms or hou-seholds reap greater benefits from electrification. Qualitative studies also relates electrification to socio-economic transformations [Matungwa, 2014] or with electrical appliances [Martins, 2005].
A handful of works have conducted econometric evaluations of the impact of electrification on household outcomes. A referral work, [Dinkelman, 2011] finds a positive impact of electrification on women’s employment in South Africa. He uses the land gradient as an instrument, thereby solving the endogeneity of project placement. The electrification program yielded a significant 9% higher level of women’s employment in communities that had benefited from it, possibly because increased freedom from home production was converted into greater involvement in micro enterprises.
In Argentina, [Gonzalez-Eiras and Rossi, 2007] tried to assess the impact of electrification on household health based on the use of refrigerators. However, the identification framework did not permit any conclusion regarding heath benefits generated by greater access to refrigeration, thus leaving this important question unanswered.2
Other works have produced controversial results regarding women’s increased free time and children’s education. From 1992 to 2005 in Honduras, [Squires, 2015] found a significant nega-tive impact on school attendance associated with a significant increase of the same magnitude in children’s employment. Conversely, [Arráiz and Calero, 2015] found a positive effect of solar home system installation on education : children spent significantly more time on homework and achieved more years of schooling in the treated group, possibly due to a favorable impact on time reallocation between adult men and women, with the latter group spending more time per day taking care of children. Using the distance to the grid as an instrument, [Aguirre, 2014] also claims a positive impact on education in Peru.
Regarding the instruments used in these studies, although they are exogenous to the outcomes, they do not appear to be fully external to the grid’s geographical extension, which is a major source of endogeneity, as noted by [Lipscomb et al., 2012]. For instance, although groundwater availability for agricultural units met the exclusion restriction for industrialization in [Rud, 2012], it might nonetheless be a policy driver for building new electrical lines in an area settled by existing agricultural units. Furthermore, as stated by [Dinkelman, 2011], utilization of the land gradient relies on prioritization of the grid’s extension as a cost function of the altitude. Finally, distance to the grid, which was used by [Squires, 2015] and [Aguirre, 2014], is exogenous to children’s education but obviously is not external to grid extension policy, which might be prioritized based on population density.
As clarified by [Squires, 2015], using the distance to the grid as an instrument -because it might be highly correlated with access to electricity- relies on strong assumptions. The first assumption is that the grid is always extending and never shrinking, meaning that distance to the grid should be a decreasing function of time. The second assumptions is that the connection schedule is fully ordered in space, that is, sites are connected in order of their distance to the grid.
2. Their study establishes a causal relationship between the privatization of energy companies and access to electricity, and an association between privatization and refrigeration but reveals no significant link between pri-vatization and malnutrition or food poisoning.
Those assumptions are very strong, especially in developing countries, where the electrical grid might be affected by numerous other events that are external to electricity management or deve-lopment policy. For example, civil wars, vandalism, corruption of connections on the last kilometer lines or even the redistribution of the energy mix might strongly affect the spatial distribution of the grid’s resources, such as generator plants, lines, sub-stations and final transformers.
Moreover, the data used in certain studies do not allow fixing a snapshot of electrification at a precise time. For instance, [Squires, 2015] obtained data on the grid’s extension starting only in 2012, whereas the period under review begins in 1997. Nonetheless, his study helps to clarify the strong assumptions that underlies the use of distance to the grid as an instrument for electrification ; specifically, it has finally been shown to have only a small impact on household decisions whether to connect to the grid [Lee et al., 2014].
In addition, all of the above mentioned studies rely on the implicit assumption of a fully reliable extended grid, but the extension could be the origin of more outages, which reduce the attractiveness of the service and, hence the effective share of the electrified population.
1.3.2 Evaluating the impact of reliability on households behavior
None of the above mentioned studies investigates how reliability might support the socio-economic transformations expected from electrification by modifying firms’ or households’ econo-mic behaviors. Only few empirical works account for the specific benefit of reliability for econoecono-mic development.
However, [Andersen and Dalgaard, 2013] have found that outages have a significant impact on countries’ revenue. In 39 countries in sub-Saharan Africa, an increase in outages by one standard deviation reduces growth by almost one standard deviation, providing evidence that electrical reliability has large potential to increase the revenue of developing countries.
[Khandker et al., 2014] address the reliability issue, but only as a complimentary one to elec-trification since they not dedicate a specific framework to identify the role of quality. Nonetheless, they provide the first clues regarding the important impact of reliability on households decision whether to connect, and on their subsequent behavior as electricity consumers. Notably, their results suggest that an improvement of service availability can increase the rate of adoption, and show that access to electricity reduces domestic kerosene consumption ; reliability may thus transform constrained choices into preferences, with fewer resources dedicated to kerosene lamps. But then, a large increase in electricity consumption by connected households has only a small marginal effect on their kerosene-purchasing habits. The observational data also shows that under-grid households continue to purchase and consume more biomass for cooking than unconnected households, as also observed by [Arráiz and Calero, 2015].
This surprising result suggests an unobservable parameter, namely, the context of regular and serious electrical shortages that might lead connected households to continue purchasing alternate fuel for lighting.
Only [Chakravorty et al., 2014] have started to evaluate the causal impact of reliability on socio-economic outcomes. With a two-round panel in India between 1994 and 2005, they show that the quality of power strongly increases the benefit of electrification for non-agricultural household income. The marginal impact of reliability appears to be 62% higher than the one of access to the grid.
However, in both studies, the chosen instrument hardly resolves the doubt about the endoge-neity of grid extension. In [Khandker et al., 2014], it is doubtful that the individual part of the interaction between the proportion of connected households and their individual characteristics (owned land, age, sex or education) had no direct impact on the outcomes (kerosene purchases, time allocated to biofuel collection or children’s education). With respect to enough correlation with the endogenous variable, they argue that peer pressure might offer a convincing explanation why the instrument is not weak. However, peer pressure is clearly not random, and not external, neither to the decision to connect nor to the level of electricity consumption. By interacting
trans-mission line density with the initial level of electrification or quality, [Chakravorty et al., 2014] also allow a central component of the grid to enter into the instrument. Although there is little doubt that investments in transmission lines might not be directly associated with households in-come, electrical lines are not an external variable to electrification or to power quality, especially given that the world’s highest level of on-line losses occur in India [Khandker et al., 2014].
As recently noticed by [Van de Walle et al., 2013], finding a good instrument for grid exten-sion remains a challenge for empirical evaluations in the field of electricity economics.
By utilizing transmission lines density, [Chakravorty et al., 2014] are establishing the power qua-lity as a given assumption for the used instrument.3 In those conditions, whether power quality might have a reverse effect on the grid’s connection level remains an open question. Interestingly, [Van de Walle et al., 2013] argue that using the distance to the primary power source would be less of a concern, because the location of primary energy spots is more likely to be independent to the location of households.
By using lightning, [Andersen and Dalgaard, 2013] introduce an innovative instrument for ou-tages that meets all three required properties for valid instrumentation : it is purely random, strongly correlated with the occurrence of outages, and obviously not a direct factor in countries’ revenue variations.
1.4
The existing frameworks do not address the uncertainty context
of repeated outages
None of the above-discussed studies considers the long-run uncertainty context, which could lead researchers to under estimate the costs of shortages, whereas repeated outages also alter household and firm preferences, turning the latter into constrained choices.
The existing framework in electricity economics provides an incomplete analysis of the costs of uncertainty. LCOE and VoLL remain limited to endogenous measurable parameters ; they do not propose any integration of external risk factors that might impact the economic cost of kWh on a broader basis, such as pilfering or on-line losses [Berthélemy, 2016]. The latter remain un-priced externalities that continue to be paid by the collectivity by causing an over-estimation of the peak-load, which in turn could lead to over-invest in additional capacity. Rental behavior around electricity distribution not only divert a portion of the common good but also exacerbates the risk of outages in particular locations, thereby worsening the impact of uncertainty as an unaccounted negative externality.
This framework also fails to explain why reliability might generate lasting changes in hou-seholds’ way of life. Because it is not insurable, uncertainty might change the agents’ long-run decisions, such as the equipment rate of electrical devices in households, or the product mix of firms. The question of how reliability might produce long-term reallocation of the agents’ prefe-rences, by smoothing their cost function and enabling them to enter into a broader scope of more complex economic applications, remains unanswered.
Furthermore, no work has evaluated the economic impact of outages on agents’ behavior while facing uncertainty. Because the VoLL relies on the consumer and producer surplus theory, it is suitable for evaluating a divergence from an initial stable equilibrium, assuming that the cost of any breach in reliability might only equal the distance from this equilibrium. But the frequency and length of outages might sustain agents’ expectations of a persistent low reliability, because from the agents’ perspective, shortages are external events. In turn, agents might avoid the service despite their need for it. Those changed expectations could durably modify the ability of the electricity market to achieve a dynamic equilibrium, because underestimated latent demand might lead to an underestimation of the peak load and capacity sizing ; consequently, any enhancement in reliability might trigger a larger-than-expected increase of demand, while supply has been kept constrained,
3. Proximity to the network should increase the likelihood of being closer to generation points and therefore receiving a better power supply
triggering worse and lasting outages.
The literature addressing the issue of self-generation opens a possible door for managing the behavioral impact of outages. As rational agents observe a context of persistent uncertainty, they expect that the best predictor of tomorrow’s reliability is the level of reliability observed in the past. Because uncertainty is not measurable through any law of probability, hedging its expected costs requires continual means to address the occurrence of shortages and hence a persistent counter-solution, such as self-generation. However, the literature has revealed that this strategy is somehow inefficient, most likely because firms might have to pay triple the permanent fixed cost for electricity consumption : once for the fee to connect to the grid, second for the capex for its generator and third for the opex to self-produce. In contrast, electricity input would be charged only once to the final consumer as a constant fee in the industrial product.
A persistent distance from equilibrium could thus change the agent’s expectations and hence the economic decision whether to connect and use electricity through a marketable contract ; underestimating latent demand could make the disequilibrium even worse for any supply enhan-cement. To the best of my knowledge, the electricity economics literature lacks a comprehensive framework for the sustainable reliability benefit that the VoLL or electrification evaluation can hardly address.
2
Electricity and lightning in Kenya
In 2014, the electricity produced from Kenya’s natural endowments accounted for 56% of its capacity (Figure 1, left), with a large share coming from geothermal origins (19.1%), which continued to grow in 2015 (26.6%). Notably, Kenya owns the largest single geothermal plant in the world in Olkaria IV (140 MW), and the geothermal industry produces the cheapest electricity in the country.
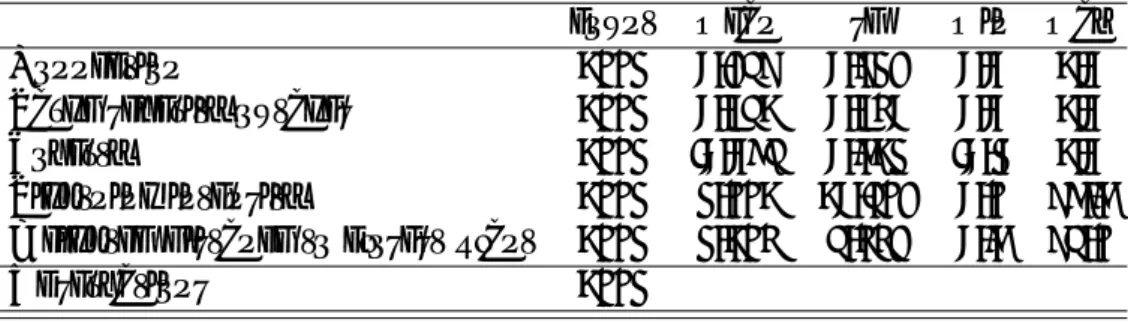
The electrical sector in Kenya is organized with a central distributor (KPLC) that operates under a PPP mandate, a public grid manager (KETRACO) and a set of producers. The produ-cers comprise KENGEN, a majority government-owned company that produces over 85% of the country’s capacity, and independent power producers (IPP) (Annex A.8). A state-owned special purpose vehicle is dedicated to the development of geothermal production (GDC). The Rural Elec-trification Authority (REA) is a state agency that addresses the issue of unconnected under-grid households in rural areas.
In Kenya vision 2030, building new capacity and extending new transmission lines (> 132 kV) and distribution lines (below 66 kV) are defined as the two main priorities, leading to two strategic projects : a quantified roadmap for building new capacity (5000+ MW in 2016), for which KPLC is responsible, and the Last Mile Connectivity project, which was launched by the REA in September 2015. The latter project aims to connect 70% of households by 2017 by extending the grid of distribution lines and transformers, targeting 314,000 households within 600 meters of 5,320 selected substations. As shown by [Lee et al., 2014], the lack of connections multiplies the marginal cost of grid extension by ten. Therefore, the project includes a special effort for the poorest households, reducing the connection fee from KSh35,000 to KSh15,000.
KPLC had 2 million customers in 2012, 2,7 million in 2014 and should have reached 4,3 million in 2016. However, the rapidly growing customer base could jeopardize reliability, because the rising peak load could trigger a national blackout (Table 9). KPLC is rationing supply with planned outages to avoid the worst-case scenario, which has generated tensions between firms and households across the entire country. The historical choice has been to prioritize reliability for firms in order to avoid deterring foreign investors from operating in Kenya.
As a result, frequent outages could have caused reluctance among households to subscribe, because they might consider the cost of service too high given its erratic availability, regardless of their specific budget constraints. Striking evidence of this reluctance is that the connection rate remains below 50% in one-half of Kenya’s counties despite the extension of the grid over most of
Figure 1 – Production’s capacity in Kenya by fuel type
Figure 2 – Coverage’s rate and connection’s rate by counties in Kenya
the country (Figure 2).
Under equatorial latitude, Kenya is among the countries with the greatest exposure to lightning storms in the world, with a keraunic number that is 9 times higher than that of France. Compared to other sub-Saharan countries, Kenya exhibits a strong heterogeneity in lightning levels, being among the highest in the world in the western mountainous provinces but comparable to Europe in the eastern regions. Intensity and heterogeneity makes this variable a good candidate to be an instrument for outages, as suggested by Figure 3.
3
Data
The data on electrical coverage, connections and outages are obtained from the Afrobarometer survey on Kenya, from round 6 of the 2014 questionnaire. The database contains 2,397 cross-sectional observations on households that are segmented by county and district. The analysis is based on the 1,989 respondent households that live in geographical units with access to electricity. Access to electricity is known based on the descriptive part of the questionnaire completed by the interviewer. A specific question yields information on the reliability of power, with five distinct levels of availability. Because it also asks whether the household owns an electrical connection, there might be some inconsistency between these answers and the information provided in the descriptive part. Specific filters have been applied to ensure consistent computation of outage indexes.
The Afrobarometer survey also provides descriptive information about the portable assets owned by each household (e.g., radio, television, mobile phone, motor vehicle), the type of water
Figure 3 – Lightning and electrical shortages by counties in Kenya
and sanitation to witch it has access, the type of shelter in which it lives in and the type of roof on this shelter.
Data on lightning are sourced from the LIS/OTD Gridded Climatology dataset, which collects the number of lightning impacts within 50km2 sections. These numbers have been averaged by districts for the period 1995-2013.
Climate controls (altitude, temperature and precipitation) are provided by the geographical database of the FERDI, as well as the distance to Mombasa, which is weighted by road quality.
The locations of the generators are provided by the Delft University from its Enipedia collabo-rative database [Davis et al., 2015], whereas the capacity data are supplemented by the author’s research, based on cross-checked media investigations, as of 2014.
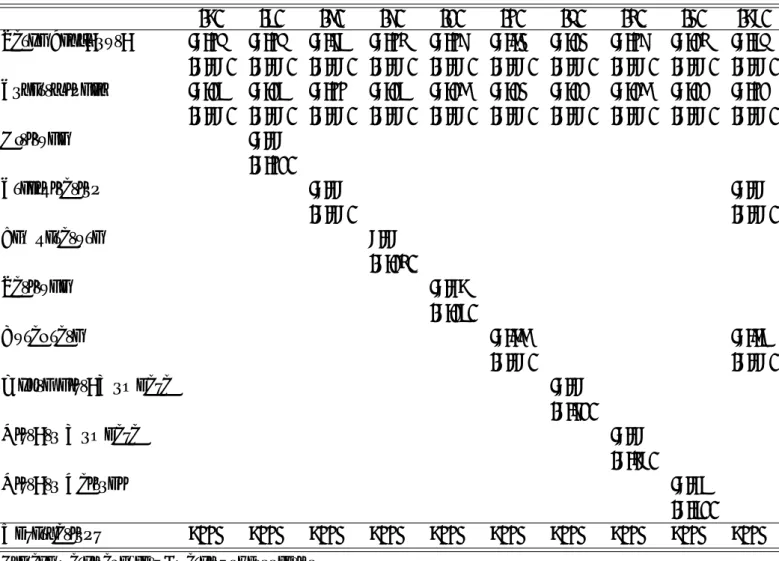
Table 1 provides a summary of the main variables included in the estimation sample.
Table 1 – Descriptives statistics for in-sample variables (IVPROBIT)
count mean sd min max
Connection 1669 0.574 0.495 0.0 1.0
Large severity outages 1669 0.271 0.280 0.0 1.0
Poverty 1669 -0.037 0.319 -0.9 1.0
Lightning intensity 1669 9.661 10.765 0.6 43.3
Weighted distance to closest plant 1669 9.168 7.885 0.3 47.6
Observations 1669
4
Identification strategy
4.1
Main specification
The identification strategy exploits outages frequency as an explicit measurement of the breach between constrained supply and peak load : the occurrence of outages signals the inability of the electrical network to allocate the resource evenly across the country, whereas their frequency highlights the long-run uncertainty context, because repeated equilibrium breaches ultimately become lasting market failures that might alter agents’ preferences.
Relying on the parsimonious specification by [Andersen and Dalgaard, 2013], which was also used by [Mensah, 2016], the equation below considers the effect of outages severity on households
connection to the electrical grid (Connection), where treatment intensity is measured by the cumulative outage rate for a given q-frequency level (CO(q)).
Connectioni = α0+ α1.COd(q) + α2.povertyi+ α3.COd(q).povertyi+ ui
where i is the household, d is the district, and q is the severity. As will be discussed more extensively below, all estimations are clustered at the district level (d).
Because electricity is distributed at the speed of light, there is an identity between service availability and delivered quality : a shortage of supply is evidence of a poor service design. The expected consequence of low-quality supply should thus be low demand, i.e., the lasting context of outages could yield a low number of connections (Connection). Due to its impact on marginal cost, the number of connections is a key variable for sustainable grid extension : it is thus worthwhile to diagnose the extend to which the uncertainty context could act as a barrier to effective electrification.
Therefore, this study aims to estimate the local average treatment effet (LATE) of outages severity (COd(q)) on the likelihood of connection to the grid, relying on a quantitative variable as
an external measurement for treatment intensity. The model can then be used to infer the causal impact of reliability on households decision whether to subscribe.
However, as shown by [Lee et al., 2014], the wealth of Kenyan households might also be a key determinant of their connection ability, much more so than their distance to the grid. Therefore, the model must introduce household wealth (poverty) as a crucial control.
Following the work of [Booysen et al., 2008] on other sub-Saharan countries, a composite index of household assets (poverty) is computed through multiple component analysis (MCA) using data on water and sanitation facilities, shelter type and roof type. Because the main objective is to focus on the causal impact of uncertainty, the use of an index provides a synthetic indicator for the main control while still taking into account the multiple dimensions of wealth. The specification thus enriches the work of [Lee et al., 2014], who utilized wall quality, while exploiting the richness of the Afrobarometer data. However, it is necessary to check that the first axis retained as the wealth index concentrates a high level of inertia, hence satisfactorily rendering the correlated dimensions of wealth.
The potential cross-effect between the uncertainty of reliability and individual wealth is cap-tured by introducing an interaction term. For instance, the richest farmers might be only slightly sensitive to the outages context because they may already possess their own generator as self-insurance against shortages. Conversely, in an area that benefits from regular power, households might adopt the electricity contract based mainly on their means. However, because only outages are instrumented, whereas poverty remains strongly endogenous to the connection level, the mo-del will be used only for informational purposes when comparing the impact of quality with the magnitude of the wealth effect.
Relying on under-grid households, as in [Lee et al., 2014], the model is performed on house-holds in districts with access to electricity. Nonetheless, because Afrobarometer lacks data on transformer location, this article defines an under-grid household as one living in a district d where at least two households are connected to the grid.
4.2
Variables definitions
4.2.1 Dependent variable
The dependent variable (Connection) is a dummy variable that is equal to 1 for a connected household living in a district with access to electricity. With cross-sectional data from the 2014 survey, the evaluation exploits the geographical heterogeneity of the connection rate, which ranges from 94% in Nairobi to 4% in Homa Bay.
4.2.2 Weighted Severity Index of reliability uncertainty based on perception data
As an opinion survey, Afrobarometer provides cross-sectional data as a direct measurement of the uncertainty context. Household statements on outages provide a direct and immediate indicator of the reliability context. I assume that the uncertainty context could have eventually contributed to changes in households perception and report, and this households’ memory is part of the actual reported outages severity.
In the first step, a reported outages intensity (roi) is computed for a given level of availability (j) as the sum of the power availability declared by the households (1 : never, 2 : occasionally, 3 : half the time, 4 : most of the time, and 5 : all the time).
roid(j) = n1d.Pni=1d 1(availability = j), nd : number of households in the district.
The reported outages intensity is qualified as follows : 1 : total , 2 : serious, 3 : partial, 4 : occasional. Due to the limited number of observations, certain districts had only one connected household. In such cases, the reported outages intensity would be 100% for the level indicated by this household and 0% for any other level. A filter has thus been set to keep only the units with at least two connected households.
In a second step, the Weighted Severity Index CO(q) is defined as the rate of cumulative outages (CO) until severity level q in a district d.
COd(q) =Pqj=1roid(j).
COd(q) is thus the cumulative function of outages until a given severity level (q). For any
district, COd(q) equals 1 when q=5.
In the severity function COd(q), a total outage (j=1) is not weighted the same as a serious (j=2)
or partial (j=3) outage, given the number of outages at each severity level (j). By construction, this function is weighted by the number of outages (Pnd
i=11(availability = j)) of each intensity
(j) in roid(j). Hence, the indicator is called a Weighted Severity Index of reliability uncertainty.
(Table 2) summarizes the composition and names attributed to each severity level. Table 2 – Weighted Severity Indexes
Severity (q) Outages’ intensities included Qualification
1 Total Heavy Severity index
2 Total + serious Half Severity index
3 Total + serious + partial Large Severity index
4 Total + serious + partial + occasional Global Severity index
Because severity might range across a wide scale from total to no outage, it is not possible to identify a priori the extent to which households might have changed their behavior given the events’ severity that they have observed until 2014. In a context where supply is usually erratic, households might actually have adapted their daily behavior, as observed by [Kirubi et al., 2009]. In addition, long-run households behavior might have been shaped by the history of growth : although electricity service is viewed as a given acquirement in advanced countries, households in developing countries may consider electricity as a supplementary value-adding innovation but not primordial, eventually viewing it as a luxury good. In other words, in an uncertainty context, I make the assumption that electricity is considered as a substitutable good.
In these uncertainty conditions, there might be a hidden acceptance threshold above which a household might show a certain level of tolerance to the outages context, whereas below this threshold, the outages context would conversely delay its adoption. Because it remains unobserved by the researcher, the identification must approach this threshold through a gradual ranking strategy, computing the aforementioned range of severity indexes. The significance and robustness of each of them to instrumentation will be then tested in the main specification, with the objective of retaining the model that yields the best answer to statistical tests. A large part of the empirical work has been devoted to assessing the most relevantWeighted Severity Index.
4.2.3 Poverty index
The poverty index is derived from a multi-component analysis (MCA) of the unconnected assets owned by a household (Table 3). This index is the linear combination of the standardized coordinates of the categories on the first axis, weighted by their contribution. It is computed for each household, with positive values for the poorest ones.
Table 3 – Active variables in the MCA
Q91a. Own radio radio
Q91c. Own motor vehicle, car or motorcycle motor
Q91d. Own mobile phone mobile
Q92a. How often use a mobile phone use_mobile
Q93a. Source of water for household use_water
Q93b. Location of toilet or latrine sanit
Q104. Type of shelter of respondent shelter
Q105. Roof of respondent’s home roof
The first axis of the MCA concentrates 54% of the inertia, whereas the second (21%) and third axes (3,3%) are largely built from the missing values of certain peculiar categories. Hence, the first axis captures all meaningful information and can be used with confidence as a synthetic composite index of poverty (Table A.10).
4.3
Neighboring effect
As noticed by [Khandker et al., 2014], the observed connections level might occur partially by peer pressure. Although the neighbor example is obviously not an instrument for outages (see section I), it might nonetheless affect the dependent variable (Connection).
In a context of high connection costs and low power reliability, subscribing to electricity might actually result from a positive externality of social network, given the neighbor example. Because electricity might be perceived as a luxury good in a scarcity context, the leadership role of early adopters might strongly influence households’ decision to subscribe. The neighbor example might thus sustain a more or less sticky diffusion or barrier process : the adoption of electricity might have been much higher in one district than in another because households in the first district have been encouraging each other to subscribe (diffusion) whereas the collective memory of persistent low reliability might have led to a mutual confirmation bias not to subscribe in the second district (barrier). However, cross-sectional data do not allow the observation or estimation of any serial correlation that supports such a process.
I formulate the assumption that the current dispersion of connections across districts as ob-served in 2014 partially results from such a past diffusion process among the households within each district. Nevertheless, I do not assume the variance in space to be the full result of past va-riance in time and thus do not make the strong assumption that a cross-sectional regression could be equivalent to a within regression and would explain the dependent variable in the same way. Contrarily, I assume an unobservable past-time variation, while also assuming that its resultant might be observed as a footprint on the present geographical data.
Therefore, the assumption of independent and identically distributed observations in the geo-graphical dimension can not be hold, leading rather to assume heteroscedasticity among districts.
The neighbor effect is thus captured by clustering all estimations, following [Chakravorty et al., 2014] and [Khandker et al., 2014]. Because the model combines an individual-level variable (the poverty
index) and an aggregated variable (the Weighted Severity index), the use of clusters solves the
corrects the under-estimation of the standard error that would otherwise results from the use of an aggregated variable. The significance of the coefficients can then be properly diagnosed, avoiding any spurious regression.
4.4
Endogeneity issues
The evaluation must address three risks of endogeneity. First, a major determinant of the connection level might have been omitted from the specification. Second, there is a risk of reverse causality because the growing number of connected households could yield more frequent outages (Table A.8). Third, the data are sourced from a survey questionnaire and thus might be distorted by a measurement error.
As for potential omitted variables, the literature suggests two other obstacles to grid connection [Lee et al., 2014], [Khandker et al., 2014] : the high cost of connection and poor building quality. Because connection cost is a matter of relative wealth, the poverty index should be a suitable proxy for capturing this effect. As the index includes the type of shelter, it also captures building quality, which is thus not omitted from the explanatory factors. The poverty index can be thus used as a proxy to control for both obstacles together. However, because the index was built from an MCA, a robustness check should test for any residual correlation of shelter type with the error term.
Although the distance to transformers has been shown to have no significant impact on electrifi-cation, it has an indirect correlation through its interaction with building quality [Lee et al., 2014]. Were there any residual correlation between connection and distance to transformers, it would be captured by clustering under-grid households in the same district, with the implicit assumption of a distance to a notional centroid transformer.
However, there still might be forgotten or unknown omitted variables, even minor ones : the remaining endogeneity that they could generate would be solved by a relevant instrument.
Seven major causes of outages are known [KPLC, 2016] : extreme weather conditions (wind, lightning, rain, floods) ; contacts by animals with the lines or transformers ; growth of or falling trees ; vehicular collisions ; vandalism ; aging equipment ; and planned interruptions. Based on the detailed qualitative assessment presented in Table A.11, wind, rain and floods do not meet the exclusion restriction due to their strong zone effect. Animal contact, tree growth and vehicular collisions easily meet the exclusion restriction but would provide only weak instruments. Vandalism is obviously endogenous to poverty, and the age of installations is by definition neither random nor an exogenous factor.
Finally, only lightning meets the three required properties for an instrument : it is purely random, strongly correlated with the occurrence of outages and acceptably not a direct cause of reduced individual connections (Table A.12).
Lightning is an external random phenomenon that can cause a variety of direct damages to the grid through thermic, mechanical or electrical shocks. When a local strike hits a grid device, it has a strong leverage effect, triggering outages in large areas due to the propagation of excess voltage along the lines and an overload counter-wave effect caused by the automatic triggering of circuit breakers. These mechanisms make lightning’s correlation with outages much higher than the scarce possibility of large-scale direct damages to individual connections. The identification exploits then the strong heterogeneity of lightning in Kenya (see Section 2).
As mentioned above, a potential reverse-tide effect might occur, that is, a power shortage can cause a sudden overload along the electrical wires that in turn could trigger new outages in the neighboring districts (Table A.11). The lightning intensity in surrounding districts is thus also introduced as a candidate instrument.
A third instrument has been introduced, using the distance from the district’s centroid to the closest generator. A condition for the supply to meet the peak-load, the total power capacity that feeds the grid plays a key role in the occurrence of outages, because the short-run demand for electricity is inelastic. However, as soon as there are bottlenecks within the network, i.e., technical
devices are not of the same quality in all locations, primary generators will not be able to saturate the network with a given amount of produced electricity. As shown by Figure 9, part of the Kenyan grid still transports electricity using old 132 kV lines that were built before independence, and enhancement sub-stations have been built mainly along those lines. In these conditions, a dwelling located closer to a production center might be more likely to receive uninterrupted power.
As noticed by [Van de Walle et al., 2013], generator settlement is constrained much more strongly by the location of or access to primary energy than by consumption needs. Interes-tingly, the energy mix in Kenya largely depends on primary resources that are geographically constrained and thus strongly determine the establishment of utilities, especially the geothermal plants that produce the largest share of Kenya’s electricity. Overall, 75% of installed capacity is directly related to the country’s natural endowments (volcanos, rivers, lakes, wind, and Mombasa harbor on the coast) (Figure 1, right). As for Mombasa harbor, most if not all of the fuel plants have been built in or around the city because it’s the only sea harbor in Kenya, which is used to import oil and coal. Because the economic activity and population of Kenya are concentrated in the center and west of the country, long transmission lines have been drawn to Nairobi, Eldoret and Kisumu. In the same vein, the large wind project in Lake Turkana, located in the far North, will require 600kV long transmission lines toward Eldoret and Nakuru.
Under assumption of a heterogeneous grid, the geographic constraint of utilities’ location supports the exclusion restriction. Proximity to a power plant might be correlated with fewer outages while also being independent of the individual connection because the voltage discrepancy makes it technically impossible.
The two distances, one to the transformer and the other to the primary generators play two different roles : the first is a small factor in electrification, whereas the second is a good candidate for instrumentalizing reliability. Because transformers feed the last mile of distribution, they are close to the end of the grid and are themselves fed by the transmission lines network ; thus, trans-formers might suffer the consequence of an upstream tension fall. The distance to transtrans-formers is thus a possible explanatory factor for electrification, but not an external cause for outages. And whereas [Lee et al., 2014] used distance to the closest transformer as a potential explanation for subscriptions, this study seeks instruments for outages.
The distance to the closest generator meets instrumentation requirements because (1) it is both an external and random parameter relative to outages ; (2) the distance to the plant has no direct relationship with the decision to connect. Whether households that are located closer to a plant are more likely to subscribe because they expect fewer outages, it is exactly the information that the instrument intends to capture.
The Weighted Distance to the closest plant is defined as the minimum of the weighted distance to all generators, where the weight is the inverse of the plant’s capacity share of total power production.
4.5
Estimation methodology : severity index selection,
instrumenta-tion and non-linear calibrainstrumenta-tion
A first OLS estimation checks for any baseline effect and seeks for the relevant severity level for measuring this effect. A 2SLS then identifies the causal impact using lightning in the district, lightning in neighboring districts and the WCP index as instrumental variables to solve endoge-neity issues. Finally, an instrumented probit (IV Probit) confirms the preferred specification for assessing the impact of reliability on the likelihood of connection. This sub-section describes the identification steps that underpin the preferred specification (see section V).
4.5.1 Severity Index selection
The gradual ranking strategy intends to approach the hidden threshold of the connection deci-sion by selecting the relevant WSI. Selection criteria are based on backward-reading of statistical
tests according to the estimation framework (Tables A.14, A.17, A.19, A.20, and A.22). The test corresponding to the main statistical objective is verified first, then one checks whether the previous test was already passed successfully, the ante-penultimate test also, and so on, such that all tests composing the decision chain are satisfied. If a test is failed after the first steps were met, one switches to the closest model meeting the same initial set of tests in the decision chain.
The selection process was applied independently for each estimation framework, and the Large Severity Index was selected for each framework.
4.5.2 Entry models : OLS at the district level
Yielding the lowest AIC and a p-value equal to 0.000, the Large Severity Index was retained as the best indicator of power quality (Table A.14), in accordance with the following equation :
Connectioni = α0+ α1.COd(3) + α2.povertyi+ α3.COd(3).povertyi+ ui.
In this simple LPM specification, both indexes (severity and poverty) are significant at the 0.1% level. Their interaction is also significant, at the 1% level. The number of clusters (90) ensures that the standard error is converging to its true value, leading to a proper assessment of the estimates’ significance (Table A.15).
The entry model highlights the negative effect of outage uncertainty (Table A.16) as a possible channel of the result found by [Andersen and Dalgaard, 2013] at the country level : the impact of outages on growth might be rooted in the reliability uncertainty that deters certain individual Kenyan households from connecting to the grid.
The wealth index appears to be an important control variable ; indeed, the base specification would have been strongly downward biased (-0.515 instead of -0.313) if this factor had been omitted.
4.5.3 Instrumentation in a linear setting
Because it successfully passed all tests for instrumentation (Table A.17, equation iSev3iv), the Large Severity Index yields a robust model. The three instruments are strong enough (Stock-Yogo < 25 and first-stage F = 6.7) and would still yield consistent estimates if they were weak (Anderson-Rubin test : p = 0.000). The model is adequately identified on outages (under-identification test : p = 0.004) which are confirmed to be endogenous (endogenous test : p = 0.016). Finally, the instrumentation yields more consistent estimates than the OLS does (Hausman test : p = 0.02).
Using three instruments, the model is possibly over-identified once the interaction between severity and poverty is introduced (Hansen test : p = 0.092) ; this issue will be refined once the probit is instrumented.
However, the linear estimation does not ensure that the predicted connection level is a probabi-lity belonging to a [0 ;1] support. This shortcoming is all the more constraining because the study aims to predict which unconnected households should be selected for potential policy applications such as targeted incentives.
4.5.4 Calibration of the non-linear modeling
For the outcome to be a probability, a probit estimation is more suitable. A first attempt was made with a simple probit, which was then instrumented in a second step.
Applying the relevant diagnosis criteria, the simple probit led to the selection of the Large Severity Index as the best index (Table A.19).
Because the referral group is defined by connected households, the model predicts the likelihood of connection. However, from a policy perspective, one would expect a greater benefit to decrease the marginal cost of grid extension by increasing the accurate detection of unconnected households, compared with the simple cost of using the model. The latter has thus been calibrated to maximize the exact prediction of unconnected households by setting the cutoff in the diagnosis table at
75% (Table A.19). As shown in Figure 4, this level maximizes the model’s ability to identify unconnected households (specificity) at the cost of lower recognition of connected households (sensitivity).
Figure 4 – 75% cut-off on specificity
The model was then instrumented using the set of three qualified instruments from the 2SLS framework, utilizing the IV probit procedure that combines the probit modeling with first-stage linear regression.
However, none of the candidate IVprobit model with three instruments could pass the backward-decision criteria (Table A.20). The first-stage indicates that the issue arises from lightning by neighboring districts (Table A.21) ; although lightning and the distance to the closest generator are significant at the 10% level, lightning in neighboring districts is obviously not. Although there is no advanced test of over-identification in Stata’s -ivprobit- procedure, it seems intuitive that too many linear components in the first-stage regression might over-fit the model for a non-linear estimation. In addition, the previous borderline Hansen test in the 2SLS framework suggested the possibility of too many instruments.
Consequently, only the two main instruments were kept for further modeling : lightning (p-value = 0.090) and weighted distance to the closest electrical plant (p-(p-value = 0.000).
5
Empirical results
5.1
Preferred specification
The model with the Large Severity Index and two instruments successfully passes all selection tests (Table A.22, equation iSev3 ), showing the best discriminatory ability (ROC : 76.8) and consistent instrumentation (endogeneity : p = 0.000 ; lightning in first-stage : p = 0.006 ; Haus-mann : p = 0.017). This model exhibits accurate estimates at the 0.1% level for all variables in reduced form (Table 4), with both excluded instruments now strongly significant in the first-stage (below 1%).
Because it yields both accurate and unbiased estimates, this model is retained as the preferred specification. For the policy maker, it could be applied to infer the likelihood that any out-of-sample household is not connected, provided that the same data could be gathered to feed the coefficients.
Table 4 – Connection’s likelihood (IVPROBIT : reduced form and first-stage) Point estimates Standardized coef. Reduced form
Large severity outages -2.573∗∗∗ -1.454
(0.458)
Large severity outages x Poverty 4.581∗∗∗
(0.786) Poverty -3.026∗∗∗ -1.949 (0.331) Constant 0.797∗∗∗ (0.153) First-Stage
Large severity outages x Poverty 1.014∗∗∗
(0.212)
Poverty -0.0928 -0.106
(0.062)
Lightning intensity 0.00616∗∗ 0.237
(0.002)
Weighted distance to closest plant 0.0110∗∗∗ 0.309
(0.003)
Lightning intensity x Poverty 0.00202
(0.003) Weighted distance to closest plant x Poverty -0.00654
(0.005) Constant 0.0940∗∗ (0.034) Observations 1669 Clusters 90 AIC 1466.5 Wald Chi2 250.6 p-value (Wald) 0.000
Probit model with endogenous regressors : ivprobit of connection Instrumented variables : Partial outages, Partial outages x poverty
Excluded Instruments : Lightning, Wghtd. dist. to closest plant, Poverty interacted with both Variance : Robust cluster by DISTRICT, SE in parenthesis
Figure 5 – Connection’s probability given the level of reliability or poverty
5.2
Evaluation of the impact of Large Severity outages on the
connec-tion decision in a poverty context
Because the model consistently neutralizes the risks of endogeneity, it can now be confidently used to explore the impact of reliability and to compare this impact with the effect of poverty. Relying on [Williams, 2012] Table A.24 checks the initial statistical conditions of this evaluation.
5.2.1 Predicted likelihood of connection
As shown by Figure 5, the predicted probability of connection is not linear at the reliability or the poverty level. Interestingly, it is also incomplete given outages frequency : although the probability of finding a connected household is almost 0 where the rate of Large Severity reaches 100%, it amount only to 80% where this rate equals 0. There might be additional occasional outages that could possibly have a residual effect, deterring households from subscribing to an electricity contract. This point will be further addressed by extending the model to the next severity level (section VII).
5.2.2 Marginal effects
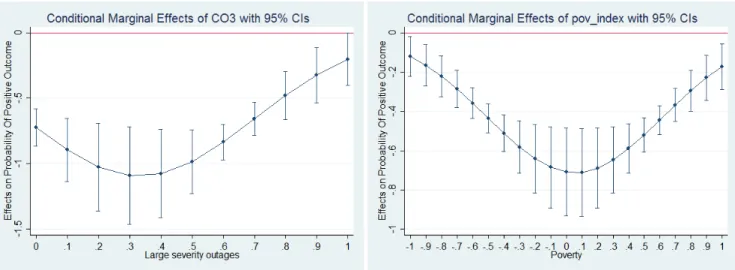
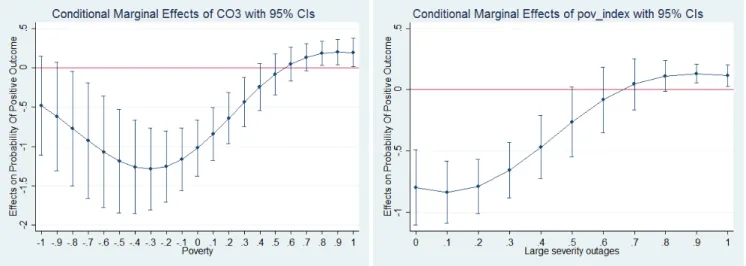
How does the predicted likelihood of connection change when reliability deviates from its mean or from any other referral values in the sample ? Answering this question entails an examination of the slope of predicted connection given the outage frequency in Figure 5, with the poverty index fixed at a specific level (its mean or median).
With the observed values in the sample, a 1 percentage point higher frequency of Large Severity outages causes a 0.673 percentage point fewer connected households (Table 5). Comparing the standardized estimates in Table 6, the average marginal effect (AME) of reliability (-0.196) is 10% larger than the effect of poverty (-0.178).
However, these estimates depend on the fit of outages and poverty distributions to their true distributions in the Kenyan population, i.e., on the sample representativeness. With 1,669 ob-servations, a normal distribution can be confidently assumed for the poverty index, and so it is in the sample (not shown). Applying the central-limit theorem, the sample mean of the poverty index can be considered a referral value, already converging to and thus representative of its true value in the Kenyan population. However, outages perception is not normally distributed across the districts (not shown). Therefore, it is better to assess the marginal effects at several referral values of the severity index.
At averages of the explanatory variables (Table 5, column 2 ), a 1 percentage point higher frequency of Large Severity outages causes a 1.079 percentage point fewer connected households ;
Table 5 – Marginal effects of third severity’s outages and poverty (IVPROBIT) Average Marginal Effect Marginal Effect at Means Marginal Effect at Median Marginal Effect at 1st decile Marginal Effect at last decile Large severity -0.673∗∗∗ -1.079∗∗∗ -0.994∗∗∗ -0.076∗ -0.257∗∗ outages (0.102) (0.188) (0.162) (0.034) (0.086) Poverty -0.516∗∗∗ -0.703∗∗∗ -0.814∗∗∗ -0.044∗ 0.046 (0.081) (0.112) (0.116) (0.020) (0.121) Observations 1669 1669 1669 1669 1669
Probit model with endogenous regressors : ivprobit of connection Instrumented variables : Partial outages, Partial outages x poverty
Excluded Instruments : Lightning, Wghtd. dist. to closest plant, Poverty interacted with both Variance : Robust cluster, SE in parenthesis
∗ p < 0.05,∗∗ p < 0.01,∗∗∗ p < 0.001
Table 6 – Marginal effects of third severity’s outages and poverty (IVPROBIT) Average Marginal Effect Marginal Effect at Means Marginal Effect at Median Marginal Effect at 1st decile Marginal Effect at last decile Stdzd Large -0.196∗∗∗ -0.304∗∗∗ -0.281∗∗∗ -0.028∗ -0.086∗∗∗ severity (0.030) (0.052) (0.045) (0.012) (0.023) Stdzd Poverty -0.178∗∗∗ -0.242∗∗∗ -0.269∗∗∗ -0.019∗ -0.021 (0.027) (0.037) (0.040) (0.008) (0.033) Observations 1669 1669 1669 1669 1669
Conditional marginal effects : margins of connection, Standardized explanatories Instrumented variables : Partial outages, Partial outages x poverty
Excluded Instruments : Lightning, Wghtd. dist. to closest plant, Poverty interacted with both Variance : Delta-method delta, SE in parenthesis