HAL Id: hal-02144971
https://hal.sorbonne-universite.fr/hal-02144971
Submitted on 17 Feb 2021
HAL is a multi-disciplinary open access
archive for the deposit and dissemination of
sci-entific research documents, whether they are
pub-lished or not. The documents may come from
teaching and research institutions in France or
abroad, or from public or private research centers.
L’archive ouverte pluridisciplinaire HAL, est
destinée au dépôt et à la diffusion de documents
scientifiques de niveau recherche, publiés ou non,
émanant des établissements d’enseignement et de
recherche français ou étrangers, des laboratoires
publics ou privés.
Vibrational Signatures of Calcium Oxalate Polyhydrates
Ivan Petit, Gustavo D. Belletti, Théau Debroise, Manuel J. Llansola-Portoles,
Ivan T. Lucas, César Leroy, Christian Bonhomme, Laure Bonhomme-Coury,
Dominique Bazin, Michel Daudon, et al.
To cite this version:
Ivan Petit, Gustavo D. Belletti, Théau Debroise, Manuel J. Llansola-Portoles, Ivan T. Lucas, et
al.. Vibrational Signatures of Calcium Oxalate Polyhydrates. ChemistrySelect, Wiley, 2018, 3 (31),
pp.8801-8812. �10.1002/slct.201801611�. �hal-02144971�
1 2 3 4 5 6 7 8 9 10 11 12 13 14 15 16 17 18 19 20 21 22 23 24 25 26 27 28 29 30 31 32 33 34 35 36 37 38 39 40 41 42 43 44 45 46 47 48 49 50 51 52 53 54 55 56 57
Vibrational Signatures of Calcium Oxalate Polyhydrates
Ivan Petit,
[a]Gustavo D. Belletti,
[b]Théau Debroise,
[a]Manuel J. Llansola-Portoles,
[c]Ivan T. Lucas,
[d]César Leroy,
[a]Christian Bonhomme,
[a]Laure Bonhomme-Coury,
[a]Dominique Bazin,
[a]Michel Daudon,
[e, f]Emmanuel Letavernier,
[e, f]Jean Philippe Haymann,
[e, f]Vincent Frochot,
[e, f]Florence Babonneau,
[a]Paola Quaino,
[b]and Frederik Tielens*
[a, g] The vibrational signatures of the calcium oxalate polyhydratesare investigated using a combination of Density Functional Theory-Dispersion corrected, Fourier Transform- Raman and -Infrared (IR) spectroscopies. Most vibrational bands were assigned and the theoretical predictions were compared with in-house and other experimental data, for both, IR and Raman spectroscopies. Such an approach allowed a more accurate analysis of vibrational spectra helping in the completion of the
band assignments of the vibrational bands of the mono, di, and tri hydrate calcium oxalate (COM, COD, and COT). Particular attention has been paid to the degree of hydration of COD, the low Raman wavenumbers, and the presence of oxalic acid in natural calcium oxalate polyhydrates. The obtained results are expected to be supportive in the detection of the different polyhydrates in natural samples, such as in kidney stones.
Introduction
Fourier Transform (FT)-Raman and (FT)-Infrared spectroscopies
constitute significant tools for bio-medical diagnoses.[1]
Two different approaches are at the present investigated to imple-ment these techniques into the regular diagnosis apparatus. The first one is based on statistical analyses of the vibrational spectra. This approach has been used to study the disorder and variations in composition as well as in the crystal structures of deposits in the tissues.[2]
This methodology has been explored for a wide range of pathologies, however only a few are
routinely used into applications at the hospital.[3]
A major weakness of the implementation of a statistical approach is mainly due to the fact that significant variations in the IR
spectrum can be caused by subtle changes in the preparation procedure.[4]
Another reason is related to the need for a precise analysis of the shape and the position of absorption bands for
these two spectroscopies.[5]
At the moment, one of the few applications is to establish medical diagnosis for kidney stones [6]
and ectopic calcifications.[7]
Recently, selected results regard-ing these research themes, as well as recent experimental developments, such as the ability to perform nanometer scale
near-field infrared microscopy[8]
provided relevant data in this field.[3]
Due to recent technical developments in laboratory apparatus, IR spectroscopy can be implemented at sub-cellular scale in a time frame of seconds to milliseconds. This is of major importance due to the amount of samples to be collected and more than 75,000 kidney stones and 1,100 biopsies have been already characterized at the Necker and Tenon hospitals using the described techniques. The data bank created from those measurements facilitates epidemiologic studies for the clinician to relate urolithiasis to other major
public health problems such as type II diabetes.[9]
On the contrary, Raman spectroscopy is not routinely used at the hospital for microcrystalline pathologies, mainly because it has some disadvantages compare to IR spectroscopy. For example, in the case of sub-micrometer crystals, the Raman probe, i. e. the excitation laser, can modify the chemistry of the deposit through heat dissipation. In addition, the tissue may display a significant background signal (Raman signature and/ or auto-fluorescence) which can impact on the reliability of the detection of deposits with low Raman scattering cross section. The signal to noise ratio can however be improved through suitable tuning of the excitation laser wavelength from visible to near-IR.
However, Raman shows also major advantages compare to IR spectroscopy. Compositional mapping of samples simply deposited on supports used routinely at the hospital, i. e. glass, [a] Dr. I. Petit, T. Debroise, Dr. C. Leroy, Prof. C. Bonhomme, Dr. L.
Bonhomme-Coury, Dr. D. Bazin, Dr. F. Babonneau, Prof. F. Tielens
Sorbonne Université, CNRS, Collège de France, Laboratoire de Chimie de la Matière Condensée de Paris, LCMCP, F-75005 Paris, France
E-mail: frederik.tielens@upmc.fr [b] Dr. G. D. Belletti, Prof. P. Quaino
Instituto de Química Aplicada del Litoral, IQAL (UNL-CONICET), PRELINE (FIQ-UNL), Universidad National del Litoral, Santa Fe, Argentina [c] Dr. M. J. Llansola-Portoles
Institute for Integrative Biology of the Cell (I2BC), CEA, CNRS, Université Paris-Saclay, F-91198, Gif-sur-Yvette cedex, France
[d] Dr. I. T. Lucas
Sorbonne Université, CNRS, Laboratoire Interfaces et Systèmes Electro-chimie, LISE, F-75005 Paris, France
[e] Dr. M. Daudon, Prof. E. Letavernier, Prof. J. P. Haymann, Dr. V. Frochot UMR S1155, INSERM/UPMC, 4 Rue de la Chine, 75970 Paris Cedex 20, France
[f] Dr. M. Daudon, Prof. E. Letavernier, Prof. J. P. Haymann, Dr. V. Frochot AP-HP, Hôpital Tenon, Explorations fonctionnelles multidisciplinaires, 4 Rue de la Chine, 75970 Paris Cedex 20, France
[g] Prof. F. Tielens
General Chemistry (ALGC), Vrije Universiteit Brussel (Free University Brussels-VUB), Pleinlaan 2, 1050 Brussel, Belgium
Supporting information for this article is available on the WWW under https://doi.org/10.1002/slct.201801611
Wiley VCH Donnerstag, 16.08.2018
1 2 3 4 5 6 7 8 9 10 11 12 13 14 15 16 17 18 19 20 21 22 23 24 25 26 27 28 29 30 31 32 33 34 35 36 37 38 39 40 41 42 43 44 45 46 47 48 49 50 51 52 53 54 55 56 57
can be easily obtained with a sub-micron resolution. Measure-ments through glass cover slips protecting air sensitive samples
are also possible. In addition, in Raman the 50 cm 1 to
400 cm 1
spectral range is accessible even down to 10 cm 1
with enhanced filtering of the laser line, providing precise (unambiguous) chemical signature of the sample under scrutiny.
The use of IR or Raman spectroscopy as diagnostic tools at the hospital ideally presupposes a complete understanding of the origin of the absorption (IR) or scattering (Raman) bands of pathological deposits. This is achievable through the calcula-tion of theoretical ab initio IR and Raman spectra of the different
constituting compounds. The complete characterization of the
spectra is of utmost importance in the identification for the calcium oxalate compounds present in more than 70% of the kidney stones, and in numerous tissue calcifications.
By computing, at the Density Functional Theory-Dispersion (DFT D) level, the IR and Raman vibrational spectra of the polyhydrates of the calcium oxalates: whewellite (monohydrate: COM), weddellite (dihydrate: COD), and caoxite (trihydrate: COT), we provide data that can be used to identify/quantify the different polyhydrates in natural mixtures such as in biological calcifications or kidney stones.
In this work, the theoretical predictions are compared with the available experimental data, for both, IR and Raman spectroscopies allowing the assignment of the most relevant vibrational bands of calcium oxalate polyhydrates.
Results and discussion
Structural analysisThe unit cell coordinates and parameters of the calcium oxalate polyhydrates were optimized at the PBE D2 or the PBE D3 level. The corresponding parameters are shown in Figure 1 and the unit cell parameters are shown in Table 1.
COM, CaC2O4⋅H2O (also known as whewellite) is the most
abundant calcium oxalate (66%) phase found in kidney
stones.[10]This chemical phase has been studied in the past by
numerous groups, both experimentally[11] and theoretically.[12]
The COM phase crystallizes in the monoclinic crystalline system
with the space group P21/c. In 1965, Arnott et al.[13]solved the
structure of the COM phase, extracted from the stem and leaves of Yucca rupicola, by X-rays. Although containing many impurities, crystals of sufficient size (200 μm) could be selected for a single crystal study, which was not possible with the
previous synthetic samples. More recently, several studies have helped to refine the structural parameters of the COM, in
particular those from Tazzoli et al.,[14]
Hochrein et al.,[15] and Deganello et al..[16]
These investigations have established COM structures at different temperatures and have shown that there
can be a reversible change in space group from P21/c to I2/m
at 328 K. Finally, a neutron diffraction study by Daudon et al.[17]
on a single crystal of COM allowed to locate the proton positions of the water molecules of the structure. Therefore, this structure has been chosen as the starting geometry for our calculations.
The COD phase is commonly found in kidney stones but is also present as sediment in the Weddell Sea in Antarctica
hence its name: weddellite.[18]
Its structure has the particularity of presenting zeolitic channels. These channels allow adsorp-tion of large quantities of water molecules that can diffuse
’freely’ in the structure. These molecules should not be
confused with the ’crystalline’ water which is an integral part of
the structure. Indeed, the COD phase formula is CaC2O4⋅(2 + x)
H2O, where x represents the amount of water present in the
zeolitic channels (x < 1). Even now, the number of water molecules within the structure is subject to discussion. In 1964, Sterling proposed a structure for this phase and addressed the problem of defining the number of water molecules contained in the whole structure.[18–19]
He established that the weddellite crystallizes in the tetragonal system with I4/m space group. He also determined the positions and partial occupations of oxygen associated with these water molecules. Tazzoli and
Domenegetti[14]
later refined the structure and determined an x value of 0.37, which is retained in this study (corresponding to 3 extra water molecules in the COD unit cell). The disorderly nature of the water molecules along the z axis has been demonstrated with the separation of the positions of oxygen atoms in two sites by crystallographic studies. Based on the refinements of the structures of kidney stones by Izatulina
et al.[20] and by Tazzoli and Domenegetti,[14] Izatulina et al.[21]
estimated an x value ranging from 0.13 to 0.37.
Additionally, COD is a metastable phase that turns into COM if it is not kept under certain conditions: Conti et al. have
followed this transformation by X-ray diffraction and IR[22]
suggesting that the presence of this phase in kidney calcification is promoted by the environment in which it evolves.
The COT trihydrate phase also called caoxite is the least
common of the three calcium oxalate hydrates.[23] With the
chemical formula CaC2O4⋅3H2O, it presents a triclinic structure
with space group P�1. Its name is derived from the acronym for
CAlcium OXalate and Centennial Anniversary Of X-rays and was
proposed on the occasion of centenary of X-ray diffraction.[24]
Deganello et al.[25]were the first to determine the structure for
COT which existence had previously been suspected by
Walter-Levy and Laniepce,[26]and Gardner.
First proposed as an intermediary in the formation of forms
COM and COD in kidney stones,[23,27]this hypothesis has since
been abandoned in favor of that of an amorphous phase of
calcium oxalate as a precursor.[28] Although, rarely reported in
1 2 3 4 5 6 7 8 9 10 11 12 13 14 15 16 17 18 19 20 21 22 23 24 25 26 27 28 29 30 31 32 33 34 35 36 37 38 39 40 41 42 43 44 45 46 47 48 49 50 51 52 53 54 55 56 57 synthesis.[31]
The structure solved by Basso et al.[24a]
was used as starting geometry for simulations involving the COT phase.
The calculated parameters for COM, COD and COT show good agreement with the experimental data, as it can be seen in Table 1. PBE D2 approach shows better results in compar-ison with experimental values, than those obtained using PBE D3. However, the structures of calcium oxalate polyhy-drates can be adequately modeled with both methods, with a preference for the former, probably due to the strong ionic
character of the crystal (i. e. the presence of Ca2 +
and C2O42 ions).
Spectroscopic analysisIR spectra
In Figure 2 we compare the experimental (see experimental details) IR spectra measured at 4 K, with the calculated ones (PBE D2). The spectra are normalized to the most intense peak. The theoretical spectra are obtained by fitting sums of Gaussian functions on the different calculated band intensities.
Whewellite - COM
The IR spectrum can be divided in three different zones of interest for its analysis (See Table 2). First, the “water region”
in which 5 bands above 2900 cm 1,
in room temperature experiments and even 6 considering the very broad pic around
3212 cm 1
in our experiment at very low temperature, whereas
only four are calculated. As expected by Shippey,[32]
and by Petrov et al.,[33]
the missing line in the calculation is due to an overtone 2δ(HOH), and reinforced by Fermi resonance with one
of the neighboring fundamental[33]
bands which cannot be calculated in the harmonic approximation.
As expected by Conti et al.[34]
propose than the δ(HOH)
around 1600 cm 1consist on 2 contributions. The first one very
broad is associated to the δ(HOH) of the water strongly coupled with the motion of the oxalates molecules. Our calculations confirm this coupling between the water molecule
1 of the structure of Daudon et al.[17]
and the oxalates
molecules, which resulted in wavenumbers between 1591 cm 1
and 1623 cm 1. This result is in very good agreement with the
broad peak observed experimentally around 3212 cm 1
(sup-posed to be 2δ(HOH)). The second contributions are a medium
weak band proposed by Conti et al.[34] being assigned to
δ(HOH) of the more localized water molecule 2 of Daudon
et al..[17] In our calculations, the wavenumbers around
1637 cm 1 were associated to the δ(HOH) of both water
molecules together, and not only of water molecule 2. Never-theless no implication of the oxalate ion has been observed. This calculated wavenumber fits very well with the main
overtone 2δ(HOH) measured around 3268 cm 1.
The second and third zones cover respectively the broad
ν(CO) region around 1400 cm 1, and the low wavenumber
region between 1000 and 500 cm 1, corresponding to the
different COO vibrations (wagging, stretching and bending). The calculated vibrational spectrum is in agreement with
experiment from Shippey[32] and Petrov et al.,[33] except for
some small expected band shifts due to the calculation level
Wiley VCH Donnerstag, 16.08.2018
1831 / 118228 [S. 8803/8812]
1
used. A point raised in the Shippey study concerned the different H-bonds present in whewellite, which were calculated from our optimized whewellite structure. The following H-bond
distances were determined: H2O Ox along c-axis: 2.638 and
2.713 Å; H2O-H2O 2.786 Å; H2O Ox along b-axis: 2.899 - 2.899 Å.
In general, a small but significant redshift compared with the experimental spectrum which is attributed to the use of DFT (PBE D level), which slightly overestimates H-bond inter-actions, such as those between the oxalate and calcium ions with the neighboring water molecules.
Weddellite - COD
The calculated IR spectrum for weddellite is able to predict, within the experimental error, all bands. The same very small redshift due to the accuracy of the calculation level is observed. The characteristic carbonyl symmetric stretching (exp.: 1589–
1578 cm 1
) is clearly recovered (theor.: 1689–1539 cm 1
), and predicted to be the most intense band, which is in agreement with the experimental spectrum (See Table 3). The zone,
between 3200–3700 cm 1
, corresponds to the O H elongation of the water molecules. The identification of the vibration modes from the calculation presented in Table 3 shows that several vibrational combinations are involved. This is due to the large hydrogen bond network between the water molecules, and between water and oxalate entities. The experimental spectra show a very broad band in this range, due to the presence of mobile zeolitic water in the COD unit cell, in contrast with COM. The mobility of the water molecules in the channels lead to a broader set of conformations and thus a broader range of which vibrations, making it difficult to interpret the part of the spectrum.
In order to investigate possible phase transitions or changes in the degree of hydration, which are related to the x parameter of weddellite, we calculated the IR spectra for x values between 0 to 1 (corresponding to 0 and 8 extra water molecules per unit cell). The spectra are presented in Fig 3. We show that for 5 water molecules or more per unit cell, intense
bands around 2800 cm 1appear on the calculated spectra but
are not present in the experimental spectrum suggesting that the weddellite does not contain more than 4 zeolitic water molecules per unit cell. This result agrees with the calculated
adsorptions energies50. For the structures having between 0
and 4 (x = 0 – 0.5) water molecules, the IR spectra are quite similar and in good agreement with the experimental one.
Caoxite - COT
The calculated IR spectrum for caoxite presents a good agreement with the experiment (See Table 4). The main difference is the relative intensity between the “water” bands
above 2900 cm 1and the CO/CC band around 1700 cm 1. This
inversion in intensity might be due to the dehydration process of the experimental phase. On the basis of the calculated spectra, the assignments for all bands are proposed (See
Table 4). Raman spectra
Raman spectroscopy is a highly reliable technique for the identification of the different Ca oxalate polyhydrates in kidney
stones. Previous reports[37] show accurate and reliable Raman
spectral identification assignment, e. g. COM can be easily identified from the other ones, if two strong bands appear at
∼ 1489 cm 1 and ∼ 1462 cm 1 (in that region, COD and COT
1 2 3 4 5 6 7 8 9 10 11 12 13 14 15 16 17 18 19 20 21 22 23 24 25 26 27 28 29 30 31 32 33 34 35 36 37 38 39 40 41 42 43 44 45 46 47 48 49 50 51 52 53 54 55 56 57
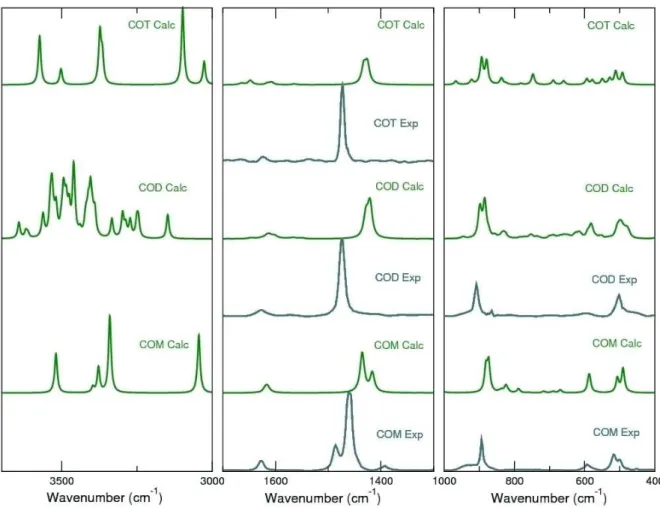
In Figure 4 we compare the experimental Raman spectra, with the calculated ones (PBE D3) obtained by fitting sums of Gaussian functions on the different calculated band intensities. The spectra are normalized to the most intense band.
Whewellite - COM
The Raman spectra, similarly to the IR spectra, can be divided
in three zones: the “water” region (3600 - 3000 cm 1
), the CO
and CC stretching zone (1650 - 1350 cm 1
), and the low
wavenumbers zone (1000 - 10 cm 1
).
In Table 5 the theoretical Raman bands for whewellite have been reported, and compared with the experimental results of ref.,[34]
which are comparable to our experimental Raman data. Five bands corresponding to symmetric and asymmetric OH
vibrations of H2O molecules are observed in the first zone, in
agreement with those reported by Conti et al..[34]
The oxalate vibrations in different planes (the perpendicular ab and bc planes), and a vibration synchronism with the oxalate nearest
neighbor occur around 1500 cm 1
. These bands appear shifted to higher wavenumbers in our calculations. Low wavenumbers
zone below 1000 cm 1
correspond to different OCO vibrations, water vibrations and lattice vibrations where Ca is involved.
Around 900 cm 1
, bending OCO vibrations are observed. Lattice
vibrations which involved Ca ions are below 330 cm 1
, and for
an easiest identification CaO2Ca rhombus structures have been
established (Figure 5).
It is interesting to note that the agreement of the calculated spectrum with the experimental one between 1700 and
400 cm 1
is particularly good, except for some small expected band shifts and intensities.
Weddellite - COD
The calculated weddellite Raman spectra predict relatively well our experimental results and are in agreement with the
reported data, except for some small band shift differences.[35,38]
Table 6 shows the results for the calculated spectra and their
comparison with the experimental assignation of Frost et al..[38]
The same regions described for COM can be identified.
Between 3500–3200 cm 1 experimental results show only a
broad band, but in our theoretical results multiple and narrow peaks of OH stretching are observed because of the nature of
the calculation at low temperature. Between 1470–1370 cm 1,
we observe just one broad peak at 1425 cm 1, that can
corresponds to the overlap of the strong νa(CO) band with the
νs(CC) + δ(OCO) vibration bands which is indicated around
1475 cm 1 in ref..[34] Additionally, it is important to note that
water vibrational bands are coupled with those of the oxalates
and Ca below 900 cm 1. For a better description of these
vibrations, CaO2Ca rhombus structures have been identified
and shown in Figure 5.
Caoxite - COT
The Raman spectrum for caoxite exhibits the same three distinguishable zones, which have been described for COM and COD spectra. The assignment of bands in the calculated Raman spectrum and its comparison with previous experimental
results[34]are presented in Table 7. Our theoretical results show
small shifts in the bands around 1470 cm 1with respect to the
experimental ones.
In the CO and CC stretching zone between 1000 and
500 cm 1, we find the vibration of OCO bending and some
vibrations corresponding to water molecules. The zone of low
wavenumbers (below 1000 cm 1) presents a band profile
similar to COM but with different band positions, which is characteristic for each calcium oxalate polyhydrates. It is interesting to note that water vibrations are important in this region. A detailed description is presented in Table 7, which until now and to the best of our knowledge was not carried out in previous works. For a better analysis, the particular COT
structure allows us to define only a CaO2Ca rhombus structure,
as seen in Figure 6. In addition, the differences of the bands
between COT and the other polyhydrates will be discussed
below.
In the interesting work of Conti et al.[35] discussing the normal modes of the oxalate ion with average geometry, 2 vibrational modes are still missing. To complete the list of
vibrations we attempted to add the missing B2gmode. It was
concluded that this mode might be coupled with the B1umode
(not observed), showing vibrations wavenumbers for the
oxalate ions in one plane (ac plane) of ∼ 838 cm 1
and
∼ 825 cm 1
for the other plane (bc plane), which are thus mixed with vibrations of the water molecules.
Identification of the low wavenumber Raman bands
There is not much information about band assignment in the low wavenumber Raman region, because of the existence of both, coupled and lattice vibrations. According to our theoret-ical results and to shed light on possible deeper character-izations leading to new analysis methodologies, detailed assignments are displayed in Figure 7, and Tables 5, 6 and 7. The pattern of the theoretical spectra do not completely fit the experimental ones, especially the intensities of some bands are not completely well reproduced, which might be caused by the shape of the oxalate particles.
Our results show that around 890 cm 1, the COM bands are
found at lower wavenumbers than the bands of the other polyhydrates, due to CC stretching and OCO bending. For COD and COT, two easily distinguishable bands are observed, while for COM the bands are strongly overlapping. Previous
exper-imental results[34]are in agreement with ours, although a single
band for the three cases was found, which could be due to experimental issues, such temperature and instrumental broad-ening.
The correct assignment of the Raman bands observed
between 600–490 cm 1help us to identify the calcium oxalate
polyhydrates because this region presents a particular profile for each one. The bands correspond to vibrations in which water, oxalate and Ca ions are involved. The band of high intensity for that zone is found at the following wavenumbers:
COM ( ∼ 490 cm 1), COD ( ∼ 498 cm 1) and COT ( ∼ 511 cm 1),
which correspond to the experimental bands:[34]
503, 506 and
507 cm 1 respectively. Interestingly, the trend observes
with experimental data is respected through our DFT calculations despite the slightly shifted values.
Another important region is between 300–10 cm 1, where
other specific water molecules, oxalate and Ca ions are detected.
The band around 200 cm 1 allows to distinguish between COM
(∼ 205 cm 1), COD (∼ 210 cm 1) and COT (186 cm 1). That band
includes torsional vibration bands of CaO2 groups coupled with water and OCO torsional vibrations that have a vibration mode that is symmetric with the other OCO, which forms the oxalate ion (Figure 8a). In addition, the
1 2 3 4 5 6 7 8 9 10 11 12 13 14 15 16 17 18 19 20 21 22 23 24 25 26 27 28 29 30 31 32 33 34 35 36 37 38 39 40 41 42 43 44 45 46 47 48 49 50 51 52 53 54 55 56 57
other OCO torsional vibrations that have an asymmetric vibration with the next one in the ion (Fig. 8 b), coupled with CaO2 torsional vibrations, are observed as a singular peak at ∼ 139 cm
1 or 148 cm 1 for COM and COD, respectively.
This assignments can be confirmed and with good agree-ment with the previous experiagree-mental work reported by Conti et al.[34]
Comparison between oxalic acid and Ca oxalate mono and di hydrate
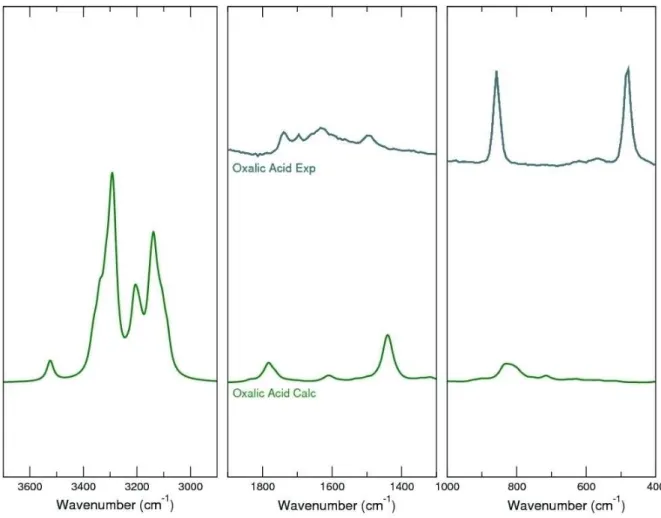
Although, the small probability of the presence of the acidic oxalate form, its spectrum was investigated. Due to its low first pKa around 1.2, it is not expected to be present in the synthetic samples, nevertheless this cannot be said with certainty for natural samples. So, for the sake of comparison we calculated the Raman spectrum of the oxalic acid. It is interesting to note that if oxalic acid would form during the synthesis of Ca oxalates, it could be clearly distinguished from its Ca salt counterparts. The theoretical Raman spectrum of oxalic acid dihydrate has been obtained and compared with an exper-imental one (see Figure 9). Calculated Raman spectrum predicts well the experimental results, and it is in good
agreement with previous studies.[39]
Only the signal at 1750 cm 1 (corresponding to the
CO stretch band) shifts slightly at higher wavelengths in the theoretical spectrum. This band shows the presence of oxalic acid, since it is absent in the calcium oxalates COM and
COD, the most common polyhydrates found in kidney
stones. According to these results, it is expected that if oxalic acid is present in natural samples, it can be easily detected and
Wiley VCH Donnerstag, 16.08.2018
1831 / 118228 [S. 8810/8812]
1
quantified. As expected, in our samples we conclude that no oxalic acid is present.
Conclusions
DFT calculations performed on the calcium oxalate polyhydrate unit cells were used to investigate the vibrational bands measured by Raman and IR spectroscopies. Most bands were assigned and the theoretical predictions were compared when possible with available experimental data, for both, IR and Raman spectroscopies. Such an approach allowed a more accurate analysis of vibrational spectra helping in the comple-tion of the assignments of the vibracomple-tional bands of the three calcium oxalate polyhydrates.
The IR spectra of COM and COT were very well reproduced. Due to the presence of zeolitic water molecules in the COD
structure, a systematic study on the x parameter in CaC2O4⋅(2 +
x) H2O was undertaken. By calculation of the different spectra
for x = 0 – 1 we showed that the typical x-value is equal to three, which corresponds to the degree of hydration found in the experimental samples. Moreover, we were able to present several distributions for the water molecules in the channels of COD structure, which motivated us to start to unravel thoroughly the water structure at the molecular level,
combin-ing spectroscopic techniques and ab initio calculations. We concluded that the channel available for water adsorption is filled with a maximum of two to three water molecules per unit cell (one channel with two and another with one water molecule).
The Raman spectra for the three calcium oxalate polyhy-drates were calculated and completely resolved, which is expected to facilitate the characterization of the calcium oxalate polyhydrates in natural samples.
It has been paid special attention to the low wavenumber Raman active vibrations and the vibrations of oxalic acid. The low vibrational modes in the Raman spectrum are of importance in the identification of the different oxalate polyhydrates, whereas the oxalic acid was studied to inves-tigate its presence in the experimental samples. A theoretical spectrum of oxalic acid was discussed and compared with the calcium polyhydrate forms.
Supporting Information Summary
The computational details including the calculation level and the information on the vibrational spectrum calculations, as well as the experimental details concerning the origin of the samples and the technical details of the experiments are presented in the Supporting Information.
Acknowledgements
The French state funds managed by the ANR within the Investisse-ments d’Avenir programme under reference ANR-11-IDEX-0004-02, and more specifically within the framework of the Cluster of Excellence MATISSE led by Sorbonne Université. HPC resources from GENCI-[CCRT/CINES/IDRIS] (Grant 2016-[x2016082022]) and the CCRE of Université Pierre et Marie Curie are also acknowl-edged.
Conflict of Interest
The authors declare no conflict of interest.
Keywords: Calcium oxalate · DFT · IR · polyhydrates · RAMAN
[1] a) C. Krafft, V. Sergo, Spectr.: Int. J. 2006, 20, 195–218; b) M. Pilling, P. Gardner, Chem. Soc. Rev. 2016, 45, 1935–1957.
[2] F. Severcan, P. I. Haris, Vibrational Spectroscopy in Diagnosis and
Screen-ing, Vol. 6 of Advances in Biomedical Spectroscopy, IOS press ed., 2012.
[3] a) F. Le Naour, M.-P. Bralet, D. Debois, C. Sandt, C. Guettier, P. Dumas, A. Brunelle, O. Laprevote, Plos One 2009, 4; b) F. Le Naour, C. Sandt, C. Peng, N. Trcera, F. Chiappini, A.-M. Flank, C. Guettier, P. Dumas, Anal.
Chem. 2012, 84, 10260–10266.
[4] M. J. Baker, J. Trevisan, P. Bassan, R. Bhargava, H. J. Butler, K. M. Dorling, P. R. Fielden, S. W. Fogarty, N. J. Fullwood, K. A. Heys, C. Hughes, P. Lasch, P. L. Martin-Hirsch, B. Obinaju, G. D. Sockalingum, J. Sule-Suso, R. J. Strong, M. J. Walsh, B. R. Wood, P. Gardner, F. L. Martin, Nat. Prot.
2014, 9, 1771–1791.
[5] M. Daudon, V. Frochot, D. Bazin, P. Jungers, C. R. Chim. 2016, 19, 1514– 1526.
[6] N. Quy Dao, M. Daudon, Infrared and Raman Spectra of Calculi., 1997. [7] A. Lionet, M. Haeck, A. Garstka, V. Gnemmi, D. Bazin, E. Letavernier, J.-P.
Haymann, C. Noel, M. Daudon, C. R. Chim. 2016, 19, 1542–1547. [8] a) A. Dazzi, C. B. Prater, Chem. Rev. 2017, 117, 5146–5173; b) D. Bazin, M.
Daudon, Ann. Biol. Clin. 2015, 73, 517–534.
[9] M. Daudon, O. Traxer, P. Conort, B. Lacour, P. Jungers, J. Am. Society of
Nephrol. 2006, 17, 2026–2033.
[10] M. Daudon, Épidémiologie actuelle de la lithiase rénale en France, Vol. 39, Elsevier, 2005.
[11] T. Echigo, M. Kimata, A. Kyono, M. Shimizu, T. Hatta, Mineralogical
Magazine 2005, 69, 77–88.
[12] H. Colas, L. Bonhomme-Coury, C. C. Diogo, F. Tielens, F. Babonneau, C. Gervais, D. Bazin, D. Laurencin, M. E. Smith, J. V. Hanna, M. Daudon, C. Bonhomme, CrystEngComm 2013, 15, 8840–8847.
[13] H. J. Arnott, F. G. E. Pautard, H. Steinfink, Nature 1965, 208, 1197- + . [14] V. Tazzoli, C. Domeneghetti, Am. Miner. 1980, 65, 327–334.
[15] O. Hochrein, A. Thomas, R. Kniep, Z. Anorg. Allg. Chem. 2008, 634, 1826– 1829.
[16] a) S. Deganello, Z. Kristallogr. 1980, 152, 247–252; bS. Deganello, Acta
Crystallogr., Sect. B: Struct. Sci. 1981, 37, 826–829.
[17] M. Daudon, D. Bazin, G. Andre, P. Jungers, A. Cousson, P. Chevallier, E. Veron, G. Matzen, J. Appl. Crystallogr. 2009, 42, 109–115.
[18] C. Sterling, Science 1964, 146, 518-&. [19] C. Sterling, Acta Crystallogr. 1965, 18, 917-&.
[20] A. R. Izatulina, V. Y. Yelnikov, Structure, chemistry and crystallization
conditions of calcium oxalates - The main components of kidney stones,
Springer Nature Switzerland AG., 2008.
[21] A. Izatulina, V. Gurzhiy, O. Frank-Kamenetskaya, Am. Miner. 2014, 99, 2– 7.
[22] C. Conti, L. Brambilla, C. Colombo, D. Dellasega, G. D. Gatta, M. Realini, G. Zerbi, Phys. Chem. Chem. Phys. 2010, 12, 14560–14566.
[23] G. L. Gardner, J. Cryst. Growth 1975, 30, 158–168.
[24] aR. Basso, G. Lucchetti, L. Zefiro, A. Palenzona, Neues Jahrb. Mineral.,
Monatsh. 1997, 84–96; bR. F. Martin, W. H. Blackburn, Can. Miner. 1999, 37, 1045–1078.
[25] S. Deganello, A. R. Kampf, P. B. Moore, Am. Miner. 1981, 66, 859–865. [26] L. Walterlevy, J. Laniepce, C. R. Hebd. Seances Acad. Sci. 1962, 254, 296-&. [27] a) B. Tomazic, G. H. Nancollas, J. Cryst. Growth 1979, 46, 355–361; b) B. B.
Tomazic, G. H. Nancollas, Invest. Urol. 1980, 18, 97–101.
[28] a) B. Xie, T. J. Halter, B. M. Borah, G. H. Nancollas, Cryst. Growth Des.
2015, 15, 204–211; b) M. Hajir, R. Graf, W. Tremel, Chem. Comm. 2014,
50, 6534–6536.
[29] M. Daudon, R. J. Reveillaud, P. Jungers, Lancet 1985, 1, 1338–1338. [30] W. Heijnen, W. Jellinghaus, W. E. Klee, Urol. Res. 1985, 13, 281–283. [31] M. Daudon, in Lithiase Urinaire (Eds.: P. Jungers, M. Daudon, A. Le Duc),
Flammarion Médecine-Sciences, Paris, France, 1989, pp. 158–195. [32] T. A. Shippey, J. Molec. Struct. 1980, 63, 157–166.
[33] I. Petrov, B. Soptrajanov, Spectrochim. Acta Part a 1975, A 31, 309–316. [34] C. Conti, M. Casati, C. Colombo, M. Realini, L. Brambilla, G. Zerbi,
Spectrochim. Acta Part a 2014, 128, 413–419.
[35] C. Conti, M. Casati, C. Colombo, E. Possenti, M. Realini, G. D. Gatta, M. Merlini, L. Brambilla, G. Zerbi, Spectrochim.Acta Part a 2015, 150, 721– 730.
[36] a) J. M. Ouyang, L. Duan, B. Tieke, Langmuir 2003, 19, 8980–8985; b) L. Maurice-Estepa, P. Levillain, B. Lacour, M. Daudon, Clin. Chim. Acta 2000,
298, 1–11.
[37] J. Tonannavar, G. Deshpande, J. Yenagi, S. B. Patil, N. A. Patil, B. G. Mulimani, Spectrochim. Acta Part a 2016, 154, 20–26.
[38] R. L. Frost, Anal. Chim. Acta 2004, 517, 207–214.
[39] a) V. Mohacek-Grosev, J. Grdadolnik, J. Stare, D. Hadzi, J. Raman
Spectrosc. 2009, 40, 1605–1614; b) Y. Ebisuzaki, S. M. Angel, J. Raman Spectrosc. 1981, 11, 306–311.
Table 1. Experimental and calculated unit cell parameters for the three calcium oxalate polyhydrates, COM, COD, and COT. Distances in Å, and angles in
degrees.
Unit cell parameter Experimental PBE D2 PBE D3
COM[17] COD[11] COT[24a] COM COD COT COM COD COT
6.32 12.37 6.01 6.31 12.43 6.13 6.36 12.64 6.20 14.54 12.37 7.15 14.58 12.42 7.10 14.84 12.62 7.13 10.12 7.36 8.43 10.10 7.35 8.37 10.28 7.46 8.54 90.00 90.00 76.54 90.00 89.99 75.80 90.00 90.10 76.20 109.00 90.00 70.30 109.56 89.84 69.86 109.50 89.80 69.60 a b c α β γ 90.00 90.00 70.75 90.01 90.95 69.91 90.00 90.90 69.30
average deviation (%) of a,b,c from exp - - - 0.21 0.34 1.14 1.43 1.85 1.58
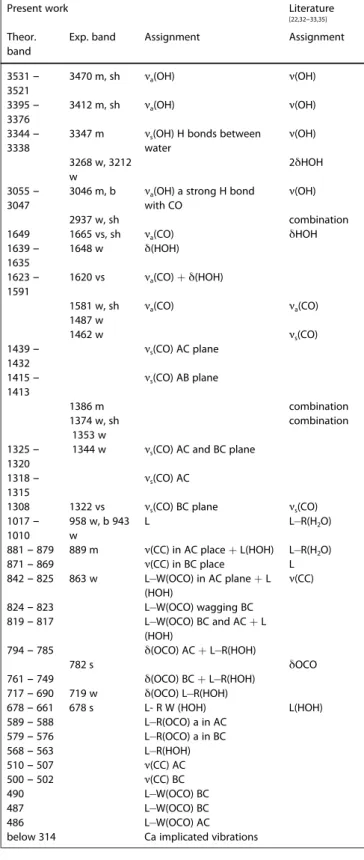
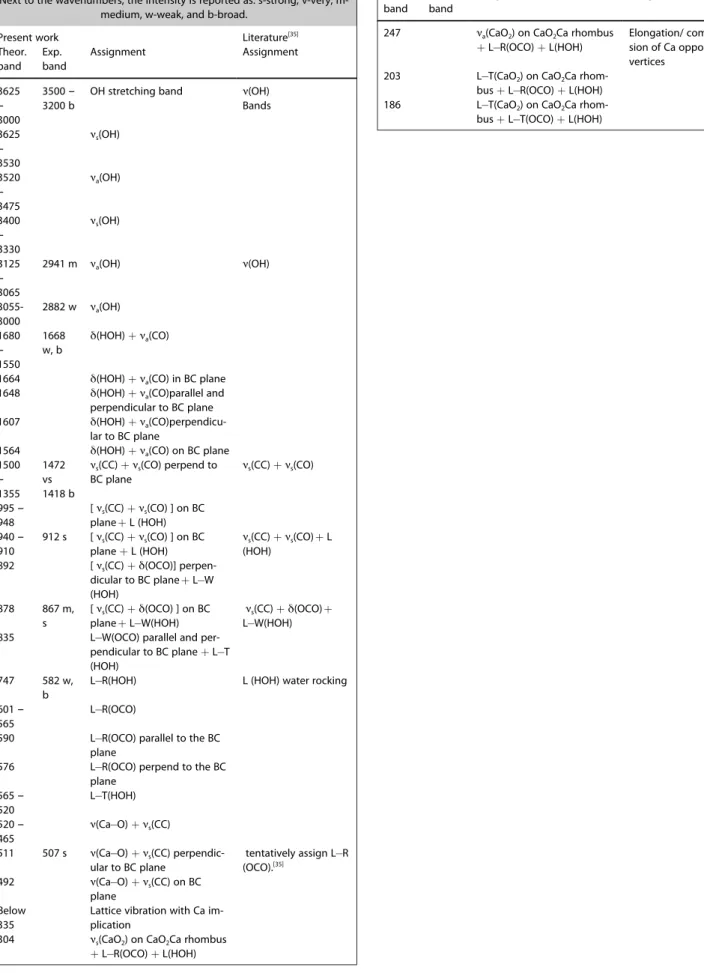
Table 2. PBE D2 calculated whewellite IR wavenumbers corresponding to
the different types of vibration (in cm1): a-antisymmetric, s-symmetric,
ν-stretching, δ-bending, L-libration, R-rocking, W-wagging, and T-twisting. Next to the wavenumbers the intensity is given by: s-strong, v-very,
m-medium, w-weak, b-broad, and sh-shoulder.
Present work Literature
[22,32–33,35]
Theor. band
Exp. band Assignment Assignment
3531 – 3521 3470 m, sh ν(OH) 3395 – 3376 3412 m, sh ν(OH) 3344 – 3338 3347 m ν(OH) 3268 w, 3212 w 2δHOH 3055 – 3047 3046 m, b ν(OH) 2937 w, sh combination 1649 1665 vs, sh δHOH 1639 – 1635 1648 w 1623 – 1591 1620 vs 1581 w, sh νa(CO) 1487 w 1462 w νs(CO) 1439 – 1432 1415 – 1413 1386 m combination 1374 w, sh combination 1353 w 1325 – 1320 1344 w 1318 – 1315 1308 1322 vs νs(CO) 1017 – 1010 958 w, b 943 w νa(OH) νa(OH)
νs(OH) H bonds between
water
νa(OH) a strong H bond
with CO νa(CO) δ(HOH) νa(CO) + δ(HOH) νa(CO) νs(CO) AC plane νs(CO) AB plane
νs(CO) AC and BC plane
νs(CO) AC νs(CO) BC plane L L R(H2O) 881 – 879 889 m L R(H2O) 871 – 869 L 842 – 825 863 w ν(CC) 824 – 823 819 – 817 794 – 785 ν(CC) in AC place + L(HOH) ν(CC) in BC place L W(OCO) in AC plane + L (HOH) L W(OCO) wagging BC L W(OCO) BC and AC + L (HOH) δ(OCO) AC + L R(HOH) 782 s δOCO 761 – 749 717 – 690 719 w 678 – 661 678 s L(HOH) 589 – 588 579 – 576 568 – 563 510 – 507 500 – 502 490 487 486 below 314 δ(OCO) BC + L R(HOH) δ(OCO) L R(HOH) L- R W (HOH) L R(OCO) a in AC L R(OCO) a in BC L R(HOH) ν(CC) AC ν(CC) BC L W(OCO) BC L W(OCO) BC L W(OCO) AC Ca implicated vibrations
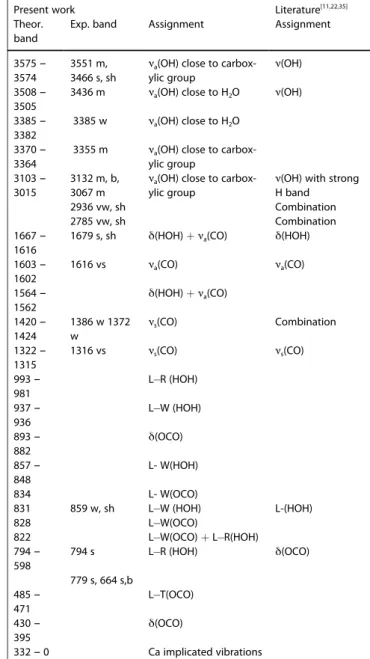
Table 3. PBE D2 calculated IR wavenumbers for the different weddellite
vibrational modes (in cm 1): a-antisymmetric, s-symmetric, ν-stretching,
δ-bending, L-libration, R-rocking, W-wagging, and T-twisting. Next to the wavenumbers the intensity is given by: s-strong, v-very, m-medium,
w-weak, b-broad, and sh-shoulder.
Present work Literature
[22,35–36]
Theor. band
Exp. band Assignment Assignment
3758 – 3719 3676 – 3644 3623 – 3614 3602 – 3452 3559-3257 m, vb ν(OH) 3442 – 3439 3426 3379 – 3249 3226 – 3054 2896 2939 vw, sh combination 2785 vw, sh combination 1686 – 1539 1640 vs νa(CO) 1475 w νs(CO) 1429 – 1304 1363 w, sh combination 1319 vs νs(CO) 1060 966 – 905 898 – 860 915 w 853 – 825 800 – 700 770 s, b δ(OCO) 700 – 620 630 m,sh 607 – 568 549 – 521 516 – 400 Below 400 νa(OH) νa,s(OH)
νa(OH) (close to carboxylic
group)
νa(OH) (close to water)
νs(OH)
νa(OH) (close to water)
νa(OH) (close to carboxylic
group)
νa(OH) (close to water)
νa(OH) (with strong
H-bond) νa(CO) νs(CO) L T (HOH) L (HOH) νs(CO) + L(H2O) L W(OCO) + L(HOH) δ(OCO) + L(HOH) L(HOH) L R(OCO) + L(HOH) L R(HOH) L W(OCO) + L(OHO) Ca implicated vibrations
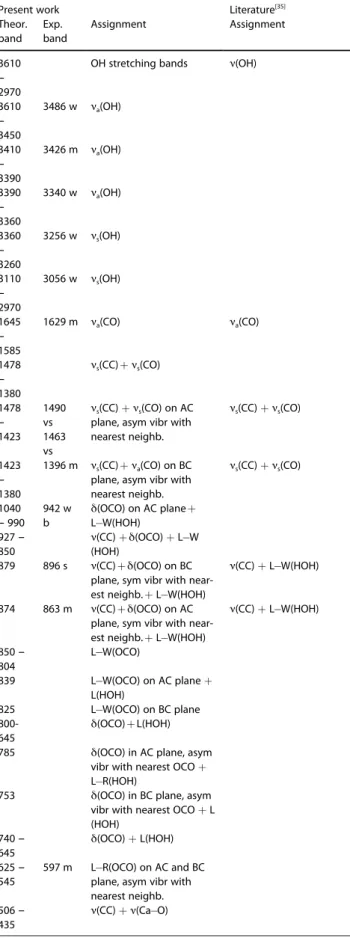
Table 4. PBE D2 calculated caoxite IR wavenumbers corresponding to the
different types of vibration (in cm1): a-antisymmetric, s-symmetric,
ν-stretching, δ-bending, L-libration, R-rocking, W-wagging, and T-twisting. Next to the wavenumbers the intensity is described as: s-strong, v-very,
m-medium, w-weak, b-broad, and sh-shoulder.
Present work Literature[11,22,35]
Theor. band
Exp. band Assignment Assignment
3575 – 3574 3551 m, 3466 s, sh ν(OH) 3508 – 3505 3436 m ν(OH) 3385 – 3382 3385 w 3370 – 3364 3355 m 3103 – 3015 3132 m, b, 3067 m
ν(OH) with strong H band 2936 vw, sh Combination 2785 vw, sh Combination 1667 – 1616 1679 s, sh δ(HOH) 1603 – 1602 1616 vs νa(CO) 1564 – 1562 1420 – 1424 1386 w 1372 w Combination 1322 – 1315 1316 vs νs(CO) 993 – 981 937 – 936 893 – 882 857 – 848 834 831 859 w, sh L-(HOH) 828 822 794 – 598 794 s δ(OCO) 779 s, 664 s,b 485 – 471 430 – 395 332 – 0
νa(OH) close to
carbox-ylic group νa(OH) close to H2O
νa(OH) close to H2O
νa(OH) close to
carbox-ylic group
νa(OH) close to
carbox-ylic group δ(HOH) + νa(CO) νa(CO) δ(HOH) + νa(CO) νs(CO) νs(CO) L R (HOH) L W (HOH) δ(OCO) L- W(HOH) L- W(OCO) L W (HOH) L W(OCO) L W(OCO) + L R(HOH) L R (HOH) L T(OCO) δ(OCO) Ca implicated vibrations
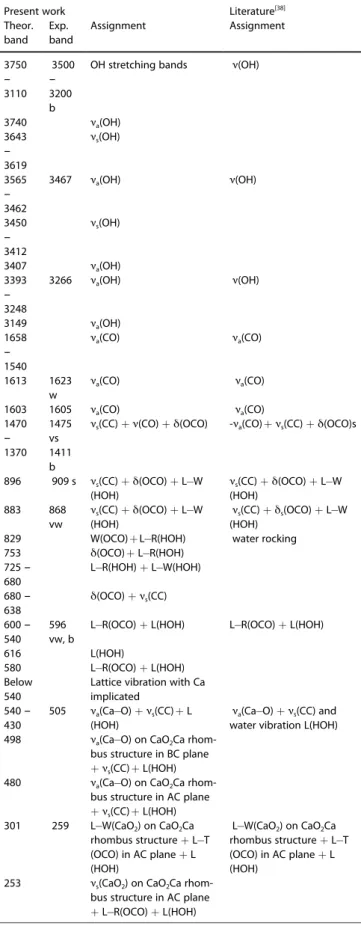
Table 5. PBE D3 calculated whewellite Raman modes wavenumbers (in
cm1) and assignment with the type of vibration: a-antisymmetric,
s-symmetric, ν-stretching, δ-bending, L-libration, R-Rocking, W-wagging, and T-Twisting. The measured mode wavenumbers are reported as: s-strong,
v-very, m-medium, w-weak, and b-broad.
Present work Literature[35]
Theor. band Exp. band Assignment Assignment 3610 – 2970
OH stretching bands ν(OH)
3610 – 3450 3486 w νa(OH) 3410 – 3390 3426 m νa(OH) 3390 – 3360 3340 w νa(OH) 3360 – 3260 3256 w νs(OH) 3110 – 2970 3056 w νs(OH) 1645 – 1585 1629 m νa(CO) νa(CO) 1478 – 1380 νs(CC) + νs(CO) 1478 – 1423 1490 vs νs(CC) + νs(CO) on AC
plane, asym vibr with nearest neighb. νs(CC) + νs(CO) 1463 vs 1423 – 1380 1396 m νs(CC) + νs(CO) 1040 – 990 942 w b 927 – 850 879 896 s νs(CC) + νa(CO) on BC
plane, asym vibr with nearest neighb. δ(OCO) on AC plane + L W(HOH) ν(CC) + δ(OCO) + L W (HOH) ν(CC) + δ(OCO) on BC plane, sym vibr with near-est neighb. + L W(HOH)
ν(CC) + L W(HOH)
874 863 m ν(CC) + L W(HOH)
850 – 804
ν(CC) + δ(OCO) on AC plane, sym vibr with near-est neighb. + L W(HOH) L W(OCO) 839 825 800-645 785 753 740 – 645 L W(OCO) on AC plane + L(HOH) L W(OCO) on BC plane δ(OCO) + L(HOH) δ(OCO) in AC plane, asym vibr with nearest OCO + L R(HOH)
δ(OCO) in BC plane, asym vibr with nearest OCO + L (HOH) δ(OCO) + L(HOH) 625 – 545 597 m 506 – 435 L R(OCO) on AC and BC plane, asym vibr with nearest neighb. ν(CC) + ν(Ca O)
Table 5. continued
Present work Literature[35]
Theor. band Exp. band Assignment Assignment 506 522 m 490 503 s below 326 292 ν(CC) + ν(Ca O) in AC plane ν(CC) + ν(Ca O) in BC plane
Lattice vibration in which Ca is implicated νs(CaO2) on CaO2Ca
rhom-bus structure in AC plane
256 Elongation/ compression of Ca opposite vertices on CaO2Ca rhombus structure + L(HOH) 224 205 +L(HOH)
νs(CaO2) on CaO2Ca
rhom-bus structure in AC and BC plane
νs(CaO2) on CaO2Ca
rhom-bus structure in BC plane T(CaO2) on CaO2Ca
Table 6. continued
Present work Literature[38]
Theor. band Exp. band Assignment Assignment 228 220 210 188
νs(CaO2) on CaO2Ca
rhom-bus structure in BC plane +L R(OCO) + L(HOH) L T(CaO2) on CaO2Ca rhombus structure in BC plane + L T(OCO) + L (HOH) Elongation/ compression of Ca opposite vertices on CaO2Ca rhombus structure
+Oxalate and water vibra-tions
L W(CaO2) on CaO2Ca
rhombus structure in BC plane + L T(OCO) + L (HOH)
Table 6. PBE D3 calculated weddellite Raman wavenumbers
correspond-ing to the different types of vibration (in cm1): a-antisymmetric,
s-symmetric, ν-stretching, δ-bending, L-libration, R-rocking, W-wagging, and T-twisting. For some signals, the intensity is reported next to the wavenumbers as: s-strong, v-very, m-medium, w-weak, and b-broad.
Present work Literature[38]
Theor. band Exp. band Assignment Assignment 3750 – 3110 3500 – 3200 b
OH stretching bands ν(OH)
3740 νa(OH) 3643 – 3619 νs(OH) 3565 – 3462 3467 νa(OH) ν(OH) 3450 – 3412 νs(OH) 3407 νa(OH) 3393 – 3248 3266 νa(OH) ν(OH) 3149 νa(OH) 1658 – 1540 νa(CO) νa(CO) 1613 1623 w νa(CO) 1603 νa(CO) 1470 – 1370 1605 1475 νs(CC) + ν(CO) + δ(OCO) 896 vs 1411 b 909 s νs(CC) + δ(OCO) + L W 883 868 vw 829 753 725 – 680 680 – 638 600 – 540 596 vw, b 616 580 Below 540 540 – 430 505 498 (HOH) νs(CC) + δ(OCO) + L W (HOH) W(OCO) + L R(HOH) δ(OCO) + L R(HOH) L R(HOH) + L W(HOH) δ(OCO) + νs(CC) L R(OCO) + L(HOH) L(HOH) L R(OCO) + L(HOH) Lattice vibration with Ca implicated
νa(Ca O) + νs(CC) + L
(HOH)
νa(Ca O) on CaO2Ca
rhom-bus structure in BC plane 480
+νs(CC) + L(HOH)
νa(Ca O) on CaO2Ca
rhom-bus structure in AC plane +νs(CC) + L(HOH) 301 259 νa(CO) νa(CO) -νa(CO) + νs(CC) + δ(OCO)s νs(CC) + δ(OCO) + L W (HOH) νs(CC) + δs(OCO) + L W (HOH) water rocking L R(OCO) + L(HOH) νa(Ca O) + νs(CC) and
water vibration L(HOH)
L W(CaO2) on CaO2Ca rhombus structure + L T (OCO) in AC plane + L (HOH) 253 L W(CaO2) on CaO2Ca rhombus structure + L T (OCO) in AC plane + L (HOH)
νs(CaO2) on CaO2Ca
rhom-bus structure in AC plane +L R(OCO) + L(HOH)
Table 7. continued
Present work Literature[35]
Theor. band Exp. band Assignment Assignment 247 Elongation/ compres-sion of Ca opposite vertices 203 186
νa(CaO2) on CaO2Ca rhombus
+L R(OCO) + L(HOH) L T(CaO2) on CaO2Ca
rhom-bus + L R(OCO) + L(HOH) L T(CaO2) on CaO2Ca
rhom-bus + L T(OCO) + L(HOH)
Table 7. PBE D3 calculated caoxite Raman wavenumbers corresponding to
the different types of vibration (in cm1): a-antisymmetric, s-symmetric,
ν-stretching, δ-bending, L-libration, R-rocking, W-wagging, and T-twisting. Next to the wavenumbers, the intensity is reported as: s-strong, v-very,
m-medium, w-weak, and b-broad.
Present work Literature[35]
Theor. band Exp. band Assignment Assignment 3625 – 3000 3500 – 3200 b
OH stretching band ν(OH) Bands 3625 – 3530 νs(OH) 3520 – 3475 νa(OH) 3400 – 3330 νs(OH) 3125 – 3065 2941 m νa(OH) ν(OH) 3055-3000 2882 w νa(OH) 1680 – 1550 1668 w, b 1664 1648 1607 1564 1500 – 1355 1472 vs 1418 b νs(CC) + νs(CO) 995 – 948 940 – 910 912 s νs(CC) + νs(CO) + L (HOH) 892 878 867 m, s νs(CC) + δ(OCO) + L W(HOH) 835 747 582 w, b
L (HOH) water rocking 601 – 565 590 576 565 – 520 520 – 465 511 507 s tentatively assign L R (OCO).[35] 492 Below 335 304 δ(HOH) + νa(CO)
δ(HOH) + νa(CO) in BC plane
δ(HOH) + νa(CO)parallel and
perpendicular to BC plane δ(HOH) + νa
(CO)perpendicu-lar to BC plane
δ(HOH) + νa(CO) on BC plane
νs(CC) + νs(CO) perpend to BC plane [ νs(CC) + νs(CO) ] on BC plane + L (HOH) [ νs(CC) + νs(CO) ] on BC plane + L (HOH) [ νs(CC) + δ(OCO)] perpen-dicular to BC plane + L W (HOH) [ νs(CC) + δ(OCO) ] on BC plane + L W(HOH) L W(OCO) parallel and per-pendicular to BC plane + L T (HOH)
L R(HOH) L R(OCO)
L R(OCO) parallel to the BC plane
L R(OCO) perpend to the BC plane L T(HOH) ν(Ca O) + νs(CC) ν(Ca O) + νs(CC) perpendic-ular to BC plane ν(Ca O) + νs(CC) on BC plane
Lattice vibration with Ca im-plication
νs(CaO2) on CaO2Ca rhombus
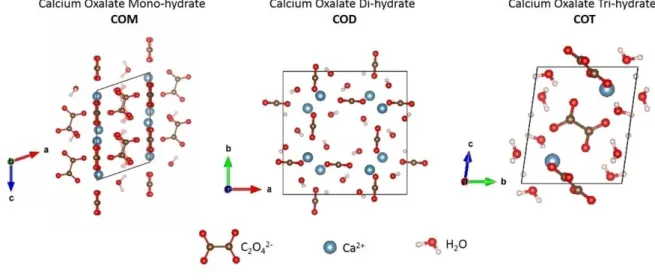
Figure 1. Unit cells of the three calcium oxalate polyhydrates, whewellite (COM), weddellite (COD), and caoxite (COT). The zeolitic water in the COD structure is
not shown for clarity.
Figure 2. Experimental (gray) and calculated (green) IR spectra for the three calcium oxalate polyhydrates between: 500 and 4000 cm1for the theoretical
spectrum and between: 600 et 4000 cm1for the experimental one. From left to right: total spectra, spectra between: 3800–2500 cm 1and spectra between:
1900–500 cm1).
Figure 3. Calculated COD IR-spectra for unit cells with 0–8 extra water
molecules (x = 0 to 1) and different configuration of zeolitic water molecules within the crystal, compared with the experimental IR spectrum at 4 K.
Figure 6. Corresponding CaO2Ca rhombus structure for COT as discussed in
Table 7.
Figure 4. Experimental (gray) and calculated (green) Raman spectra for the three calcium oxalate polyhydrates obtained between 4000 and 400 cm 1. Three
spectra regions are shown when possible for comparison. From left to right: between 3600–3000 cm 1, 1700–1300 cm1and 1000–400 cm1.
Figure 5. The corresponding CaO2Ca rhombus structures in AC plane (yellow)
and BC plane (green) for (a) COM and (b) COD.
Figure 7. Low wavenumber region: comparison between the theoretical
Figure 9. Comparison between the theoretical and experimental Raman spectrum of dihydrate oxalic acid.
Figure 8. Oxalate vibrations observed at low wavenumbers region (+ increase