HAL Id: hal-02922302
https://hal.archives-ouvertes.fr/hal-02922302
Submitted on 16 Sep 2020
HAL is a multi-disciplinary open access
archive for the deposit and dissemination of
sci-entific research documents, whether they are
pub-lished or not. The documents may come from
teaching and research institutions in France or
abroad, or from public or private research centers.
L’archive ouverte pluridisciplinaire HAL, est
destinée au dépôt et à la diffusion de documents
scientifiques de niveau recherche, publiés ou non,
émanant des établissements d’enseignement et de
recherche français ou étrangers, des laboratoires
publics ou privés.
Distributed under a Creative Commons Attribution| 4.0 International License
Global land carbon sink response to temperature and
precipitation varies with ENSO phase
Yuanyuan Fang, Anna Michalak, Christopher Schwalm, Deborah Huntzinger,
Joseph Berry, Philippe Ciais, Shilong Piao, Benjamin Poulter, Joshua Fisher,
Robert Cook, et al.
To cite this version:
Yuanyuan Fang, Anna Michalak, Christopher Schwalm, Deborah Huntzinger, Joseph Berry, et al..
Global land carbon sink response to temperature and precipitation varies with ENSO phase.
Envi-ronmental Research Letters, IOP Publishing, 2017, 12 (6), pp.064007. �10.1088/1748-9326/aa6e8e�.
�hal-02922302�
LETTER • OPEN ACCESS
Global land carbon sink response to temperature
and precipitation varies with ENSO phase
To cite this article: Yuanyuan Fang et al 2017 Environ. Res. Lett. 12 064007
View the article online for updates and enhancements.
Related content
Benchmarking carbon fluxes of the ISIMIP2a biome models
Jinfeng Chang, Philippe Ciais, Xuhui Wang et al.
-Forests dominate the interannual variability of the North American carbon sink
Yoichi P Shiga, Anna M Michalak, Yuanyuan Fang et al.
-Enhanced response of global wetland methane emissions to the 2015–2016 El Niño-Southern Oscillation event
Zhen Zhang, Niklaus E Zimmermann, Leonardo Calle et al.
-Recent citations
Sensitivity of remote sensing-based vegetation proxies to climate and sea surface temperature variabilities in Australia and parts of Southeast Asia
Sanjiwana Arjasakusuma et al
-Plant species and season influence soil physicochemical properties and microbial function in a semi-arid woodland ecosystem
Parasto Eslaminejad et al
-Effects of Anthropogenic Activity on Global Terrestrial Gross Primary Production
Irina Melnikova and Takahiro Sasai
LETTER
Global land carbon sink response to temperature and
precipitation varies with ENSO phase
Yuanyuan Fang1,19, Anna M Michalak1, Christopher R Schwalm2, Deborah N Huntzinger3, Joseph A Berry1, Philippe Ciais4, Shilong Piao5, Benjamin Poulter6, Joshua B Fisher7, Robert B Cook8, Daniel Hayes9, Maoyi Huang10, Akihiko Ito11, Atul Jain12, Huimin Lei13, Chaoqun Lu14, Jiafu Mao8, Nicholas C Parazoo7, Shushi Peng15, Daniel M Ricciuto8, Xiaoying Shi8, Bo Tao16, Hanqin Tian17, Weile Wang18, Yaxing Wei8 and Jia Yang17
1 Department of Global Ecology, Carnegie Institution for Science, Stanford, CA, United States of America 2 Woods Hole Research Center, Falmouth, MA 02540, United States of America
3 School of Earth Sciences and Environmental Sustainability, Northern Arizona University, P.O. Box 5694, Flagstaff, AZ 86011-5694, United States of America
4 Laboratoire des Sciences du Climat et de l’Environnement, IPSL-LSCE CEA CNRS UVSQ, 91191 Gif sur Yvette, France 5 Department of Ecology, College of Urban and Environmental Science, Peking University, Beijing, 100871, People’s Republic of
China
6 Department of Ecology, Montana State University, Bozeman, MT, United States of America
7 Jet Propulsion Laboratory, California Institute of Technology, Pasadena, CA, United States of America
8 Environmental Sciences Division and Climate Change Science Institute, Oak Ridge National Laboratory, Oak Ridge, TN, 37831, United States of America
9 School of Forest Resources, University of Maine, Orno, ME, United States of America
10Atmospheric and Global Change Division, Pacific Northwest National Laboratory, Richland, WA, United States of America 11National Institute for Environmental Studies, Tsukuba, Japan
12Department of Atmospheric Sciences, University of Illinois at Urbana-Champaign, Urbana, IL, United States of America 13State Key Laboratory of Hydroscience and Engineering, Department of Hydraulic Engineering, Tsinghua University, Beijing,
People’s Republic of China
14Department of Ecology, Evolution, and Organismal Biology, Iowa State University, Ames, IA 50011, United States of America 15Sino-French Institute for Earth System Science, College of Urban and Environmental Sciences, Peking University, Beijing 100871,
People’s Republic of China
16Department of Plant and Soil Sciences, College of Agriculture, Food, and Environment, University of Kentucky, Lexington, KY, United States of America
17International Center for Climate and Global Change Research and School of Forestry and Wildlife Sciences, Auburn University, Auburn, AL, United States of America
18Ames Research Center, National Aeronautics and Space Administration, Moffett Field, CA, United States of America 19Author to whom any correspondence should be addressed.
E-mail:yyfang@carnegiescience.edu
Keywords: climate-carbon feedback, tropical ecosystems, temperature, precipitation, El Niño-Southern Oscillation (ENSO) Supplementary material for this article is availableonline
Abstract
Climate variability associated with the El Niño-Southern Oscillation (ENSO) and its consequent
impacts on land carbon sink interannual variability have been used as a basis for investigating
carbon cycle responses to climate variability more broadly, and to inform the sensitivity of the
tropical carbon budget to climate change. Past studies have presented opposing views about
whether temperature or precipitation is the primary factor driving the response of the land
carbon sink to ENSO. Here, we show that the dominant driver varies with ENSO phase. Whereas
tropical temperature explains sink dynamics following El Niño conditions (r
TG,P¼ 0.59, p < 0.01),
the post La Niña sink is driven largely by tropical precipitation (r
PG,T¼ −0.46, p ¼ 0.04). This
finding points to an ENSO-phase-dependent interplay between water availability and temperature
in controlling the carbon uptake response to climate variations in tropical ecosystems. We further
find that none of a suite of ten contemporary terrestrial biosphere models captures these
ENSO-phase-dependent responses, highlighting a key uncertainty in modeling climate impacts on the
future of the global land carbon sink.
OPEN ACCESS RECEIVED
9 December 2016
REVISED
17 April 2017
ACCEPTED FOR PUBLICATION
21 April 2017
PUBLISHED
1 June 2017
Original content from this work may be used under the terms of the
Creative Commons Attribution 3.0 licence. Any further distribution of this work must maintain attribution to the author(s) and the title of the work, journal citation and DOI.
Environ. Res. Lett. 12 (2017) 064007 https://doi.org/10.1088/1748-9326/aa6e8e
Introduction
Any decrease in the global land carbon sink acts to exacerbate future climate change, but the actual impact of climate change on carbon dynamics remains highly uncertain (Ciais et al 2014, Cox et al 2000, Friedlingstein et al 2006, Friedlingstein et al 2014). Climate variability associated with the El Niño-Southern Oscillation (ENSO) and the consequent impacts on land carbon sink interannual variability have been used to investigate carbon cycle responses to climate variability, and to inform the sensitivity of the tropical carbon budget to climate change (Cox et al
2000, Cox et al2013, Gurney et al2012, Wenzel et al
2014). Past studies have argued that temperature drives ENSO impacts on carbon dynamics (Braswell et al1997, Clark et al2003, Cox et al2013, Jung et al
2017, Kindermann et al1996, Wang et al2013, Wang et al2014) and that the relationship to precipitation is relatively weak (Clark et al 2003, Wang et al 2013, Wang et al 2014). For instance, recent studies show that the correlation between the interannual variation of the atmospheric CO2 growth rate (AGR,
deter-mined by long-term atmospheric CO2measurements
and driven mainly by global land sink) and tempera-ture is substantially higher (r ranges from 0.5 to 0.7 depending on the estimating methods) than that between AGR and precipitation (r< 0.2) (Wang et al
2013, Wang et al 2014). The strong temperature response was found to be largely driven by tropical ecosystems (Cox et al2013, Wang et al2013, Wang et al2014). Building on this conclusion, studies have further developed a simple emergent constraint on the climate response of the global land sink by using the observation-based sensitivity of the global land carbon sink to interannual tropical temperature variations (Cox et al 2013, Friedlingstein et al 2006). Other studies, and especially modeling studies, have instead pointed to precipitation and moisture availability as key drivers (Qian et al2011, Tian et al1998, Zeng et al
2005). In addition, tropical droughts (including major droughts in the Amazon) have also been shown to drive the interannual variability of the global land sink (Gatti et al2014, Hilker et al2014). These opposing views lead to fundamentally different interpretations of how climate change and the associated changes in temperature, precipitation, and ENSO dynamics will impact the global land carbon sink. Furthermore, a recent study (Wang et al 2014) found that the temperature sensitivity of tropical ecosystem has increased over the last five decades, and may be modulated by the moisture conditions, implying that interactions between heat and moisture may be important.
Here, we examine how different climate modes, as exemplified by the phase of the El Niño-Southern Oscillation, and their corresponding prevailing climate conditions affect the sensitivity of the global land carbon sink to temperature and precipitation. To do
so, we analyze the response of the global land sink to temperature and precipitation following contrasting phases of ENSO. Because heat and moisture con-ditions differ across ENSO phases, the analysis provides a test case for studying the influence of contrasting climate conditions. Our method is primarily diagnostic, with the aim being to observe responses across different prevailing climate condi-tions. Although we present high-level hypotheses about driving mechanisms, this study is not intended to replace the need for further attribution studies to deepen process-based understanding. We further use this approach as a new benchmark to evaluate the ability of ten state-of-the-art mechanistic models of terrestrial carbon fluxes to represent the observed sensitivities to climate variations.
Data and Method
Tropical ecosystems have been shown to be the main driver of the land carbon sink response to ENSO (Cox et al2013, Wang et al2013, Wang et al2014, Zeng et al
2005). Hence, we focus here on the correlations between annual atmospheric growth rate of CO2
(AGR) and tropical (30°S to 30°N) land mean annual temperature (TMAT) and precipitation (TMAP), for the years 1959–2010, to identify key features of the ENSO response. The time series of AGR, TMAT and TMAP are detrended before used for the correlation analyses. Normalized detrended time series of these three variables are shown infigure S1 (stacks.iop.org/ ERL/12/064007/mmedia) to illustrate interannual-scale variations. To explore the influence of ENSO on the relationship between the terrestrial carbon sink and environmental drivers, we categorize years as El Niño or La Niña based on the Niño 3.4 index from NOAA’s Climate Prediction Center (CPC), and analyze correlations to drivers for years immediately following El Niño/La Niña years as well as for all years. In doing so, we examine contrasts in response between post El Niño versus post La Niña conditions. We also analyze the correlations based on global land sink as simulated by an ensemble of terrestrial biosphere models participating in the Multi-scale Synthesis and Terrestrial Model Intercomparison Project, MsTMIP (Huntzinger et al2013, Wei et al2014b), in order to assess model capabilities in capturing the ENSO-dependence of responses.
Atmospheric CO2growth rate (AGR)
We use the annual atmospheric CO2 growth rate to
explore the impact of ENSO, consistently with previous studies (Cox et al 2013, Wang et al 2013, Wang et al2014, Wenzel et al 2014). Specifically, we use AGR provided to Global Carbon Project (GCP) (Le Quéré et al2015) by the US National Oceanic and Atmospheric Administration Earth System Research Laboratory (NOAA/ESRL). NOAA/ESRL estimates
the growth rate of CO2for a given calendar year as the
difference in concentration between the average of the most recent November–February months and the same four-month average of the previous year (Ballantyne et al 2012). Their 1959–1980 AGR is
based on Mauna Loa and South Pole stations as observed by the CO2Program at Scripps Institution of
Oceanography (SIO), while their 1980–2012 global averages are estimated from multiple stations by NOAA/ESRL (Ballantyne et al 2012). We further detrended this AGR time series to obtain the interannual signals in global carbon budget (figure S1). The use of November to February for estimating the AGR response to ENSO is preferable for separating the impacts of different ENSO events to using other months closer to the middle of the year (e.g. May, June etc) because ENSO events typically peak during the winter season.
We test whether our results are sensitive to the specific definition of AGR described above by calculating alternate detrended AGR time series using atmospheric CO2 data collected at Mauna Loa
(NOAA/ESRL) (Ballantyne et al 2012) and at South Pole (SIO) (Keeling et al 2005), and basing the calculation on single-month differences of consecutive Januaries and Februaries. We find that conclusions are robust to the specific definition of AGR used in the analysis (see Results and Discussion).
ENSO index and ENSO event classification
We mainly use ERSSTv4 seasonal Niño 3.4 index from the NOAA Climate Prediction Center (CPC) to represent the intensity of ENSO phenomena. Such index is chosen because it is most responsive to tropical temperature and precipitation. This index is estimated as the 3-month running average of monthly Niño 3.4 index anomalies using 1981–2010 as the base time period. El Niño (La Niña) events are defined as this CPC Niño 3.4 index greater (smaller) than 0.5 (−0.5) for at least five consecutive overlapping seasons, i.e. at leastfive consecutive 3-monthly running mean of Niño 3.4 index above (below) 0.5 (−0.5) (Kousky and Higgins,2007, Larkin and Harrison,2005).
As AGR in a current year starts to be significantly correlated with Niño 3.4 index as early as the second half of its prior year (see Results and Discussion), we further define ENSO year as a year with at least 3 seasons centered in the second half of the year being in an El Niño (La Niña) event and the year immediately after this El Niño (La Niña) year as post El Niño (La Niña) year. We consider 1991 and 1992 as neither post El Niño nor post La Niña years due to the significantly different dynamics following the Pinatubo eruption (Cox et al2013, Wang et al2013); however, we find that excluding these two years in that analysis does not impact results. We alsofind that the classification of ENSO events/years is largely consistent if using other ENSO indices (e.g. Multivariate ENSO Index, MEI, from NOAA/ESRL/PSD) (Wolter and Timlin, 1993,
Wolter and Timlin, 1998). When any inconsistency occurs, i.e. a year identified as ENSO year by one index, but not by the other index (four such years were found), we tend to be more inclusive and define those years as ENSO years. For example, while 1992 and 1993 are not identified as El Niño years based Niño 3.4, they are defined so using MEI index and thus considered as El Niño years. Overall, among the 52 examined years, we identify 19 El Niño and 21 La Niña years and the partial correlations discussed in the analysis are based on the years immediately following these El Niño and La Niña years (as labelled on figure S1). Finally, the response of AGR to ENSO and our main results are not affected by the choice of ENSO index (e.g. MEI, see Results and Discussion).
Climatic drivers (TMAT and TMAP)
We use monthly precipitation and surface air temperature data at 0.5° resolution from the Climatic Research Unit-National Centers for Environmental Prediction (CRU-NCEP) (Huntzinger et al2013, Wei et al2014a, Wei et al2014b). Those gridded monthly data are aggregated temporally from January to December to gridded annual data for a given calendar year. Annual mean tropical surface air temperature and precipitation time series are aggregated over land surface area between latitudes 30°N and 30°S to Tropical Mean Annual Temperature (TMAT) and Tropical Mean Annual Precipitation (TMAP). The time series of TMAT and TMAP are detrended for signals at the interannual scale (figure S1). This approach is comparable to those used in earlier studies (Cox et al 2013, Wang et al 2013, Wang et al2014, Wenzel et al2014). We choose the CRU-NCEP data set not only because it has been applied in a number of earlier studies on ENSO responses of global land carbon cycle (Piao et al2014, Wang et al2013, Wang et al 2014), but also because this dataset is used as driver data input for all the MsTMIP terrestrial biosphere models analyzed in this study (Huntzinger et al 2013, Wei et al 2014b). We also test alternate datasets (e.g. precipitation data from the Global Precipitation Climatology Centre, GPCC (Schneider et al 2015, Schneider et al 2013), temperature data from NCEP Reanalysis data provided by the NOAA/ OAR/ESRL PSD (http://www.esrl.noaa.gov/psd/) giv-en the previously noted differgiv-ences in reanalysis products (Trenberth et al 2015), and find our conclusions to be robust to the choice of precipitation and temperature dataset.
Terrestrial biosphere models
We use monthly carbon fluxes (including Net Ecosystem Exchange—NEE, Gross Primary Produc-tion—GPP and total Ecosystem Respiration—TRE) during 1959–2010 as simulated from ten global terrestrial biosphere models (TBMs) participating the MsTMIP project (Huntzinger et al2013, Wei et al
2014b). Those models (table S1) are driven by a
Environ. Res. Lett. 12 (2017) 064007
standard protocol, including environmental drivers in climate, atmospheric CO2, biome map, nitrogen
deposition, soil conditions, land use change and phenology (Wei et al2014b). Those gridded monthly carbon fluxes are first aggregated temporally to gridded annual carbon fluxes. Annual mean global carbon budget time series are aggregated spatially from the gridded annual carbonfluxes over all land surface area, while annual mean tropical carbon budget time series are aggregated spatially over all land surface area between 30° N and 30°S (Huntzinger et al
2014). The model output analyzed here is taken from the Version 1 release of the MsTMIP data (Huntzinger et al 2014, Huntzinger et al 2013). This dataset includes 15 models, 10 of which are used here. The CLASS-CTEM-N and TRIPLEX-GHG models are excluded due to the quality control issues. The SiB3 model is excluded to avoid possible issues in the continuity of its simulated annual global/tropical NEE time series, because it features unrealistic massive pulses of carbon release in January of 1959. The TEM model is excluded because it shows no response to ENSO, while the SiBCASA model is excluded because of its unrealistically large GPP, biomass stocks, and CO2fertilization effect. The 10 models used here are
also those used in other recent analyses based on MsTMIP data (Schwalm et al2015, Tian et al2015).
Statistical analysis
We estimate the partial correlation between AGR and TMAT while controlling for variability in TMAP (rTG,P) as well as the partial correlation between AGR
and TMAP while controlling for TMAT (rPG,T) (Brown
and Hendrix, 2014, Johnson and Wichern, 2007, Kutner et al 2004). We then convert those partial correlations to t test statistics and estimate their corresponding p values using a t distribution (Kutner et al2004, Stockburger,2001). The uncertainty ranges of those partial correlations (shown as whiskers in figure 1) are the 16th and 84th percentiles of the distribution (equivalent to one standard deviation confidence interval in the case of a symmetric distribution), estimated using Fisher’s r -to- z transfor-mation (Fisher,1915,1921, Johnson and Wichern,2007, Kutner et al2004). To test the statistical significance of
the difference between two correlation coefficients, we use the Fisher r -to- z transformation (Fisher, 1915,
1921) to obtain the corresponding p values.
The response of AGR to TMAT and of AGR to TMAP are estimated using multiple linear regression of AGR against TMAT and TMAP, and we denote the corresponding regression coefficients as bTG,P and
bPG,Trespectively. Their associated uncertainty ranges
are estimated as one standard deviation confidence interval of the regression coefficients (Kutner et al2004).
Post EI Niño Post La Niña All years
Atmospheric CO2 growth rate
Ensemble mean tropical NEE Individual model tropical NEE
Partial correlation with Tropical temperature (rTG,P)
Partial correlation with
T ropical precipitation ( rPG,T ) 0.2 0 -0.2 -0.4 -0.6 -0.8 -1 -0.2 0 0.2 0.4 0.6 0.8 1
Figure 1. The response of the annual atmospheric growth rate of CO2(AGR) to tropical mean annual temperature (TMAT) and precipitation (TMAP) differs by ENSO phase, and models do not capture this response under any ENSO conditions. Filled circles represent partial correlations between detrended anomalies of AGR and TMAT, and between detrended anomalies of AGR and TMAP. Whiskers represent uncertainties of correlations. Ellipses represents the one-standard deviation envelope for the distribution specified by the mean and covariance of the same partial correlations estimated using detrended annual tropical NEE as simulated by ten terrestrial biosphere models in place of AGR. Empty diamonds represent the mean correlations across these models, while full diamonds represent partial correlations derived using the ensemble average NEE across all models. In all cases, correlations are calculated over the period 1959–2010, with black representing all years, red indicating post El Niño, and blue indicating post La Niña. The pink, blue and grey shaded areas delineate the range for significant partial correlations (p < 0.05) for post El Niño (∣r∣ > 0.46), post La Niña ((∣r∣ > 0.44) and all year (∣r∣ > 0.28) cases using a two-tailed test.
Results and Discussion
The partial correlations between AGR and TMAT and between AGR and TMAP indicate that the response of the AGR to ENSO varies by ENSO phase (figure1). The AGR post El Niño is significantly and positively correlated to TMAT (rTG,P¼ 0.59, p < 0.01). This
response is similar to the average responses across all years identified both in this study (rTG,P¼ 0.54,
p< 0.01) and in earlier studies (Cox et al2013, Wang et al2013, Wang et al2014). Post La Niña, however, the coupling between TMAT and AGR disappears (rTG,P¼ −0.02, p ¼ 0.95). The post La Niña response
of AGR to TMAT (bTG,P¼ −0.1 ± 0.8 PgC yr−1K−1) is
not significantly different from zero and is significantly lower than for post El Niño (bTG,P¼ 3.1 ± 1.1 PgC yr−1
K−1) and for all years (bTG,P¼ 2.6 ± 0.5 PgC yr−1K−1).
Note that the result across all years obtained here is consistent with previous estimates (Cox et al 2013, Wenzel et al2014) if we account for the fact that these earlier studies used tropical land as well as ocean temperatures, yielding a higher regression coefficient (bTG,P¼ 4.1 ± 0.7 PgC yr−1K−1). On the other hand,
a negative correlation between AGR and TMAP that is weak across all years (rPG,T¼ −0.03, p ¼ 0.81,
bPG,T¼ − 0.01 ± 0.03 PgC yr−1(cm yr−1)−1) and post
El Niño (rPG,T¼ −0.29, p ¼ 0.24, bPG,T¼ − 0.05 ±
0.04 PgC yr−1 (cm yr−1)−1), becomes stronger and statistically significant (rPG,T¼ −0.46, p ¼ 0.04,
bPG,T¼ −0.11 ± 0.05 PgC yr−1 (cm yr−1)−1) post La
Niña.
This analysis implies substantial differences in carbon dynamics driving AGR interannual variability
dependent on ENSO phase. The post El Niño partial correlation between AGR and TMAT is significantly stronger than that post La Niña (p¼ 0.02), suggesting a robust shift in the response to temperature. Meanwhile, the significant partial correlation between AGR and TMAP post La Niña indicates that focusing on the AGR response across all ENSO conditions obscures the role of precipitation. Thesefindings are robust to the alternate approaches for calculating the AGR (see Data and Method,figure S2).
An analysis of the variability of fossil fuel emissions, land use and land cover change, oceanic uptake, andfire emissions indicates that the response of AGR to TMAT and TMAP is likely driven by terrestrial ecosystems (supplementary text 1). A lack of significant correlations between AGR and tempera-ture/precipitation in extra-tropical regions also further confirms the key role of tropical ecosystems (supple-mentary text 1). Additional sensitivity analyses also suggest that the observed responses of AGR to TMAT and TMAP are not driven by extreme events (supplementary text 2).
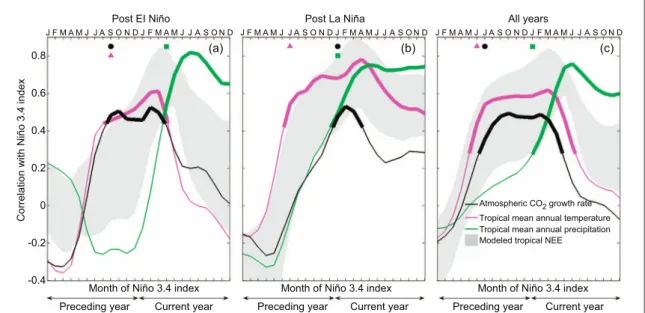
The timing of the AGR response to ENSO further supports the dependence of the tropical land carbon flux response on the phase of ENSO. The AGR for a given post El Niño year is significantly correlated to the Niño 3.4 index as far back as September of the preceding year, while a significant correlation only appears in January in post La Niña conditions (figure2
(a-b), black). This ENSO response of AGR reflects both the response of TMAT/TMAP to ENSO (figure2
(a-b)), magenta and green) and the response of AGR to TMAT and TMAP (figure1). The timing of these
Post EI Niño
Month of Niño 3.4 index Month of Niño 3.4 index Month of Niño 3.4 index
Post La Niña All years
Preceding year Current year Preceding year Current year Preceding year Current year
Atmospheric CO2 growth rate
Tropical mean annual temperature Tropical mean annual precipitation Modeled tropical NEE
J F M A M J J A S O N D J F M A M J J A S O N D J F M A M J J A S O N D J F M A M J J A S O N D J F M A M J J A S O N D J F M A M J J A S O N D (a) (b) (c) 0.8 0.6 0.4 0.2 0 -0.2 -0.4
Correlation with Niño 3.4 index
Figure 2. The timing of the correlation between AGR and the Niño 3.4 index mirrors that of TMAT post El Niño and of TMAP post La Niña. Subplots show the correlation coefficient between the Niño 3.4 index for a given month and detrended anomalies of AGR (black), TMAT (magenta), and TMAP (green, here reversed sign is plotted to reflect the negative correlation between TMAP and AGR). The three panels represent (a) post El Niño, (b) post La Niña and (c) all years during 1959–2010, respectively. Annual AGR, TMAT and TMAP are estimated over the year labeled‘Current year’ while the Niño 3.4 index, which varies month to month, is analyzed starting in January of the preceding year. The symbols at the top of the panels mark thefirst Niño 3.4 index month for which the correlations are statistically significant (p < 0.05), and the thicker portions of the solid lines mark the entire period over which correlations are significant. The shaded area presents the same information as the black lines, but substituting detrended annual tropical NEE for that of AGR, and showing an envelope across ten terrestrial biosphere models used in the analysis.
Environ. Res. Lett. 12 (2017) 064007
AGR correlations with the Niño 3.4 index is consistent with the timing of the correlations between TMAT/ TMAP and Niño 3.4, where TMAT post El Niño is significantly correlated to Niño 3.4 as far back as September of the previous year (figure2(a), magenta) while TMAP post La Niña is correlated to Niño 3.4 back starting in January (figure 2(b), green). More broadly, the timing of the correlation between AGR and the Niño 3.4 index (figure2(a-b), black) closely tracks that of temperature following El Niño conditions (figure 2(a), magenta), and precipitation following La Niña conditions (figure2(b), green). This result is again consistent with temperature playing a strong role in driving the carbon flux response following El Niño conditions, and precipitation being important in determining the response following La Niña conditions. Similar to what is seen infigure1, the aggregated response across all years masks the role of precipitation post La Niña, with the AGR response mirroring that of TMAT only (figure 2(c)). These findings are also robust to the choice of a different ENSO index (MEI) (see Data and Method,figure S3). We also estimate the partial correlations between AGR and local temperature, and between AGR and local precipitation, to identify regions that are likely to be driving the observed global relationships. Given that AGR represents a global average, however, this heuristic approach can only be interpreted qualita-tively. Wefind that the significant positive correlation between AGR and local temperature post El Niño occurs across all the major ecosystems (Flexas et al
2014) in the tropics, including forests, grasslands, and semi-arid regions (figure3and S4). Conversely, TMAT is not related to AGR in any biome post La Niña (figure S4). The areas with much stronger local temperature correlations post El Niño relative to post La Niña generally overlap with regions showing high temperature anomalies post El Niño (figure3and S5). We hypothesize that the differing temperature responses of AGR across ENSO phase are due to the impact of differences in prevalent temperature and moisture conditions on Gross Primary Production (GPP). The hot and dry conditions following El Niño (figure S5(a), (c)) result in a soil moisture deficit and lead to greater water stress (Jung et al2010, Miralles et al2014). Under strong water stress, GPP tends to decline with increases in temperature, as observed for
a variety of ecosystems (Flexas et al2014, Nobel et al
1978, Osonubi and Davies, 1980, Tenhunen et al
1985). This is in line with earlier studies showing that soil moisture conditions can control the response of terrestrial ecosystems to temperature fluctuations (Wang et al2014). The cooler and wetter conditions following La Niña (figure S5(b), (d)), on the other hand, represent more favorable conditions for GPP in many tropical ecosystems (Miralles et al2014, Poulter et al 2014). With reduced water stress and cooler temperatures, the impact of temperature on vapor pressure deficit is reduced, and thus tropical ecosystem GPP is likely to decrease with decreasing temperature, leading to little temperature influence on net carbon uptake.
Although a recent study (Anderegg et al2015) has suggested that total respiration dominates the inter-annual variability in the tropical land sink, we argue that respiration responses to temperature are unlikely to explain the different correlations between AGR and temperature across ENSO phases. Respiration is typically positively correlated with temperature, but the temperature sensitivity of respiration has been found to be affected by temperature and soil moisture. Under hotter and dryer conditions, the apparent temperature sensitivity of respiration is expected to be weaker (Moyano et al 2012, Song et al 2014). Therefore, respiration cannot explain the stronger correlation between AGR and TMAT post El Niño (when conditions are dryer and hotter) relative to that post La Niña (when conditions are wetter and cooler), as shown infigure1. Respiration also cannot explain the increases in the sensitivity of AGR identified over the lastfive decades (Wang et al 2014).
The significant correlation between AGR and TMAP post La Niña, but not post El Niño (figure1), is counter-intuitive atfirst because ecosystems are more strongly water-limited post El Niño. Under such conditions, precipitation variability would be expected to lead to variability in carbon uptake. Following El Niño conditions, however, our results imply that the water stress experienced by tropical ecosystems may be so severe that incremental changes in precipitation will not elicit a net response. This implies that while GPP and respiration may both increase with increased precipitation (Meir et al 2008, Nemani et al 2003, Wang et al 2013), the GPP response does not
Post EI Niño Post La Niña
(a) (b)
-0.3 0 0.3
Figure 3. Positive correlations between AGR and annual mean local temperature are stronger post El Niño than post La Niña across the tropics. Spatial distribution of the partial correlations between global AGR and annual mean local temperature for (a) post-El Niño and (b) post-La Niña years.
substantially exceed that of respiration. The weak precipitation post El Niño may reflect buffering mechanisms, such as plant physiological adjustment to water stress, soil water storage, vegetation structural constraints, which have been shown to reduce the impact of precipitation on net primary productivity (NPP) of grasslands and tropical forests under dry conditions (Doughty et al 2015, Knapp and Smith,2001).
Following La Niña conditions, conversely, certain regions in the tropics are still likely to be water limited, but less severely than Post El Niño, leading to a stronger response of GPP than respiration and hence a significant response of net vegetation growth. The stronger precipitation correlation post La Niña is in line with literature that show that, in the most dynamic biomes, biome-level pattern of aboveground NPP responds more strongly to precipitation during wet than dry years (Doughty et al2015). In the analysis presented here, the correlation to precipitation post La Niña is stronger over many areas, including tropical forests in the central Amazon and in Southeast Asia, in semi-arid ecosystems in South Africa and Australia, and in grasslands in South Asia (figure4). On a biome level, the strongest post La Niña correlation between AGR and precipitation occurs for tropical forests (figure S4), which experience higher precipitation relative to other tropical regions. Looking at long-term-average precipitation in more detail, we find that the post La Niña correlation between AGR and annual total precipitation is strongest for regions with a long-term-average precipitation in the range of 2000 to 3000 mm yr−1 (r¼ −0.60, p ¼ 0.007), and regions that fall into this range are mainly tropical forests in the Amazon and Southeast Asia.
Although recent studies have suggested that semi-arid ecosystems dominate the trend and variability of the land carbon sink (Ahlström et al2015, Poulter et al
2014), no significant correlation between AGR and
precipitation is found on biome level under either ENSO phase (figure S4), suggesting that some regions of relatively strong negative correlation may be getting averaged out by other regions with positive correla-tion. We also explore whether the longer duration of La Niña relative to El Niño conditions could account for the observed correlation with TMAP, but this is not the case (supplementary text 3). Rather, our results suggest that the wetter conditions post La Niña represent preferable growth conditions and thus lead to substantial additional net terrestrial carbon uptake in tropical ecosystems, especially those with relatively high average precipitation.
Overall, the asymmetrical ENSO response of the global land sink suggests that the hotter and drier climate post El Niño leads to stronger water stress and conditions that are less conducive to carbon uptake. As a result, GPP tends to decrease with higher temper-atures while the GPP negative response to lower precipitation is comparable to that of respiration. Under La Niña conditions, on the other hand, GPP increases with cooler temperature, and the positive sensitivity of GPP to higher precipitation is greater than that of respiration. Together, these behaviors lead to the asymmetric response of AGR to TMAT and TMAP observed across ENSO phases. Our findings imply that simply extrapolating the average historical sensitivity of global land sink to temperature and precipitation is insufficient to understand the impacts of climate change on the global land sink, as this misses the impact of climate modes and prevalent climate conditions on temperature and precipitation sensitivities.
To examine if state-of-the-art terrestrial biosphere models (TBMs) capture the observed relationship between AGR and TMAT/TMAP, we apply the same analytical framework to 10 models participating in
Post El Niño Post La Niña
Grasslands Semi-arid F orests -0.3 0 0.3 (a) (e) (c) (b) (f) (d)
Figure 4. Negative correlations between AGR and annual mean local precipitation are more widespread and stronger post La Niña, with the most consistent negative correlations occurring over tropic forests. Spatial distribution of the partial correlations between global AGR and annual mean local precipitation for (a, c, e) post-El Niño and (b, d, f ) post-La Niña years. Panels are broken out by (a, b) tropical forests, (c, d) semi-arid areas and (e, f ) grasslands to highlight differences across biomes.
Environ. Res. Lett. 12 (2017) 064007
MsTMIP (table S1) (Huntzinger et al2013, Wei et al
2014b). The analysis parallels that described above for AGR, but uses modeled tropical net ecosystem exchange (NEE) of CO2instead. Here, positive NEE
is defined as CO2release to the atmosphere.
Wefind that none of the individual TBM nor the ensemble mean model capture the phase-dependent response of the land biosphere to ENSO (figure1, S6). For all models, the correlations of tropical NEE to TMAT and TMAP remain largely unchanged across ENSO phases. The fact that the models do not capture the lack of correlation between AGR and TMAT post La Niña suggests that models do not capture the comparable responses in GPP and respiration to temperature under wetter and cooler conditions. In addition, wefind that all TBMs erroneously predict a significant correlation with TMAP across ENSO conditions (figure 1, S6), which may explain why previous model-based studies emphasized precipita-tion as an important driver of carbon sink interannual variability (Qian et al2011, Tian et al1998, Zeng et al
2005). Wefind that overestimates of the sensitivity to precipitation occur across all biomes and across regions spanning the full range of long-term-average precipitations. Earlier site-level studies have suggested that models overestimate the response of GPP to precipitation (Piao et al 2013), consistent with the results presented here. We find that the strong association with precipitation is also evident when looking at tropical GPP, at terrestrial ecosystem respiration, or at global NEE (figure S7(a-b)).
Taken together, the persistent stronger correlations in modeled NEE with both TMAT and TMAP than those derived from AGR observations also lead to an incorrect timing in the response of modeled tropical NEE to ENSO. Following El Niño conditions, the response of modeled NEE to the Niño 3.4 index is delayed relative to the AGR response (figure 2(a)). Following La Niña conditions, conversely, the re-sponse of modeled NEE to the Niño 3.4 index occurs earlier than observed in the AGR response (figure2
(b)). In both phases, the range of modeled tropical NEE responses to ENSO falls between the observed TMAT and TMAP responses to ENSO, rather than tracking the response of TMAT/TMAP during post El Niño/La Niña conditions, as observed from the AGR. Analogous analyses of global, rather than tropical, NEE show the same result.
Furthermore, although including nitrogen dy-namics in TBMs has been thought to improve the models’ representation of carbon cycle responses to temperature (Piao et al2013), it does not improve model performance in representing correlations with climatic drivers or ENSO for the suite of TBMs examined here (figure S7(c) and S8).
The consistency in the observed biases across all models is especially striking given the vast differences in model structure across the ensemble (Huntzinger et al 2013). It also precludes the possibility of easily
teasing out potential mechanisms based on differences in model structure. Instead, it suggests that inter-actions between water availability and heat are generally not captured in state-of-the-art terrestrial biosphere simulators.
The inability of models to represent how the sensitivity of the global land carbon sink to tempera-ture and precipitation is impacted by prevalent climate conditions points to a key uncertainty in our understanding of climate impacts on the future of the global land carbon sink (Cox et al2013, Wang et al
2013, Wang et al 2014, Wenzel et al 2014). One potential issue is that existing models may not capture the impact of water availability and stress on the temperature response of tropical ecosystems. With current tropical temperatures already close to the optimal photosynthetic temperature (Clark et al2003, Corlett, 2011, Doughty and Goulden, 2008), the response of tropical ecosystems to climate change may be highly sensitive to the impact of water stress on the temperature response of GPP. In addition, consistent model overestimation of the precipitation impact suggests that models may misrepresent processes related to how precipitation affects moisture availabil-ity, how tropical ecosystems respond to moisture availability, or how water stress impacts this response. Furthermore, because models do not capture the ENSO phase dependency in the response of the tropical carbon cycle to temperature and precipitation, they are unlikely to correctly simulate the influence of future climate variability on the global land carbon sink.
Overall, ourfindings provide new insights into the roles of, and the interactions between, temperature and precipitation in controlling the global terrestrial carbon sink, and therefore into the future response of the global carbon cycle to climate variability and change. Specifically, we find that the coupling between AGR and both tropical temperature and precipitation varies strongly with prevalent climate conditions, as exemplified by ENSO phase, which has substantial implications for projecting the future land carbon balance. The average linear relationship between AGR and temperature across all ENSO conditions has been used to constrain the sensitivity of tropical land carbon uptake to climate change (Cox et al2013, Wenzel et al
2014). Results shown here suggest that this approach may be misguided and likely leads to an overestimate of tropical land carbon responses to temperature during post La Niña years, when AGR is insensitive to temperature.
In addition, as climate continues to change in the future, tropical ecosystems may experience a climate shift that will affect their responses to climate variations. For example, if the tropical lands are to be drier and warmer (i.e. more El Niño-like), a stronger mean temperature response of the global land carbon sink is expected than under current estimates. This possibility highlights the importance of studies
exploring the joint impacts of heat and water availability on tropical ecosystems, impacts that have rarely been examined (Busch, 2015). We argue that contemporary models need to correctly include mechanisms related to such joint impacts to enable the simulation of the response of tropical ecosystems to climatic drivers as influenced by differences in prevailing climate conditions, and hence to capture the impact of future climate change on the global land carbon sink.
Acknowledgments
This work was supported by NASA under Grant #NNX14AI54G and by NSF under Grant #1342076. We acknowledge atmospheric CO2data from the US
National Oceanic and Atmospheric Administration Earth System Research Laboratory (NOAA/ESRL) and the CO2program in Scripps Institution of
Oceanog-raphy (SIO). Estimates of fossil fuel emission, ocean sink, CO2 release from Land use land coverage, and
residual land sink were obtained from the Global Carbon Project (GCP); fire emission of CO2 was
obtained from Global Fire Emission Database version 4.1 (GFED 4.1s); Niño 3.4 index was obtained from National Weather Service Climate Prediction Center; MEI index and the GPCC precipitation data were obtained from the Physical Science Division (PSD) of NOAA/ESRL; CRU-NCEP climatological drivers (precipitation, surface air temperature, etc.), along with simulated terrestrial carbonfluxes, were provided by the Multi-scale synthesis and Terrestrial Model Intercomparison Project (MsTMIP;http://nacp.ornl. gov/MsTMIP.shtml). Funding for the MsTMIP activity was provided through NASA Grant #NNX10AG01A. Data management support for preparing, documenting, and distributing model driver and output data was performed by the Modeling and Synthesis Thematic Data Center at Oak Ridge National Laboratory (ORNL; http://nacp.ornl.gov), with funding through NASA Grant #NNH10AN681. J. B. F contributed from the Jet Propulsion Laboratory, California Institute of Technology, under a contract with the National Aeronautics and Space Administra-tion. Finalized MsTMIP data products are archived at the ORNL DAAC (http://daac.ornl.gov). We also acknowledge the modeling groups that provided results to MsTMIP and their funding sources. This is MsTMIP contribution #8.
References
Ahlström A et al 2015 The dominant role of semi-arid ecosystems in the trend and variability of the land CO2 sink Science348 895–9
Anderegg W R L et al 2015 Tropical nighttime warming as a dominant driver of variability in the terrestrial carbon sink Proc. Natl Acad. Sci.112 15591–6
Ballantyne A P, Alden C B, Miller J B, Tans P P and White J W C 2012 Increase in observed net carbon dioxide uptake by land and oceans during the past 50 years Nature488 70–2
Braswell B H, Schimel D S, Linder E and Moore B 1997 The response of global terrestrial ecosystems to interannual temperature variability Science 278 870–3
Brown B L and Hendrix S B 2014 Partial correlation coefficients Wiley StatsRef: Statistics Reference Online (Hoboken, NJ: Wiley)
Busch F A 2015 Reducing the gaps in our understanding of the global terrestrial carbon cycle New Phytologist206
886–8
Ciais P, Sabine C, Bala G, Bopp L, Brovkin V, Canadell J, Chhabra A, Defries R, Galloway J and Heimann M 2014 Carbon and other biogeochemical cycles Climate change 2013: the physical science basis Contribution of Working Group I to the Fifth Assessment Report of the
Intergovernmental Panel on Climate Change (Cambridge: Cambridge University Press)
Clark D A, Piper S C, Keeling C D and Clark D B 2003 Tropical rain forest tree growth and atmospheric carbon dynamics linked to interannual temperature variation during 1984–2000 Proc. Natl Acad. Sci. 100 5852–7 Corlett R T 2011 Impacts of warming on tropical lowland
rainforests Trends in Ecology and Evolution26 606–13
Cox P M, Betts R A, Jones C D, Spall S A and Totterdell I J 2000 Acceleration of global warming due to carbon-cycle feedbacks in a coupled climate model Nature408 184–7
Cox P M, Pearson D, Booth B B, Friedlingstein P, Huntingford C, Jones C D and Luke C M 2013 Sensitivity of tropical carbon to climate change constrained by carbon dioxide variability Nature494 341–4
Doughty C E and Goulden M L 2008 Are tropical forests near a high temperature threshold? J. Geophys. Res.: Biogeosc.
113 G00B07
Doughty C E et al 2015 Drought impact on forest carbon dynamics andfluxes in Amazonia Nature519 78–82
Fisher R A 1915 Frequency distribution of the values of the correlation coefficient in samples from an indefinitely large population Biometrika10 507–21
Fisher R A 1921 On the probable error of a coefficient of correlation deduced from a small sample Metron 1 3–32 Flexas J, Diaz-Espejo A, Gago J, Gallé A, Galmés J, Gulías J and
Medrano H 2014 Photosynthetic limitations in mediterranean plants: a review, environmental and experimental Botany103 12–23
Friedlingstein P et al 2006 Climate-carbon cycle feedback analysis: results from the C4MIP model intercomparison J. Clim. 19 3337–53
Friedlingstein P, Meinshausen M, Arora V K, Jones C D, Anav A, Liddicoat S K and Knutti R 2014 Uncertainties in CMIP5 climate projections due to carbon cycle feedbacks J. Clim.
27 511–26
Gatti L V et al 2014 Drought sensitivity of Amazonian carbon balance revealed by atmospheric measurements Nature 506 76–80
Gurney K R, Castillo K, Li B and Zhang X 2012 A positive carbon feedback to ENSO and volcanic aerosols in the tropical terrestrial biosphere Glob. Biogeochem. Cycles26 GB1029
Hilker T, Lyapustin A I, Tucker C J, Hall F G, Myneni R B, Wang Y, Bi J, Mendes De Moura Y and Sellers P J 2014 Vegetation dynamics and rainfall sensitivity of the Amazon Proc. Natl Acad. of Sci.111 16041–6
Huntzinger D et al 2014 NACP MsTMIP: Global 0.5-deg Terrestrial Biosphere Model Outputs (version 1) in Standard Format (Oak Ridge, TN: Oak Ridge National Laboratory Distributed Active Archive Center) (http://
10.3334/ORNLDAAC/1225)
Huntzinger D N et al 2013 The North American carbon program multi-scale synthesis and terrestrial model intercomparison project—part 1: overview and experimental design Geosci. Model Dev.6 2121–33
Environ. Res. Lett. 12 (2017) 064007
Johnson R A and Wichern D W 2007 Applied Multivariate Statistical Analysis (Upper Saddle River, NJ: Pearson Prentice Hall)
Jung M et al 2010 Recent decline in the global land evapotranspiration trend due to limited moisture supply Nature467 951–4
Jung M et al 2017 Compensatory water effects link yearly global land CO2sink changes to temperature Nature541 516–20 Keeling C, Piper S, Bacastow R, Wahlen M, Whorf T, Heimann M and Meijer H 2005 Atmospheric CO2and13CO2exchange with the terrestrial biosphere and oceans from 1978 to 2000: observations and carbon cycle implications A History of Atmospheric CO2and Its Effects on Plants, Animals, and Ecosystems, ed I T Baldwin et al (New York: Springer) Kindermann J, Würth G, Kohlmaier G H and Badeck F-W 1996
Interannual variation of carbon exchangefluxes in terrestrial ecosystems Glob. Biogeochem. Cycles 10 737–55 Knapp A K and Smith M D 2001 Variation among biomes in
temporal dynamics of aboveground primary production Science291 481–4
Kousky V E and Higgins R W 2007 An alert classification system for monitoring and assessing the ENSO cycle Weather and Forecasting22 353–71
Kutner M H, Nachtsheim C and Neter J 2004 Applied Linear Regression Models (New York: McGraw-Hill/Irwin) Larkin N K and Harrison D E 2005 On the definition of El Niño
and associated seasonal average US weather anomalies Geophys. Res. Lett.32 L13705
Le Quéré C et al 2015 Global carbon budget 2014 Earth Syst. Sci. Data7 47–85
Meir P, Metcalfe D B, Costa A C L and Fisher R A 2008 The fate of assimilated carbon during drought: impacts on respiration in Amazon rainforests Philos. Trans. R. Soc. Lond. B Biol. Sci.363 1849–55
Miralles D G et al 2014 El Niño-La Niña cycle and recent trends in continental evaporation Nat. Clim. Change 4 122–6 Moyano F E et al 2012 The moisture response of soil
heterotrophic respiration: interaction with soil properties Biogeosciences9 1173–82
Nemani R, Keeling C, Hashimoto H, Jolly W, Piper S, Tucker C, Myneni R and Running S 2003 Climate-driven increases in global terrestial net primary production from 1982 to 1999 Science300 1560–3
Nobel P S, Longstreth D J and Hartsock T L 1978 Effect of water stress on the temperature optima of net CO2exchange for two desert species Physiol. Plantarum 44 97–101 Osonubi O and Davies W J 1980 The influence of water stress
on the photosynthetic performance and stomatal behaviour of tree seedlings subjected to variation in temperature and irradiance Oecologia45 3–10
Piao S et al 2014 Evidence for a weakening relationship between interannual temperature variability and northern vegetation activity Nat. Commun.5
Piao S et al 2013 Evaluation of terrestrial carbon cycle models for their response to climate variability and to CO2trends Glob. Change Biol.19 2117–32
Poulter B et al 2014 Contribution of semi-arid ecosystems to interannual variability of the global carbon cycle Nature
509 600–3
Qian H, Joseph R and Zeng N 2011 Response of the terrestrial carbon cycle to the El Niño-Southern Oscillation Tellus B
60 537–50
Schneider U, Becker A, Finger P, Meyer-Christoffer A, Rudolf B and Ziese M 2015 GPCC Full Data Reanalysis Version 7.0 at 0.5°: Monthly Land-Surface Precipitation from Rain-Gauges built on GTS-based and Historic Data, Global Precipitation Climatology Centre (GPCC,http://gpcc.dwd. de/) at Deutscher Wetterdienst (http://10.5676/DWD_
GPCC/FD_M_V7_050)
Schneider U, Becker A, Finger P, Meyer-Christoffer A, Ziese M and Rudolf B 2013 GPCC’s new land surface precipitation climatology based on quality-controlled in situ data and its role in quantifying the global water cycle Theor. Appl. Climatol. 115 15–40
Schwalm C R et al 2015 Toward‘optimal’ integration of terrestrial biosphere models Geophys. Res. Lett. 42 4418–28 Song B et al 2014 Divergent apparent temperature sensitivity of
terrestrial ecosystem respiration J. Plant Ecol.7 419–28
Stockburger W D 2001 Introductory Statistics: Concepts, models, and applications 2nd edition (Mason, OH: Atomic Dog Publishing)
Tenhunen J D, Lange O L, Harley P C, Beyschlag W and Meyer A 1985 Limitations due to water stress on leaf net photosynthesis of Quercus coccifera in the Portuguese evergreen scrub Oecologia67 23–30
Tian H et al 2015 Global patterns and controls of soil organic carbon dynamics as simulated by multiple terrestrial biosphere models: Current status and future directions Glob. Biogeochem. Cycles29 775–92
Tian H, Melillo J M, Kicklighter D W, Mcguire A D, Helfrich J V K, Moore B and Vorosmarty C J 1998 Effect of interannual climate variability on carbon storage in Amazonian ecosystems Nature 396 664–7
Trenberth K E, Fasullo J T and Shepherd T G 2015 Attribution of climate extreme events Nat. Clim. Change5 725–30
Wang W, Ciais P, Nemani R R, Canadell J G, Piao S, Sitch S, White M A, Hashimoto H, Milesi C and Myneni R B 2013 Variations in atmospheric CO2growth rates coupled with tropical temperature Proc. Natl Acad. Sci.110 13061–6
Wang X et al 2014 A two-fold increase of carbon cycle sensitivity to tropical temperature variations Nature506 512–5
Wei Y et al 2014a NACP MsTMIP: Global and North American Driver Data for Multi-Model Intercomparison (Oak Ridge, TN: National Laboratory Distributed Active Archive Center) (https://doi.org/10.3334/ORNLDAAC/1220) Wei Y et al 2014b The North American carbon program
multiscale synthesis and terrestrial model intercomparison project—part 2: environmental driver data Geosci. Model
Dev.7 2875–93
Wenzel S, Cox P M, Eyring V and Friedlingstein P 2014 Emergent constraints on climate-carbon cycle feedbacks in the CMIP5 Earth system models J. Geophys. Res.: Biogeosci.119 794–807
Wolter K and Timlin M 1993 Monitoring ENSO in COADS with a seasonally adjusted principal component index, Conf. Proc., 17th Climate Diagnostics Workshop, NOAA/NMC/ CAC, NSSL, Oklahoma Climate Survey (CIMMS and the School of Meteor. Univ. of Oklahoma) p 52–7
Wolter K and Timlin M S 1998 Measuring the strength of ENSO events: How does 1997/98 rank? Weather53
315–24
Zeng N, Mariotti A and Wetzel P 2005 Terrestrial mechanisms of interannual CO2variability Glob. Biogeochem. Cycles19