HAL Id: hal-02913469
https://hal.archives-ouvertes.fr/hal-02913469
Submitted on 29 Oct 2020
HAL is a multi-disciplinary open access
archive for the deposit and dissemination of
sci-entific research documents, whether they are
pub-lished or not. The documents may come from
teaching and research institutions in France or
L’archive ouverte pluridisciplinaire HAL, est
destinée au dépôt et à la diffusion de documents
scientifiques de niveau recherche, publiés ou non,
émanant des établissements d’enseignement et de
recherche français ou étrangers, des laboratoires
A 1000-year high precision record of δ 13 C in
atmospheric CO 2
R. Francey, C. Allison, D. Etheridge, C. Trudinger, I. Enting, M. Leuenberger,
R. Langenfelds, E. Michel, L. Steele
To cite this version:
R. Francey, C. Allison, D. Etheridge, C. Trudinger, I. Enting, et al.. A 1000-year high precision record
of δ 13 C in atmospheric CO 2. Tellus B - Chemical and Physical Meteorology, Taylor & Francis,
2016, 51 (2), pp.170-193. �10.3402/tellusb.v51i2.16269�. �hal-02913469�
Full Terms & Conditions of access and use can be found at
ISSN: (Print) 1600-0889 (Online) Journal homepage: https://www.tandfonline.com/loi/zelb20
A 1000-year high precision record of
δ
13
C in
atmospheric CO
2
R. J. Francey, C. E. Allison, D. M. Etheridge, C. M. Trudinger, I. G. Enting, M.
Leuenberger, R. L. Langenfelds, E. Michel & L. P. Steele
To cite this article:
R. J. Francey, C. E. Allison, D. M. Etheridge, C. M. Trudinger, I. G. Enting, M.
Leuenberger, R. L. Langenfelds, E. Michel & L. P. Steele (1999) A 1000-year high precision record
of
δ
13C in atmospheric CO
2, Tellus B: Chemical and Physical Meteorology, 51:2, 170-193, DOI:
10.3402/tellusb.v51i2.16269
To link to this article: https://doi.org/10.3402/tellusb.v51i2.16269
© 1999 The Author(s). Published by Taylor & Francis.
Published online: 15 Dec 2016.
Submit your article to this journal
Article views: 1578
View related articles
T ellus (1999), 51B, 170–193 Copyright © Munksgaard, 1999
Printed in UK – all rights reserved TELLUS
ISSN 0280–6495
A 1000-year high precision record of d13C in
atmospheric CO
2
By R. J. FRANCEY1,2*, C. E. ALLISON1, D. M. ETHERIDGE1, C. M. TRUDINGER1,2, I. G. ENTING1,2, M. LEUENBERGER3, R. L. LANGENFELDS1, E. MICHEL4, and L. P. STEELE1,2, 1CSIRO Atmospheric Research, Private Bag No. 1 Aspendale, V ictoria 3195, Australia; 2Cooperative Research Centre for Southern Hemisphere Meteorology, V ictoria 3168, Australia; 3Climate and Environmental Physics, Physics Institute, University of Bern, Sidlerstasse 5, 3012 Bern, Switzerland;
4Centre des Faibles Radioactivites, L aboratoire CNRS-CEA, 91198 Gif sur Yvette Cedex, France
(Manuscript received 3 February 1998; in final form 14 September 1998)
ABSTRACT
We present measurements of the stable carbon isotope ratio in air extracted from Antarctic ice core and firn samples. The same samples were previously used by Etheridge and co-workers to construct a high precision 1000-year record of atmospheric CO
2concentration, featuring a close link between the ice and modern records and high-time resolution. Here, we start by confirming the trend in the Cape Grim in situd13C record from 1982 to 1996, and extend it back to 1978 using the Cape Grim Air Archive. The firn aird13C agrees with the Cape Grim record, but only after correction for gravitational separation at depth, for diffusion effects associated with disequilibrium between the atmosphere and firm, and allowance for a latidudinal gradient in d13C between Cape Grim and the Antarctic coast. Complex calibration strategies are required to cope with several additional systematic influences on the ice cored13C record. Errors are assigned to each ice core value to reflect statistical and systematic biases ( between±0.025‰ and±0.07‰); uncertainties (of up to ±0.05‰) between core-versus-core, ice-versus-firn and firn-versus-troposphere are described separately. An almost continuous atmospheric history of d13C over 1000 years results, exhibiting significant decadal-to-century scale variability unlike that from earlier proxy records. The decrease ind13C from 1860 to 1960 involves a series of steps confirming enhanced sensitivity ofd13C to decadal timescale-forcing, compared to the CO2record. Synchronous with a ‘‘Little Ice Age’’ CO2decrease, an enhancement ofd13C implies a terrestrial response to cooler temperatures. Between 1200 AD and 1600 AD, the atmospheric d13C appear stable.
1. Introduction ence the atmospheric stable carbon isotope ratio 13C/12C. The majority of land plants employ the The most striking change in the modern and C3 photosynthetic pathway which results in stored ice core records of atmospheric CO
2 over recent carbon approximately 18‰ depleted in13C with centuries is the increase attributed to industrial, respect to the atmosphere (Farquhar et al., 1982). mainly fossil fuel, emissions (Keeling et al., 1989a; Around 21% of carbon uptake by modern plants Etheridge et al., 1996). Significant CO
2perturba- is via C4 photosynthesis, so that the global mean tions can also be expected from land-use change discrimination is marginally less, around 15‰ (Houghton et al., 1983). Both perturbations influ- (Lloyd and Farquhar, 1994). Fossil fuel releases involve the combustion of ancient, mainly C3
time by fractionating processes depending on fuel dating and yearly time resolution over century to millennium time-scales. However, Francey and type (Tans, 1981; Andres et al., 1998). Since the
fractionation that occurs in combustion and res- Farquhar (1982) argued that the past CO 2 could not be inferred via isotopic measurements of tree piration of fossil, plant and soil carbon is small,
both industrial and land-use changes impose sim- rings without independent evidence of historical changes in tree physiology (‘‘vital effects’’), since ilar changes in the 13C/12C ratio of the global
atmosphere. In contrast, the fractionation associ- the kinetics of carbon assimilation control the photosynthetic fractionation factor (Farquhar ated with diffusion across the air-sea interface is
an order of magnitude smaller (Mook et al., 1974) et al., 1982). Stuiver et al. (1984) used a correlation between ring-width and d13C to argue that the and the dissolved CO2 is generally assumed to be
in isotopic equilibrium with dissolved inorganic ring widths reflect assimilation rate (when in fact they record the cumulative seasonal assimilation). carbon (DIC) which contributes the bulk (~99%)
of the mixed layer carbon. Since the DIC is not While qualitatively useful, the different averaging times and possible non-linear processes make the significantly disturbed by marine photosynthesis
at typical open ocean primary production rates potential errors appreciable and there is consider-able block-to-block (10 yr) variation in their ring-(Francois et al., 1993), marine photosynthesis has
minimal impact, globally, on atmospheric values. area-normalised averaged13C record.
A theoretical study on C4 plants by Farqhuar Thus atmospheric13C/12C records can be used to
partition the uptake of fossil fuel carbon between (1983) suggested that the different carbon assimila-tion pathway would reduce kinetic effects. This oceanic and terrestrial reservoirs (Pearman and
Hyson, 1986). They can also be used in studies of idea was explored by Francey (1986) using historic sugar samples but the results were scattered natural variability in the carbon cycle (Keeling
et al., 1989b) and in calibrating global carbon and inconclusive. Marino and McElroy (1991) employed catalogued samples of maize cobs and budget models (Siegenthaler and Oeschger, 1987;
Heimann and Maier-Reimer, 1996). kernels (Zea mays) to obtain a trend over the
1950–1990 period similar to the Keeling et al. The detection of the fossil fuel signature in the
stable carbon isotope ratio of atmospheric CO2 (1980) atmospheric results, however the year-to-year scatter is very large (~0.5‰) post 1978, was first reported by Keeling et al. (1979, 1980).
This work compared early clean-air monitoring compared to the overlapping atmospheric record. The high time resolution and long sequence results in 1977 and 1978 at La Jolla (33°N),
Fanning Island (4°N) and South Pole (90°S) with advantages of the C3 tree rings are not generally shared by C4 plants. With a similar rationale, measurements taken 22 years earlier at a variety
of US land and marine sites. Significant calibration White et al. (1994) exploit the stomata-less proper-ties of mosses and peat in a sediment core to problems exist in relating measurements 22 years
apart, never-the-less a change in d13C of −0.65 obtain a 14 000 year record of atmosphericd13C, however the last 1000 years of relevance here is ±0.13‰ was reported. The same team has
reported a similar overall decrease rate in d13C not well resolved in this record (4 points). The d13C precision on all of these methods has been since 1977 (Whorf et al., 1993; Keeling et al.,
1995). Recently, Francey et al. (1995a) report an limited by the preparation, combustion and ana-lysis error of around 0.1‰ or more, over and independent set of atmospheric d13C
measure-ments from 1982, again with a similar overall rate above possible vital effect contributions.
Druffel and Benavides (1986) selected a of decline in the relative 13C/12C ratio, but with
considerably smaller inter-annual variability. Jamaican slow-growing marine sponge, which accretes aragonite close to equilibrium with the Shorter records are also available from Nakazawa
et al. (1993a, 1997) since 1984, and Trolier et al. surrounding dissolved inorganic carbon (DIC) system, aiming to suppress kinetic effects associ-(1996) since 1990.
There have been several attempts to detect the ated with photosynthesis. Druffel and Benavides measured an ocean surface-layerd13C change of fossil fuel signal on century time-scales via the
13C/12C ratio in organic material, primarily using −0.5±0.15‰ from 1800 to 1972 (similar to the change measured in more scattered data from a tree rings (Stuiver, 1978). The advantage of
. . . 172
decline occurs between 1920 and 1960, which is allowing for the significant fractionation in the ice samples as the importance of these effects was not interpreted as a peak in CO
2 production from
forest/soil sources around this time. Using the appreciated at the time. This is an important omission for applications relying on the total modelled surface-ocean response, Druffel and
Benavides point out similarities during this period change in d13C over the industrial period, but does not explain the significant flattening of the to the ring-area-normalised tree ring record of
Stuiver et al. (1984). Although Keeling (1993) d13C record between 1920 and 1950 (the end of their ice core record) reported by Siegenthaler and reports very large inter-annual variation in direct
measurements of surface ocean d13C since 1983, Oeschger. The 1920–50 flattening is quite unlike the trend in the Druffel and Bernavides DIC Bo¨hm et al. (1996) measured a smooth high
precision record ofd13C in DIC from sponges in record and Stuiver normalised tree ring records, but not unlike that measured in the DIC record the Caribbean and Coral seas from 1800 AD to
the present. Dating of the material back to 1960 of Bo¨hm et al. (1996).
We use 3 ice cores from 2 sites at Law Dome, is confirmed by bomb 14C measurements, but
prior to that it is estimated from assumed growth Antarctica, firn air pumped from the highest accu-mulation site, and air from the Cape Grim Air rates and is uncertain by around 50 years in
1900 AD, and 100 years in 1800 AD. Apart from Archive, to overcome many of the problems enco-untered in studies by other workers. Preliminary smaller scatter, the Bo¨hm et al. data have much
less decline over the 1900 to 1960 period than that d13C results over the industrial period from these samples have been previously presented by implied by the Druffel and Benavides data.
Baksaran and Krishnamurthy (1993) report a Leuenberger et al. (1993) and interpreted by Joos et al. (1994). The results presented here are more d13C decrease in speleothems. Again the complex
processes involved in carbon precipitation limit comprehensive and now include rigorous correc-tion for several effects not included in the prelimin-applicability, and the dating is not precise.
There have been severald13C records measured ary studies. These include continuity between the modern and ice core record, and a consistent from the air enclosed in ice cores. The ice core
records avoid ‘‘vital effects’’, but there is modifica- calibration strategy for the various measurements of archived air and the contemporary global net-tion of trace gas composinet-tion during the
entrap-ment and storage of air in ice. Twod13C ice core work. Reference is also made to ship-board cruise data linking the relevant sites.
studies relate to air prior to the industrial period, Siegenthaler et al. (1988) report ad13C change in the 13th century using a South Pole core, and
Leuenberger et al. (1992) discuss glacial/Holocene 2. Site and sample collection details
differences in d13C from an ice core drilled at Byrd
Station, Antarctica. The studies covering the The ice and firn samples were collected from coastal Antarctica, near the summit of Law Dome, industrial period include the cores Siple (Friedli
et al., 1986) and H15 (Nakazawa et al., 1993b) 1390 m above sea level at 66°44∞S, 112°50∞E. Site information, and general drilling and dating from Antarctica, and Dye 3 (Leuenberger, 1992)
from Greenland. The major drawback with all of strategies, are given by Morgan et al. (1997). Information specific to the drilling and sample these records is that the most recent trapped air
is prior to the 1960s, with unresolved calibration collection for study of the composition of entrapped air is detailed by Etheridge et al. (1996). problems in precisely relating to the post 1978
modern record. The scatter, relative to the overall Drilling sites were at DE08 in 1987 (providing ice ranging in age 1820–1939, DE08-2 in 1993 (ice measuredd13C trend prior to 1960, is also
signi-ficant. In addition, the published records generally spanning 1802–1948, and firn air) and DSS, drilled over the period 1988 and 1993 to bedrock (span-have not been corrected for diffusion effects and
gravitational settling in the firn prior to bubble ning the Holocene and beyond, with trace gas analyses so far completed for 948 to 1901 AD). close-off in the ice (Craig et al., 1988; Schwander,
1989). For example, Siegenthaler and Oeschger Ice dating accuracy is±2 yr at 1850 in all three cores and±10 yr at 1350 AD in DSS. Etheridge (1987) deconvolve combined Siple ice core and
ice and entrapped air as 30±1 years for the two 1989, 1992). Typically, 1 kg sub-samples are selected and trimmed for processing. After evacu-DE08 sites and 58±2 years for DSS, with the
DE08-2 result subsequently accurately and inde- ation, then grating, an ice sample yields 50–150 standard ml of air, which is cryogenically dried at pendently confirmed by Levchenko et al. (1996,
1997) using the 1960s atmospheric 14C bomb −100°C and collected in electro-polished and pre-conditioned stainless steel traps at around spike. Levchenko et al. also confirm the very high
time resolution in the DE08-2 core of 12.5±1.5 −255°C (Etheridge et al., 1996). On thawing, trap pressure is typically 10 bar. The traps used to years, resulting from the large accumulation of
1100 kg m−2 yr−1 at the site. transfer the samples to the trace gas analysing
laboratory have no welds in the condensation Low mean temperatures (<−19°C at DE08
and colder at DSS) largely avoid summer melt on volume and use all-metal valves with non-rotat-ing stems.
the surface, and this coupled with low impurity
levels, minimise trace gas modification. The uni- The Global Atmospheric Sampling Laboratory (GASLAB) provides multi-species, high precision form accumulation at the sites, and small
temper-ature gradients in the firn, suggest that thermal analysis of air samples for CO
2, CH4, CO, H2, and N2O, by gas chromatography (GC) and d13C fractionation effects (Severinghaus et al., 1998) will
be small. Different drilling techniques, thermal, and d18O of CO
2 by mass spectrometery (MS). Typically 20 standard ml of air is employed per electromechanical and fluid immersed
electro-chemical, were employed at DE08, DE08-2 and GC injection and 30 standard ml (STP) of air provides a precise MS analysis. The mass spectro-DSS respectively. However no systematic influence
associated with drill type has been detected in meter techniques central to the study are described in more detail in the next section. The GC meas-trace gas results.
At DE08-2 in 1993, firn air sampling devices urements of most relevance involved a Carle Series 400 GC, which catalytically converts CO2 (after (FASDs) were employed to collect air samples
from the porous firn between the surface and separation) to CH
4 for detection with a Flame Ionisation Detector, and a Shimadzu GC with impermeable ice at around 90 m depth. Air
pumped from the surface, and from 12 layers at Electron Capture Detector for the measurement of N
2O. The N2O/CO2 ratio is used in the correc-5 m intervals from 10 m, was collected in flasks
after drying with anhydrous magnesium perchlor- tion of MS data (Mook and Van der Hoek, 1983), and the CO2 data, described in detail by Etheridge ate. A variety of FASDs materials, pump types
and flask containers was employed. No systematic et al. (1996), are also fundamental to the biogeo-chemical interpretation of the isotope data. influence of FASD or pump was detected, while
some flask types contributed scatter in the results for some species. High precision trace gas data
4. Mass spectrometry
were obtained using a CSIRO pump unit and pressurized 0.5 litre glass flasks with PFAO-ring
The stable isotope ratios of CO2 in the air taps (Francey et al., 1996a), and only these results
samples are determined using a MAT 252 mass are considered here.
spectrometer (Finnigan MAT GmbH, Bremen). The primary comparison of the Law Dome
Cape Grim in situ extracted CO2, routine whole d13C records is with the Cape Grim d13C
mon-air samples from flasks, and the small, high pres-itoring program (Francey et al., 1995), and with
sure, whole air samples from ICELAB require measurements on archived air collected at Cape
three different methods of introducing samples to Grim.
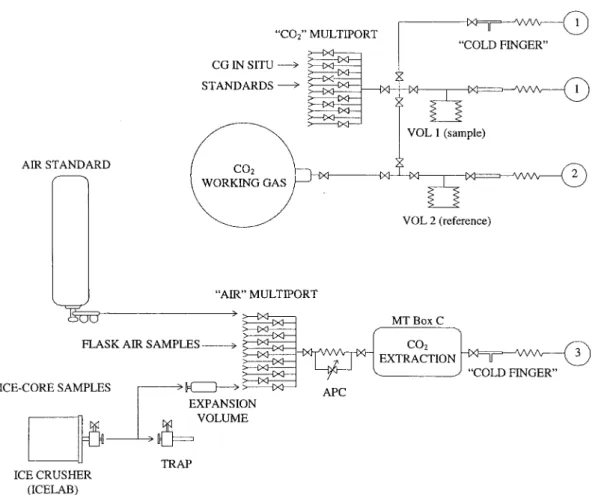
the mass spectrometer, creating opportunities for systematic differences between the records. The three strategies are summarised in Fig. 1.
3. Laboratory details
1. The Cape Grim in situ extraction of CO2 provides samples that are admitted through the The Ice Core Extraction Laboratory (ICELAB)
was established in CSIRO for the extraction of conventional bellows input of the CO 2 multi-port.
dry air from bubbles trapped in ice, using a
(includ-. . . 174
Fig. 1. Inlet strategies for analysing d13C of CO2using: (a) pure CO
2 samples through the ‘‘CO2’’ multiport (the Cape Grim in situ record and international CO
2standards analysed with respect to reference CO2in VOL 2), (b) large volume air samples via the MT Box-C (routine flasks, CG Archive and firn samples analysed w.r.t. VOL2, but expressed relative to bracketing AIR STANDARD), (c) small volume air samples via a modified MT Box-C system (ice core samples analysed and expressed w.r.t. reference CO
2in VOL 2, see text). Numbers on the right hand side refer to inlet connections to the change-over valve of the MAT252 mass spectrometer.
ing firn samples and the Cape Grim Air avoid incorrect valve operation. In addition, an automatic pressure controller (Granville-Archive) are admitted via a separate ‘‘air’’ (MT
Box-C) multiport which feeds through an initial Phillips 216 APC) in parallel with the MT Box-C capillary, is switched in for small ice capillary to drop air pressure in the series of
cryogenic traps. The pressure typically varies core samples to maintain viscous flow as the sample pressure drops. The CO
2 extraction between 100 and 200 mbar in the traps. The
cryogenic traps retain water vapour and other (98%) occurs at pressures above 15 mbar. condensables, and extract CO2 (plus N2O) for
injection into the MAT252 via a dedicated The assessment of differences between strategies 1 and 2 comes from a comparison of 5 years of micro-volume and crimped capillary.
3. For the smaller volume and higher initial pres- data from parallel in situ and flask sampling at Cape Grim (see next section). In later sections, we sure ice core air samples, expansion volumes
are connected to the MT Box-C multi-port to also assess the differences between strategies 2 and 3 by a series of ‘‘blank’’ tests via the expansion drop the initial pressure to less than~4 bar to
volumes with strategy 3, using air standards char- grams), is of more relevance. An as yet unattained objective for this work was to reduce systematic acterised and monitored using strategy 2. For
reasons related to a subtle malfunction in the MT errors to better than the external precision for routine flasks of ~0.015‰ (e.g., the mean and Box-C, the 2 versus 3 comparison proved the most
difficult to quantify and delayed final publication standard deviation of the difference between 77 flask pairs collected at Cape Grim during the of these data until now.
High precision isotopic ratios are determined two years including the ice core analyses was −0.002±0.015‰).
by alternating sample CO
2 and reference CO2 injected via matched crimped capillaries. The carbon isotopic ratio of the sample (S) is expressed
relative to the reference (R) as: 5. The Cape Grim d13C record
A detailed assessment of possible systematic d13C=
C
(13C/12C)S(13C/12C)R−1
D
1000‰ (1) differences between two pre-treatment and sample loading methods is possible from the parallel Cape The MAT252 simultaneously measures ion beamGrim operations of the in situ cryogenic extraction intensities at mass/charge (m/e) ratios of 44, 45
program and the routine GASLAB collection of and 46, with primary interest in the ratio of
chemically dried air in 0.5 litre flasks for CO 2 13C16O16O to 12C16O16O; results are initially
extraction using the MT Box-C. The in situ and reported as d45 and d46. Here we have derived
flask d13C, when expressed relative to the same 13C/12C values from the d45 and d46 values by
pure CO2 working gas, HC453, exhibit large and correcting for the interfering N2O ions at m/e 44 variable differences over the period 1992–1996. (using GC determined N
2O and CO2values) and The [flask-in situ] differences are similar in ampli-due to 12C16O17O at m/e 45 (using the m/e 46
tude and timing to variations in d13C of CO2 ratio) using assumptions and algorithms given by
extracted via the conventional MT Box-C, from Allison et al. (1995). The reference CO
2 used in high-pressure cylinders of clean, dry ambient air this study is the high purity CO
2working standard used as standards. The air standard d13C are HC453 with isotopic ratios relative to the
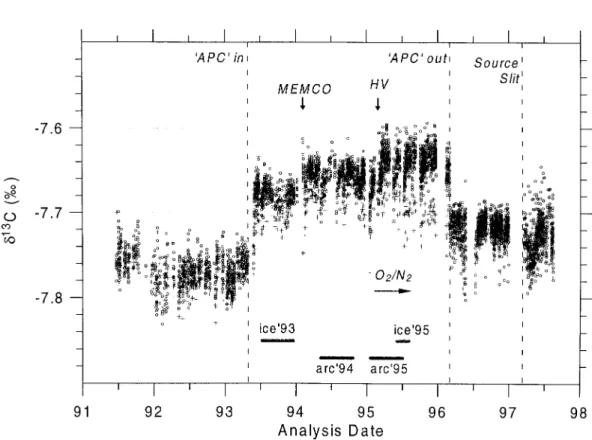
interna-shown against analysis date in Fig. 2, adapted tional standard V-PDB(CO
2) on the ‘‘1987 HC453 from Allison and Francey (1999), to include the scale’’ taken as:
timing of measurement sessions and ‘‘events’’ of d13CPDB=−6.396‰, d18OPDB=−13.176‰.
relevance to this paper. (2)
Several potentially serious systematic variations are evident in Fig. 2, including the step increase Correction for possible minor modification of the
working gas stored in the reference reservoir, and of around 0.07‰ in April 1993 (‘‘APC in’’) and corresponding drop in February 1996 (‘‘APC out’’), conversion of d13C measured relative to HC453
to values relative to V-PDB, also follow proced- discontinuities of order 0.05‰ at other significant hardware modifications (e.g., ‘‘MEMCO’’, ‘‘HV’’), ures and assumptions described by Allison et al.
(1995). and increasingd13C over the weeks following gaps
in the record which mostly indicate admission of The direct determination of the HC453d13C on
the V-PDB scale relies on relatively infrequent whole air (rather than pure CO
2) to the source region of the mass spectrometer. The last are more and low precision (±0.05‰) preparations of CO2
from the NBS-19 carbonate standard. Even if the evident after commencement of routine O2/N2 observations in January 1995, when the system value of HC453 were determined against NBS-19
with more precision, systematic offsets associated was regularly switched between CO
2 and air modes on time-scales of months.
with the extraction of CO2 from air samples have
often exceeded 0.05‰ (see below). In the applica- The ‘‘APC’’ event is of direct relevance here since ‘‘APC in’’ refers to installation of the APC tion of these measurements we are interested in
the changes of isotopic ratio rather than absolute so that ice core samples could be measured. Both ice core and Archive samples were measured values, so that the precision of ice core d13C
relative to values in the firn and to the direct between ‘‘APC in’’, and ‘‘APC out’’ when the cause of the problem (not the APC but a faulty pressure atmospheric measurements (in situ and flask
pro-. . . 176
Fig. 2. Systematic biases ind13C in standard air from high-pressure cylinders. Plus symbols (+) represent the first standard analysis of a session, circles are the average of other (typically 5) standard analyses in the session. A typical session is an overnight, automated sequence of samples and standards extracted and analysed on the MT Box-C and MAT252 mass spectrometer system. Mean differences between cylinder standards, determined by multiple overlap comparisons, have been removed (thus in the absence of systematic effects, no trend or discontinuity is anticipated in this plot). Times of analysis of ice core (ice’YY) and CGAA archived air (arc’YY) used in this paper are indicated. Significant events (e.g., ‘‘APC in’’) are identified in the text.
transducer installed with the APC) was correctly the primary reference tank (UAN900001) over a 2-month period in 1992. During this time the identified. Note that during this period, the first
cylinder analysis in a session (marked by a cross mean difference between 8 in situ and 14 flask samples from Cape Grim was 0.008±0.010‰, not in Fig. 2) is systematically lower than the mean of
other standard analyses in the session. This is significantly different from zero. We generally assume no difference between the CG92 air stand-mentioned further in the ice core analysis section
below. ard scale and the ‘‘in situ’’ or the 1987 HC453
CO
2 scale. The effectiveness of the calibration Allison and Francey (1999) provide more detail
on the various systematic effects of Fig. 2, and strategy is dramatically illustrated in a comparison between the in situ and flask values adjusted onto describe the calibration strategy, based on the air
standards, which overcomes the influence of all of the CG92 scale over the full period of 1992–1996 by Allison and Francey; the differences in the these effects on the d13C value of flask samples
pre-treated via the MT Box-C and analysed during annual average of in situ and flask values reduce to 0.001, 0.001, 0.010, 0.019 and 0.002‰ respect-automated sequences. All samples analysed via
the MT Box-C are reported relative to the average ively, which is close to our target precision for comparing different sampling strategies.
of air standard determinations in a session
(exclud-ing the first). An air standards calibrations scale, There is an inherent implication here that the in situ record is correct. The implication should CG92, was determined by 163 measurements of
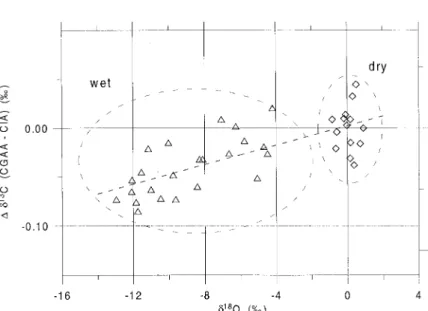
be questioned. Large inter-annually varying is a clear tendency for the wet filled tanks to fall below the Cape Grim in situd13C record. differences (up to 0.1‰) through the 1980s between
the Cape Grim in situd13C record (Francey et al., We also observed that the wet tanks exhibited large depletions in d18O of CO2 compared to 1995b) and comparable results from the Scripps
Institution of Oceanography record (Keeling et al., atmospheric values. Fig. 4 shows the ‘‘d13C anom-aly’’ in the tanks, defined as the difference of 1995) are well documented. Since 1991, the
pos-sibility of error in the Cape Grim in situ d13C ‘‘deseasonalized’’ archive tank data from a 2.5-year smoothing spline through the in situ record, plot-record is substantially diminished ( but not totally
excluded) by a close on-going ‘‘operational inter- ted against measuredd18O (the seasonal correction uses a harmonic fit to the in situ data). The wet comparison’’ with a totally independent extraction
and analysis mass spectrometer system (Francey and dry tanks are clearly distinguished and there is a significant empirical relationship—the exact et al., 1994; Masarie et al., personal
communica-tion). The full Cape Grim in situ record, and the mechanism for the anomaly ind13C is not under-stood, but is possibly related to disequilibrium flask record from 1991, are available from CDIAC
( http:ccwww.cdiac.ornl.gov) or directly via ftp: ftp generated by the blowing out of the excess cold water.
atmos.dar.csiro.au; login: anonymous, password:
your e-mail address; cd GASLABcc13co2. The Fig. 4 regression is used to correct all points in Fig. 3 (insignificant in the case of dry tanks). The remaining apparent scatter in the Archive record is now seen to generally correspond to
6. The Cape Grim Air Archive (CGAA)
seasonal features of the in situ record. Three points extend the Cape Grim record back to 1978. The Prior to 1991, we have obtained additional
information on the Cape Grimd13C record from 1978 point is a dry tank, well behaved in all species analysed; the other two are wet tanks the Cape Grim Air Archive. The CGAA has
proven useful for reconstructing the atmospheric exhibiting anomalous d15N, but retained here because of the sparsity of data in this period.d15N histories of a large range of species back to 1978,
including species for which no measurement meth- has proven to be a good diagnostic for effusive leakage from some tanks. The direction of the odology existed until recently, and species for
which inadequate calibration existed over the last d15N correction is indicated in Fig. 4 for the 1980 and 1982 points; based on the timing of d15N 2-decades (Langenfelds et al., 1996). In this case
we were able to measure 40 suitable CGAA tanks versus d13C measurements, upper limits to the corrections are 0.048‰, 0.024‰ respectively on two separate occasions, mostly over 6 months
in 1994, with a subset spanning the whole period bringing the points back close to the plotted symbols for wet tanks (note: a more accurated13C repeated in early 1995 (see ‘‘arc’95’’ in Fig. 2). The
relative precision of routine samples analysed and from these tanks may result from further tests to establish the relatived13C and d15N drift rates). confirmed over such short periods is close to the
external precision of±0.015‰. The CGAA record supports the long-term
calib-ration stability in the Cape Grim in situ record The CGAA is stored in metal containers, mainly
electropolished 35 litre stainless steel tanks. To and provides a reliable 1978 point to extend the record.
collect the air samples, the tanks were pressurised to around 10 bar with Cape Grim baseline air using immersion in liquid nitrogen assisted by a
metal bellows diaphragm pump. For approxi- 7. Firn air samples
mately half of the tanks, the air was dried
cryo-genically using an ethanol bath at~−80°C; for The flask samples collected from the Law Dome firn are treated identically to routine Cape Grim the remainder, air was not dried, however after
collection, tanks were thawed for 1–2 days in an flasks in terms of analysis and conversion to the CG92 scale. However, the composition of air in inverted position (with the valve at the bottom)
and the valve momentarily opened to blow out the firn is modified by gravity and diffusion which become appreciable effects at the 1 part in 105 collected water. In Fig. 3, the two filling strategies
. . . 178
Fig. 3. Thed13C of CO2in the Cape Grim Air Archive (CGAA). The diamonds (generally obscured) and triangles show measured values for tanks filled dry and wet respectively (see text). Filled circles are all values, corrected using an empirical relationship (see Fig. 4). Corrected values are significantly different only for the wet tanks. The half-filled circles represent two tanks in which values (in particulard15N) are drifting, but retained in this plot because they predate the in situ record and may be refined by future drift rate measurements (see text). The in situ record is shown by fine grey lines between points (exhibiting a seasonal variation of around 0.05‰), and a dark line representing a 2.5 year smoothing spline.
be independently estimated via measurement of scale measuredd15N changes to predict the relative d13C gravitational corrections for the two sites. d15N in the firn since the stability of N2
concentra-tion in the atmosphere means that an equilibrium The effects of gravity and the growth-rate-related effect of diffusion in the firn are shown to depth profile for this isotope is established in the
firn. The increasing CO
2in the atmosphere means be effectively additive, a fact used in Fig. 5 to illustrate the magnitude of both influences ond13C that an equilibrium situation is not established for
d13C, so that the slightly faster diffusion rate of of CO2at the Law Dome DE08 site. The gravita-tional correction is shown both for measuredd15N, 12C compared to 13C becomes important. The
resulting influence, which depends on relative and from the model in which the correction is effectively determined by tuning the model against diffusion coefficients and the atmospheric growth
rate, is more fully explored by Trudinger et al. atmospheric CO2 and SF6 profiles (and checking with CH4). The measured d15N at the surface of (1997) using a firn-diffusion model. Note however,
that at the very high accumulation Law Dome the firn (1993 point) does not agree well with Cape Grim, and the firn d15N generally exhibit sites, the model produces different changes in d13C
andd15N even for assumed constant atmospheric more scatter than is expected. In order to avoid introducingd15N measurement scatter to the d13C CO2. This is because vertical advection also limits
the degree to which gravitational separation is from the gravitational correction, and to obtain consistent corrections for firn and ice (see below), established. The modelled d13C/d15N changes of
Fig. 4. The empirical relationship betweend13C anomaly (difference from the smoothed Cape Grim in situ record, CIA) and measured d18O of the CO2 in the CGAA tanks. The ‘‘wet’’ filled tanks have depleted18O. The linear regression through the points has the equation:Dd13C=0.0050(±0.0007)d18O+0.003(±0.006)‰.
Fig. 5. The effects on d13C values with depth in the firn at DE08, Law Dome, of gravity and of diffusion in the firn. The effects of gravitational settling are first applied to the measured d13C (+ symbols) using both measured d15N (scaled by a factor of 0.94, open triangles) and the modelledd13C gravitational correction (open circles). The model of firn diffusion (Trudinger et al., 1997) predicts the degree to which gravitational settling is offset by carbon isotope diffusion in the non-equilibrium situation of rising CO
2levels (leading to half-filled triangles and filled circles after application to the measured and modelled gravitational correction cases, respectively). The final corrected values are compared to a spline fit through the Cape Grim record (solid line, adjusted by−0.015‰ to agree in 1993, a difference consistent with the latitudinal gradient).
. . . 180
(1997) show that the model diffusion correction by Etheridge et al. (1996). In a typical crushing of 1 kg of ice, pressure in the sample trap can be as at DE08 survives a critical test when applied to
d13CH4(where the ‘‘growth-rate’’ correction dom- high as 1 Mpa. Even after analyses on two gas chromatographs for trace gas concentrations, inates the gravitational correction). The trends in
the corrected firnd13C curve in Fig. 5 bear a close remaining pressure can conceivably exceed 450 kPa on occasions, above which there will be resemblance to the Cape Grim record (adjusted
by –0.015‰ to agree with the firn in 1993, see the incorrect operation of the MT Box-C pneumatic inlet valves (Francey et al., 1996a). For this reason, discussion section below).
ice core air samples are admitted to the MT Box-C via a small stainless steel expansion volume to
8. Ice core samples halve the pressure. All of the air from the
expan-sion volume is then processed to extract the CO 2. 8.1. Gravity and atmospheric growth-rate related
diVusion corrections
8.3. Blank corrections The air trapped in ice bubbles has already
Blank tests have been carried out aimed at undergone modification in the firn. The firn
measuring the combined effect of air and CO 2 diffusion and trapping model of Trudinger et al.
extractions, as well as various intermediate steps, (1997) provides a framework for predicting
including the transfer of air to the MT Box-C and the magnitude of these effects in the bubbles.
the final CO
2 extraction. The tests involve using Assuming constant snow accumulation at each
high-pressure cylinder air with isotopic composi-drilling site, the record of CO
2in the atmosphere tion established by direct extractions on the MT of Etheridge et al. (1996) was used with the firn
Box-C via a pressure regulator. Regulators have model to estimate the diffusion correction in the
the potential to influenced13C, but the influences firn at the DE08, which has been applied to both
can be demonstrated as insignificant in the present DE08 and DSS sites. The diffusion correction for
case as a result of careful regulator selection, pre-d13C is large for recently trapped air (~0.1‰ for
conditioning and dedication to the cylinder for its 1970) but becomes insignificant (<0.01‰) prior
lifetime. For the blank tests, we have used two to industrialisation when atmospheric changes
high-pressure cylinders of natural air, filled using are small.
an oil-free Rix compressor with phosphorous pen-The deepest DE08-2 firn samples had measured
toxide drying (Francey et al., 1996a). The cylinders d15N=0.31‰, corresponding to a d13C
gravita-were filled at Cape Schanck (38.5°S, 144.9°E) in tional correction of 0.29‰ (this is considered an
conditions of strong winds from the south-west upper limit to the value trapped in ice, which
com-(Southern Ocean) sector. Cylinder air was intro-prises bubbles sealed over a range of depths). A few
duced via the regulator, at various stages into the isolated measurements ofd15N in air extracted from
sequence involving the ice crushing container, DE08 ice suggested ad13C gravitational separation
sometimes with ‘‘bubble-free’’ laboratory ice, the correction of 0.22±0.04‰, and even more
prelimin-full crushing and air extraction step, transfer via ary measurements in DSS ice give~0.22‰. Because
the trap, and the CO2 extraction sequence. A total of the preliminary and scattered nature of the ice
of 46 such blank tests were conducted. cored15N measurements, we have chosen to use the
These tests included specific comparisons of 8 firn model result of 0.26‰ ford13C in DE08-2 and
individual traps using sample sizes indicated by a DE08. Assuming a similar relationship between
mass spectrometer mass 44 collector voltage output diffusivity, porosity and density for the lower
accu-of 3.8±0.5 volts. Of the 7 traps used for ice core mulation and colder DSS site also provides a 0.26‰
analyses the standard deviation of the mean value gravitational correction.
of 25 analyses of air from cylinder CC was 0.017‰. The traps are not distinguished in what follows, and 8.2. Extraction details
thus ice core analyses are expected to have scatter at least at the 0.017‰ level.
Two extraction processes are involved for ice
core samples, : air from ice, and CO2 from the air. Two full ‘‘bubble-free’’ ice crushing tests yielded differences of −0.053 and −0.062‰ from the tank The extraction of air from ice is described in detail
value established directly through a regulator. difference between the 1st-of-a-sequence, and later extractions of a session in the measurements from In tests in which the full crushing sequence
the transfer volumes, unlike the case for analyses was carried out, but only the bubble-free ice
directly from cylinders (Allison and Francey, in was omitted, the results were Dd13C=−0.053
press). Our basic hypothesis implies that all routine ±0.019‰ (n=11), suggesting no additional
influ-extractions through the MT Box-C are in a marginal ence of the ice crushing.
operating zone for complete extraction of CO2 We initially interpreted the results as requiring
(shorter molecular mean free paths at the higher an ice core ‘‘blank’’ correction of ~+0.05‰
pressure do not guarantee a collision of every CO2 (Francey et al., 1996b). However, this assumes that
molecule onto a cold surface) and/or removal of the conversion onto the CG92 scale will be the
possible contaminants. The combination of fixed same when air is extracted directly from the
automated timing between extractions, of relatively regulator, compared to the same air extracted
constant CO2 sample size (measured by a mass from the various containers (crushing volume,
spectrometer sample voltage of ~4 V) and nor-trap, expansion volume) involved in transferring
malising onto the CG92 scale with the bracketing ice core air. A number of pieces of evidence have
air standards effectively overcomes problems caused emerged which suggest this is not the case.
by the marginal operation, as demonstrated for the We now argue that the analyses involving the
Cape Grim programs. The in situ and ice core transfer containers, like the Cape Grim in situ
ana-samples are extracted in a pressure regime ensuring lyses, should not be normalised against the air
full CO
2 extraction and/or removal of contamin-standards, rather, should be expressed against the
ants. We proceed on the basis that the ice core pure CO2 HC453 standard. Thus, the true ‘‘blank’’ samples should not be normalised, but corrected for for ice core samples is the difference of
the−0.11‰ blank. ~−0.11±0.03‰ (n=46) between cylinder air
measured via the transfer container relative to
8.4. Ethanol contamination HC453, and the same air determined directly
through the regulator and normalised onto the The mass spectrometer typically compares 4–8 CG92 air standard scale. The physical basis for the alternating integrations of the sample and refer-argument relates to the parameters of the cryogenic ence ion ratios to determine an average d45 for CO
2extraction from air. Using factory settings and the sample. A ‘‘preliminaryd45’’ can be calculated normal flask or cylinder samples, typically 1.5 bar for each sample/reference pair. Some initial ice is maintained at the multiport air inlet throughout core measurements sampled in 1993, after initial the extraction in the MT Box-C, with cryogenic stable ‘‘preliminaryd45’’, exhibited a rapid increase trap pressure rising to around 200 mbar during a suggesting contamination. This phenomenon was 5-min extraction. For ice cores, and blank tests tentatively identified with a contaminant with using the expansion volumes, pressure at the multi- delayed passage through the mass spectrometer port inlet quickly falls to less than 1 bar and the capillary reaching the ion source. Ethanol was a pressure in the cryogenic traps is maintained for as prime suspect, since it produces m/e 46, 45 and long as possible at 15 mbar during a 5-min trap. In 44, and it was inadvertently stored in the ICELAB this regard, the expansion volume extractions have cold room. The delay is consistent with the higher a similarity to the in situ CO
2, extracted at a melting point of ethanol compared to the sublima-constant 20 mbar at Cape Grim, and measured tion temperature of CO2. The combined measures through the variable volume inlet (Fig. 1), and we of removal of the ethanol from the cold room and treat them similarly. The circumstantial evidence reprogramming of the MT Box-C vapour trap supporting the argument are significant increases in temperatures of the extraction line from−80°C scatter in the ice core record if the results are to−100°C effectively eliminated the problem. At normalised onto the CG92 scale, and significant least two successive ‘‘preliminaryd45’’ differing by inconsistency between ice core and firn results. If less than 0.2‰ were required to avoid rejection. the ice core data are corrected onto the CG92 scale We have rejected 10 DSS sample ratios on this as for the cylinder standards, they fall more than criterion and accepted 13 with less than 4 cycles. 0.1‰ below the firn data in the 1970s. Further These are identified in the tabulation of data
below, and allocated a larger uncertainty. circumstantial support comes from the lack of a
. . . 182
8.5. Sample size eVects cessed, (b) is of most concern. Because the relative
importance and magnitude of the sample size Compared to routine flasks, cylinder analyses
influences are sensitive, to not-well-documented-and the blank tests, the ice core samples
experi-fine adjustments to capillaries for example, we enced a very wide range of sample mass 44 voltage
adopt an empirical approach. The residuals of a outputs (V
SA), from 1.5 to 6 volts. An initial weighted smooth spline (through the otherwise program study was undertaken to investigate the
fully corrected ice core samples) are examined for sample size limitations for ice core air analyses
a sample size dependency consistent with the (Lang, 1991). This study (with d45 ~−1.5‰) described influences. Only results after 1800 AD documented at least 3 processes contributing to a
are considered, because low sample density prior variation ofd13C with sample size. to this time means that the spline fits most points
(a) In very small samples, V
SA<1 volt, even by definition. The results are shown in Fig. 6 and with balanced capillary flows,d45 increased with a trend (significant at the 1% level ) is evident. increasing sample size, attributed to unstable
The trend is represented by a polynomial fit of operation as flow in the capillaries enters a non- the form used by Lang (1991), (which results in a viscous regime at low pressures.
marginally higher correlation than a linear regres-(b) Increasingd45 with increasing sample size sion, r2=0.16 c.f. 0.12). The polynomial is close was also documented for sample pressures (indi- to zero above 3.8 volts, which is the mean sample cated by V
SA) less than reference gas pressure (VST) size for the blank tests, and reflects the general and vice-versa. In typical operation the reported features of a pressure imbalance effect, in particu-V
SA/VST ratio (determined on the second of 4–8 lar, larger corrections at smaller sample sizes. cycles of reference-sample) in our MAT252 is
In these data, VSA is always <VST, and data around 0.9, and is accompanied by slightly differ- are rejected for V
SA/VST<0.8 (4 samples). The ent depletion rates for sample and reference gas. remaining data are corrected using the polynomial, For constant VSA/VST ratios, Lang (1991) used a adjusted to be zero at 4 volts which is the nominal second-order polynomial to describe the increase sample size for routine flask samples and air in d45 with increasing VSA (smaller changes at standard analyses.
higher VSA); the effect is larger for lower VSA/VST. (c) A competing effect, decreasing d45 with increasing V
SA, which was subsequently attributed to a mixing between reference and sample gas in the source region of our MAT252 mass spectro-meter (Francey and Allison, 1994). Subsequent to (and at least in part as a result of ) these experi-ments, Finnigan-MAT GmbH modified the source region of the MAT252 in a way which substantially reduced this effect. Symptoms of the working gas effect are a bias in values towards the reference gas isotopic ratio, the size of which depends on the flushing time (‘‘idle time’’) between reference and sample integrations, and the capillary flow (‘‘sample size’’). In this context, the d13C of the working gas given in eqn. (2) is extremely
fortuit-ous, being, at−6.4‰, very close to the measured Fig. 6. Sample size dependency in the residuals of the pre-industrial CO
2 isotope ratio (d45 differences initially obtained Law Dome ice corea smoothing spline fit to the data. The spline fit isd13C record from range from −1‰ in modern larger samples to
weighted according to data density and has an effective
around−0.1‰ in the older, and smaller, samples,
smoothing with half-width around 25 years, after
which result in relatively uniform corrections over
1800 AD. The polynomial fit (y=−0.008x2+0.081x
the whole range). Thus, the potentially large cor- −0.180) adequately represents the capillary imbalance rections are negligible in this case. process thought to be the main contributor to the sample
size effect.
pro-8.6. Summary of data selections and corrections tainty is appropriate for all samples. In fitting the data to obtain a Law Dome curve (firn and ice) We distinguish here between the uncertainty
we have allowed slightly larger uncertainties of associated with an individual measurement, and
±0.05‰ on the shallowest ice core sample that associated with systematic biases between one
(DE08-2 012) and deepest firn sample (85 m depth) group of measurements and another (specifically
reflecting the difficulties in extracting air from the between ice cores, between ice cores and firn, and
respective media in the transition region. between these and global tropospheric
measure-Errors in the systematic corrections necessary ments). Individual uncertainties are estimated
to obtaind13C of the ice core air from measured from statistical scatter in measurements, except
d45 are more complicated. The maximum correc-for documented anomalies, which are assigned
tions are often large compared to the scatter in (somewhat arbitrarily) larger uncertainties. These
the record provided here. The magnitudes of the are used to weight points when obtaining
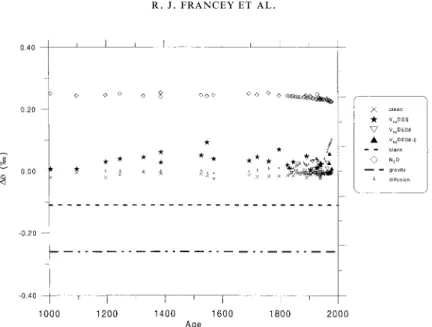
successive additive corrections are summarised in smoothed curves for inversion studies (the relative
Fig. 7, and are briefly assessed for importance here weights being more important than the actual
in the order that they have been applied: weights). The systematic biases between sets of
$ The average sample size correction in the
data are not included in smoothing processes but
selected ice core data is 0.032±0.023, are estimated and referred to in the discussion.
0.004±0.015, 0.017±0.021‰ for DSS, DE08, Of the 84 Law Dome ice core CO
2 values DE08-2, respectively. The standard deviations reported by Etheridge et al. (1996), 11 samples
represent the range of sample sizes measured, were not analysed for d13C; and 58 provided
which is larger for the generally smaller DSS reasonable d13C values. The 15 rejected values
samples (which also have the largest mean included:
correction). We assume that errors in the correc-tion are included in the estimates of uncertainty
$ 1 failed analysis attempt;
in Table 3, below. The corrections are relative
$ 4 samples were rejected on the basis of
sample-to a 4 volt signal which is very similar sample-to that reference capillary imbalance of VSA/VST<0.8,
for firn and other routine flask samples, adding
$ of 23 analyses influenced by ethanol
contamina-no additional uncertainty between ice and tion, 10 (including 1 VSA/VST<0.8) consisted of other samples.
only 1 acceptable cycle of sample-reference
com-$ The bleed correction of−0.009±0.006‰
over-parison and have an estimated statistical
uncer-all is similar for uncer-all three cores, and flask samples tainty of around±0.1‰.
and introduces no further uncertainty.
$ The17O correction, not shown in Fig. 7, is large
(These points are not tabulated or used, but for
perspective, are included as background points in and variable, 0.031±0.088‰. However, this is solely determined by the mass 46 ion current Fig. 9, below).
Three other ethanol-affected samples provided and a fixed tropospheric 17O/18O relationship and does not introduce significant uncertainty. 2 acceptable sample-reference comparisons, and
10 provided 3 comparisons. These have been $ The blank correction, taken as a constant
−0.11‰, was determined to a precision of allocated statistical uncertainties of±0.07‰ and
±0.05‰, respectively. ~0.025‰. This is an additional uncertainty in
the overall value of ice core samples relative to For the remaining accepted ice core samples,
we allocate a minimum measurement uncertainty firn and CGAA samples The overall magnitude is dependent on our hypothesis of a pressure of ±0.025‰. The mass spectrometer assigns a
standard deviation,sn, where n is the number of dependent fractionation during sample extrac-tion in the MAT252 MT trapping box. sample-reference comparisons (for the accepted
ice core samples, the mean sn is±0.016‰). The $ The N
2O correction of +0.238±0.007‰ is determined by the measured N2O/CO2 values ±0.025‰ value allows for the additional standard
deviation of±0.017‰ measured in the blank tests and is well determined with negligible scatter.
$ The mean gravitational correction of−0.26‰,
on the trap volumes. Where the |s
n |>0.025, the
actual sn is used (3 samples). For the firn and is uncertain due to the difficulty in identifying exactly when diffusion ceases and trapping archive samples, a conservative ±0.02‰
uncer-. . . 184
Fig. 7. The magnitude and sign of corrections made to measurements of ice core aird45 to get d13C, plotted as a function of CO
2age of the sample. The ion correction for17O is not shown (see text).
occurs, and in this case, by the conflicting $ Empirical checks for dependence of d13C on
analysis date or on ‘‘anomalous’’ carbon mon-measurements derived fromd15N at the deepest
firn layers (~0.31‰) compared to d15N meas- oxide measured in the samples, which can be sensitive to contamination, yielded no signific-ured in DSS ice bubbles (~0.22‰). We note
the very preliminary nature of our d15N ant dependency.
measurement techniques, compared to d13C. While the blank and gravitational corrections However, by using model values for both firn
add uncertainty to the relative values between and ice we estimate the firn versus ice uncer- cores and the firn, we note that in Fig. 8 below, tainty at <0.03‰, and the DE08 versus DSS
there is no evidence of offset between the 3 ice-uncertainty at something less than this. The cores in the period of overlap. The comparison of sample-to-sample scatter in one core is not
the Law Dome results with measurements at other known but assumed small due to the relatively
sites is limited to a few hundredths of a per mil constant accumulation at the Law Dome site.
by knowledge of spatial gradients. The comparison The uncertainty of Law Dome measurements
of any GASLAB d13C analysis with those from relative to the troposphere from this correction other laboratories is limited by intercalibration is also estimated at<0.03‰.
uncertainties which are <0.04‰ with NOAA/
$ The diffusion correction varies from near zero
CMDL (Masarie et al., in preparation) but maybe pre-industrially (average 0.009±0.014‰ in
as large as 0.1‰ with other laboratories. DSS) to around 0.1‰ in the shallowest ice
(0.037±0.021, 0.065±0.038‰ in DE08, DE08-2
respectively), Trudinger et al. (1997). The per- 9. Results
centage uncertainty in the diffusion correction
is mainly determined by uncertainty in the CO2 A tabulation of the fully corrected results for the Cape Grim Air Archive, the DE08-2 firn and growth rate in the atmosphere, and overall, the
uncertainty is estimated here to be small, the DE08, DE08-2 and DSS ice cores is given in Tables 1–3. Fig. 8 focuses on the comparison of <0.02%. There are similar considerations
con-cerning firn-to-ice transition as for the gravita- the various records since 1800 AD. The full Law Dome isotopic record is plotted in Fig. 9. Error tional correction, but the uncertainty is
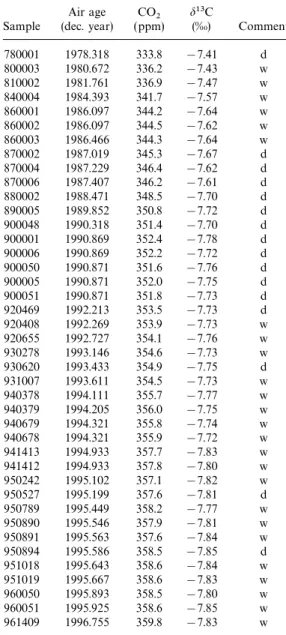
Table 1. d13C in atmospheric CO2from the Cape Grim Air Archive
Air age CO2 d13C
Sample (dec. year) (ppm) (‰) Comment 780001 1978.318 333.8 −7.41 d 800003 1980.672 336.2 −7.43 w 810002 1981.761 336.9 −7.47 w 840004 1984.393 341.7 −7.57 w 860001 1986.097 344.2 −7.64 w 860002 1986.097 344.5 −7.62 w 860003 1986.466 344.3 −7.64 w 870002 1987.019 345.3 −7.67 d 870004 1987.229 346.4 −7.62 d 870006 1987.407 346.2 −7.61 d Fig. 8. The overlap between d13C in atmospheric CO2
880002 1988.471 348.5 −7.70 d from, the Cape Grim Air Archive, firn at DE08-2 and
890005 1989.852 350.8 −7.72 d ice cores DE08, DE08-2 and DSS, Law Dome,
900048 1990.318 351.4 −7.70 d Antarctica. The smoothing spline is weighted by the
900001 1990.869 352.4 −7.78 d statistical error in, and density of, data; effective
900006 1990.869 352.2 −7.72 d smoothing is 25 years after 1800 AD and ~130 years
900050 1990.871 351.6 −7.76 d before 1800 AD. Two points (bracketed), corresponding
900005 1990.871 352.0 −7.75 d to the only 1995 DE08-2 analyses, are considered outliers
900051 1990.871 351.8 −7.73 d and do not contribute to the spline.
920469 1992.213 353.5 −7.73 d 920408 1992.269 353.9 −7.73 w 920655 1992.727 354.1 −7.76 w
A smoothing spline is shown (Enting et al.,
930278 1993.146 354.6 −7.73 w
1987) in which the degree of smoothing is deter- 930620 1993.433 354.9 −7.75 d mined by weighting with the allocated errors in 931007 1993.611 354.5 −7.73 w Table 3. Prior to 1800 AD, when data density is 940378 1994.111 355.7 −7.77 w 940379 1994.205 356.0 −7.75 w
~2/century (compared to ~20/century after
940679 1994.321 355.8 −7.74 w
1800 AD) the weighting is reduced by a factor of
940678 1994.321 355.9 −7.72 w
10. Typical smoothing periods are 130 years and
941413 1994.933 357.7 −7.83 w
25 years, respectively. We also note here that the 941412 1994.933 357.8 −7.80 w spline fit through the data in Fig. 8 has ignored 950242 1995.102 357.1 −7.82 w
two DE08-2 points, bracketed. These two points 950527 1995.199 357.6 −7.81 d
950789 1995.449 358.2 −7.77 w
are the only DE08-2 points measured in 1995 and
950890 1995.546 357.9 −7.81 w
are the most significant outliers. While there is no
950891 1995.563 357.6 −7.84 w
evidence for 1993 versus 1995 analysis differences
950894 1995.586 358.5 −7.85 d
in DE08 and DSS cores, we discount the 1995
951018 1995.643 358.6 −7.84 w
DE08-2 points in the following discussion. 951019 1995.667 358.6 −7.83 w
Note that the ice core CO2 concentrations 960050 1995.893 358.5 −7.80 w
960051 1995.925 358.6 −7.85 w
reported here are a constant 0.2 ppm less than
961409 1996.755 359.8 −7.83 w
those of Etheridge et al. (1996), reflecting adjust-ment of all CSIRO GASLAB measureadjust-ments onto
The data have been deseasonalised using a seasonality
the WMO X93 mole fraction calibration scale.
determined from a harmonic fit to flask records; the comment column indicates whether the air was dried on filling (d) or the tank was filled ‘‘wet’’ (w). The uncertainty
10. Discussion on data points is conservatively estimated at±0.02‰. The CO2mixing ratios are expressed on the WMO X93 mole fraction calibration scale.
The Cape Grim records from the in situ pro-gram and the Cape Grim Air Archive are in excellent agreement with each other in Fig. 3, and closely agree in trend with the DE08-2 firn data
. . . 186
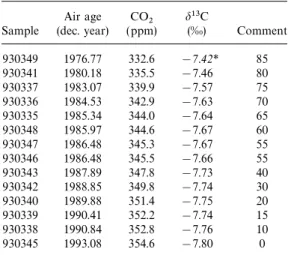
Table 2. d13C in atmospheric CO2 from the L aw gradient of~0.04‰ observed between Tasmania and the coast of Antarctica on a number of (mainly Dome firn at DE08-2
summer) ship transects (Beggs, 1996). The lower
Air age CO2 d13C coastal Antarctica ship values are attributed to a Sample (dec. year) (ppm) (‰) Comment 13C disequilibrium flux with the oceans which
varies due to the temperature dependence in the
930349 1976.77 332.6 −7.42* 85
air-sea fractionation factor (Mook et al., 1974);
930341 1980.18 335.5 −7.46 80
the sea surface temperatures on the coast of
930337 1983.07 339.9 −7.57 75
930336 1984.53 342.9 −7.63 70 Antarctica are>10°C lower than at Cape Grim.
930335 1985.34 344.0 −7.64 65 Keeling et al. (1989b), using a 3D model of 930348 1985.97 344.6 −7.67 60 atmospheric transport, estimate a difference of 930347 1986.48 345.3 −7.67 55 ~0.04‰, but their assumption of constant mixed 930346 1986.48 345.5 −7.66 55
layer d13C means this is an upper limit. Rayner
930343 1987.89 347.8 −7.73 40
and Law (personal communication) estimate a
930342 1988.85 349.8 −7.74 30
930340 1989.88 351.4 −7.75 20 difference of ~0.024‰, also using a 3D model
930339 1990.41 352.2 −7.74 15 with prescribed sources. There are quantitative 930338 1990.84 352.8 −7.76 10 uncertainties associated with each of these 930345 1993.08 354.6 −7.80 0
approaches, including the degree to which the Law Dome sites, some 150 km inland, reflect the
The firn CO
2 age has been determined from a firn oceanic draw down. Uncertainties in the mean diffusion model calibrated against several species
meas-ured in the firn (Trudinger et al., 1997). The uncertainty gravitational correction have a similar influence.
on data points is conservatively estimated at±0.02‰, In the present context we conclude that the
except for the deepest value (asterisked) which is assigned observed difference between firn and Cape Grim ±0.05‰. The CO2 mixing ratios are expressed on the
is consistent with expectation (sampling at Casey
WMO X93 mole fraction calibration scale.
station at 66°S, 110°E, has commenced to verify this result).
While the main purpose of this paper is to present and document the 1000 yeard13C record, (Fig. 5). We note that the age spread of air in the
firn increases from <1 year at the surface to preliminary comment is made on major features. The 1000-yeard13C record in Fig. 9 exhibits sys-12.5±1.5 years at the deepest layers in DE08-2
(Levchenko et al., 1997). Thus, while the d13C tematic variability on several time-scales. The overall decrease during the last 1–2 centuries is flattening in the 1990s is evident in the firn record,
possible large inter-annual variability around 1984 attributed to anthropogenic emissions. Maximum d13C occur during a 1600–1800 AD period, (such as that reported in the atmosphere by
Keeling et al., 1995) will be smoothed by diffusion reported by Etheridge et al. (1996) as a ~6 ppm CO2 decrease and linked to ‘‘the little ice age’’ and mixing at deeper layers. The firn profile is
therefore not able to distinguish between the (LIA). Thed13C enhancement during this period provides a clear example of the additional con-Keeling et al. and the Cape Grim in situ versions
of the atmospheric record in the early 1980s. The straints on the carbon cycle provided by thed13C measurements. Trudinger et al. (1999) use a box Air Archive supports the Cape Grim in situ record
through this period, but does not conclusively diffusion model constrained by these data to dem-onstrate that a global CO2 response resulting from resolve the main conflict with Keeling et al. since
the CGAA record basically depends on one tank the influence of decreased temperature (~1°C) on terrestrial biota (influencing both respiration and in 1984.
Though the trends agree well, the Cape Grim photosynthesis) adequately explains both the CO2 andd13C ice core records. In contrast the response data are, on average, 0.015‰ higher than the fully
corrected firn record. We note however, that there to similar oceanic surface cooling is to give a CO2 decrease but also decreasedd13C. This result isol-is no significant difference between Cape Grim
and South Pole data as measured by the CSIRO ates global cooling during the LIA, which would be expected in the sea-surface temperatures, program (not shown). The difference between Cape
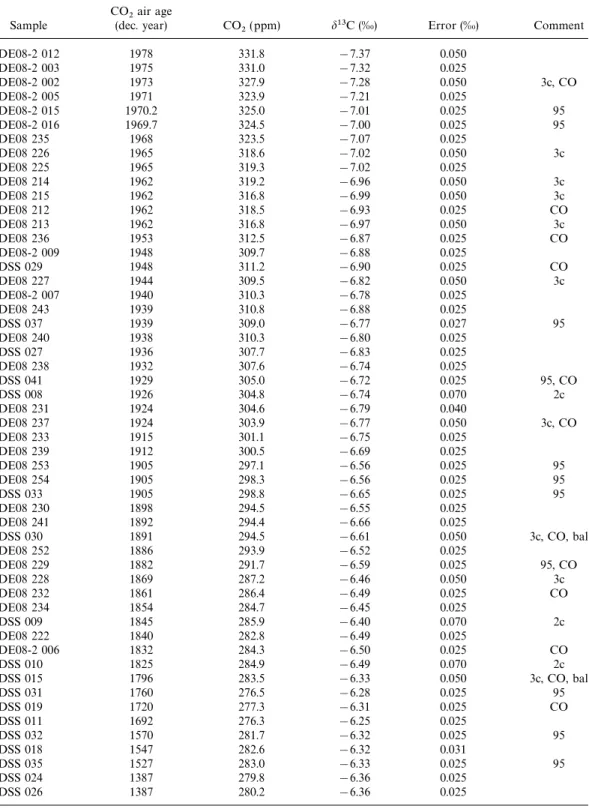
Table 3. d13C in atmospheric CO2from the Antarctic ice cores DE08, DE08-2 and DSS
CO 2air age
Sample (dec. year) CO
2(ppm) d13C (‰) Error (‰) Comment DE08-2 012 1978 331.8 −7.37 0.050 DE08-2 003 1975 331.0 −7.32 0.025 DE08-2 002 1973 327.9 −7.28 0.050 3c, CO DE08-2 005 1971 323.9 −7.21 0.025 DE08-2 015 1970.2 325.0 −7.01 0.025 95 DE08-2 016 1969.7 324.5 −7.00 0.025 95 DE08 235 1968 323.5 −7.07 0.025 DE08 226 1965 318.6 −7.02 0.050 3c DE08 225 1965 319.3 −7.02 0.025 DE08 214 1962 319.2 −6.96 0.050 3c DE08 215 1962 316.8 −6.99 0.050 3c DE08 212 1962 318.5 −6.93 0.025 CO DE08 213 1962 316.8 −6.97 0.050 3c DE08 236 1953 312.5 −6.87 0.025 CO DE08-2 009 1948 309.7 −6.88 0.025 DSS 029 1948 311.2 −6.90 0.025 CO DE08 227 1944 309.5 −6.82 0.050 3c DE08-2 007 1940 310.3 −6.78 0.025 DE08 243 1939 310.8 −6.88 0.025 DSS 037 1939 309.0 −6.77 0.027 95 DE08 240 1938 310.3 −6.80 0.025 DSS 027 1936 307.7 −6.83 0.025 DE08 238 1932 307.6 −6.74 0.025 DSS 041 1929 305.0 −6.72 0.025 95, CO DSS 008 1926 304.8 −6.74 0.070 2c DE08 231 1924 304.6 −6.79 0.040 DE08 237 1924 303.9 −6.77 0.050 3c, CO DE08 233 1915 301.1 −6.75 0.025 DE08 239 1912 300.5 −6.69 0.025 DE08 253 1905 297.1 −6.56 0.025 95 DE08 254 1905 298.3 −6.56 0.025 95 DSS 033 1905 298.8 −6.65 0.025 95 DE08 230 1898 294.5 −6.55 0.025 DE08 241 1892 294.4 −6.66 0.025 DSS 030 1891 294.5 −6.61 0.050 3c, CO, bal DE08 252 1886 293.9 −6.52 0.025 DE08 229 1882 291.7 −6.59 0.025 95, CO DE08 228 1869 287.2 −6.46 0.050 3c DE08 232 1861 286.4 −6.49 0.025 CO DE08 234 1854 284.7 −6.45 0.025 DSS 009 1845 285.9 −6.40 0.070 2c DE08 222 1840 282.8 −6.49 0.025 DE08-2 006 1832 284.3 −6.50 0.025 CO DSS 010 1825 284.9 −6.49 0.070 2c DSS 015 1796 283.5 −6.33 0.050 3c, CO, bal DSS 031 1760 276.5 −6.28 0.025 95 DSS 019 1720 277.3 −6.31 0.025 CO DSS 011 1692 276.3 −6.25 0.025 DSS 032 1570 281.7 −6.32 0.025 95 DSS 018 1547 282.6 −6.32 0.031 DSS 035 1527 283.0 −6.33 0.025 95 DSS 024 1387 279.8 −6.36 0.025 DSS 026 1387 280.2 −6.36 0.025
. . . 188
Table 3. (Cont’d.)
CO 2air age
Sample (dec. year) CO
2(ppm) d13C (‰) Error (‰) Comment DSS 034 1327 283.2 −6.36 0.025 95 DSS 039 1246 281.5 −6.36 0.025 95, CO DSS 036 1196 283.7 −6.36 0.025 95, CO DSS 042 1096 282.2 −6.41 0.025 95, CO DSS 038 1006 279.2 −6.44 0.025 95, CO
Iced13C errors have been estimated as described in the text. Comments on the ice core d13C refer to the number of sample-reference integrations (2c, 3c), analysis in the 1995 session (all others 1993), suspect pressure imbalance through sample and reference capillaries (bal, 0.8<VSA/VST<0.9), or enhanced carbon monoxide in the sample (>75 ppb). Note: no influence of enhanced CO or analyis year on d13C is evident.
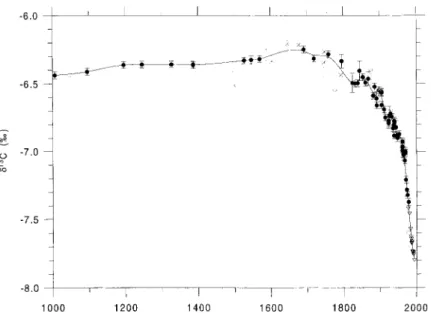
Fig. 9. The complete record of CO
2 and d13C from the Law Dome ice cores and firn. The smoothing spline is weighted by the statistical error in, and density of, data; effective smoothing is 25 years after 1800 AD and ~130 years before 1800 AD. (Light grey symbols are rejected points from the section ‘‘Summary of data selections and corrections’’ and are included here only to provide a perspective on the selection processes. Crosses indicate ethanol contaminated samples, open circles are other rejections).
masses of the northern hemisphere, a result con- via the mixed layer DIC d13C provided by the Trudinger et al. box diffusion model (which is tuned sistent with reported European and Asian
histor-ical records, as well as a high precision CH4 record primarily to 14C data but also gives good agreement withd13C atmospheric record from this study). from these ice cores (Etheridge et al., 1998).
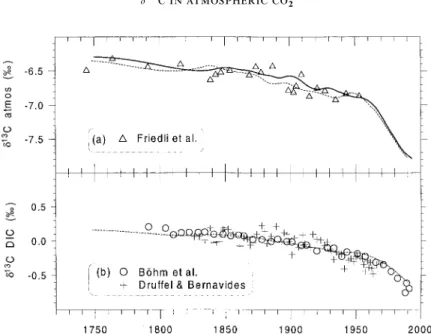
It is apparent that the ice core results presented The comparison between the model tropo-spheric d13C (derived from the Etheridge et al. here are not compatible with trends reported from
tree ring and coral records. They are more consistent CO
2data) and model global DIC variations shows the marked suppression of temporal variation in with early, less precise, ice core determinations
reported by Friedli et al. (1986), see Fig. 10a. The the ocean mixed layer due to the different buffering of the 12C signal compared to 13C, discussed only century-scale record with comparable small
scatter to our data are the recent ocean DIC data of further below. The Bo¨hm et al. (1996) DIC curve gives slightly more overall change (~0.1‰) in Bo¨hm et al. (1996). These are compared in Fig. 10b