HAL Id: inserm-00371003
https://www.hal.inserm.fr/inserm-00371003
Submitted on 8 Mar 2010
HAL is a multi-disciplinary open access archive for the deposit and dissemination of sci-entific research documents, whether they are pub-lished or not. The documents may come from teaching and research institutions in France or abroad, or from public or private research centers.
L’archive ouverte pluridisciplinaire HAL, est destinée au dépôt et à la diffusion de documents scientifiques de niveau recherche, publiés ou non, émanant des établissements d’enseignement et de recherche français ou étrangers, des laboratoires publics ou privés.
Non-response to baseline, non-response to follow-up and
mortality in the Whitehall II cohort.
Jane Ferrie, Mika Kivimäki, Archana Singh-Manoux, Alison Shortt, Pekka Martikainen, Jenny Head, Michael Marmot, David Gimeno, Roberto de Vogli,
Marko Elovainio, et al.
To cite this version:
Jane Ferrie, Mika Kivimäki, Archana Singh-Manoux, Alison Shortt, Pekka Martikainen, et al.. Non-response to baseline, non-Non-response to follow-up and mortality in the Whitehall II cohort.. International Journal of Epidemiology, Oxford University Press (OUP), 2009, 38 (3), pp.831-7. �10.1093/ije/dyp153�. �inserm-00371003�
Non-response to baseline, non-response to follow-up and mortality in the Whitehall II cohort
Running head: Non-response and mortality
Jane E. Ferrie1, Mika Kivimäki1,2, Archana Singh-Manoux1,3, Alison Shortt1, Pekka Martikainen1,4, Jenny
Head1, Michael Marmot1, David Gimeno1, Roberto de Vogli1, Marko Elovainio2, Martin J. Shipley1
1 Department of Epidemiology and Public Health, University College London, United Kingdom 2 Finnish Institute of Occupational Health, Helsinki, Finland
3 INSERM, U687-IFR69, France
4 Helsinki Collegium for Advanced Studies, University of Helsinki, Finland
Correspondence and reprint requests to Jane Ferrie, Senior Research Fellow, Department of Epidemiology and Public Health, University College London, 1 19 Torrington Place, London WC1E 6BT, U.K. e mail j.ferrie@public-health.ucl.ac.uk telephone (+44 207) 679 5643 fax (+44 207) 419 6732
Non-response and mortality in a study with multiple follow-up surveys: Whitehall II
Running head: non-response and mortality
Abstract
Background:
Little is known about the associations between non-response to follow-up surveys and mortality, or differences in these associations by socioeconomic position in studies with repeat data collections.Methods:
The Whitehall II study of socioeconomic inequalities in health provided response status from five data collection surveys; Phase 1 (1985-88, n=10 308) – Phase 5 (1997-99, n=6 533), and all-cause mortality to 2006. Odd-numbered phases included a medical examination in addition to a questionnaire.Results:
Non-response to baseline and to follow-up phases that included a medical examination was associated with a doubling of the mortality hazard in analyses adjusted for age and sex. Compared with complete responders, responders who missed one or more phases, but completed the last possible phase before they died, had a 38% excess risk of mortality. However, those who missed one or more phases including the last possible phase before death had an excess risk of 127%. There was no evidence that these associations differed by socioeconomic position.Conclusion:
In studies with repeat data collections non-response to follow-up is associated with the same doubling of the mortality risk as non-response to baseline; an association that is not modified by socioeconomic position.Keywords:
non-response to follow-up, partial response, socioeconomic inequalities, all-cause mortality, occupational cohort, white-collarMost observational epidemiology studies rely on participation of the target population to obtain data on risk exposures and health outcomes. If non-response at baseline is non-random, findings from such studies may be biased. In prospective studies with repeat data collections the problem of bias introduced by non-response to the baseline survey may be compounded by non-response to follow-up surveys. Many studies have compared mortality risks between responders and non-responders to baseline, with most,1-14 but not all,15 providing strong evidence of higher rates of mortality among non-responders.
However, it is considered that observational epidemiologists have paid insufficient attention to response bias in cohort studies.16 Unresolved issues include associations between partial response or non-response
to follow-up and mortality in studies with successive data collections, and differences in these
associations by socioeconomic position. Socioeconomic position is important for two reasons: one, as a confounder in aetiological studies and two, as an exposure in studies of social inequalities in health.17 If
the association between non-response and mortality were to differ across the socioeconomic strata residual confounding might remain a problem for aetiological studies, even after adjustment for socioeconomic position, and analyses of socioeconomic inequalities might be biased.
This paper uses data from the Whitehall II study which was set up to explain socioeconomic gradients in health.18;19 The paper has two main aims: 1) to examine associations between non-response or partial
response to repeat surveys subsequent to baseline and mortality; and 2) to examine associations between non-response and mortality by socioeconomic position.
METHODS
The target population for Whitehall II was all London-based office staff aged 35-55 working in 20 civil service departments in 1985 (n=14,121). Baseline screening (Phase 1, 1985-1988) involved a medical examination and a self-administered questionnaire. Subsequent to baseline, odd-numbered data collection phases have included both a medical examination and a questionnaire, while even-numbered phases have been questionnaire only (Box 1).
Response status: Phase 1: Of the target population 10,308 people (3,413 women and 6,895 men) were responders to baseline. Invitations to participate in follow-up phases were extended only to these baseline responders. Phases 2 and 4: Responders at these Phases completed a full questionnaire. From Phase 4, response was augmented in the last resort through a short-form telephone interview consisting of selected questions from the questionnaire; such participants were categorized as partial (telephone) responders. Phases 3 and 5: Responders at these Phases attended the medical examination; partial (questionnaire) responders completed a questionnaire, but did not attend the medical examination; and partial (telephone) responders completed the short-form telephone interview only. We created a single, time dependent, response status summary measure using all available data from Phases 1 to 5. The measure has four categories which indicate the cumulative response status at each of the five phases.
Response status summary measure: (1) completed all possible phases (all five phases, or all phases prior to death if this occurred before Phase 5): (2) responders to Phase 1 who subsequently were
non-responders at one or more phases, but responded at their last possible phase i.e. the last phase they could have attended up to that point in time: (3) responders to Phase 1 who subsequently were responders at one or more phases, including their last possible phase; and (4) baseline (Phase 1) non-responders.
All-cause mortality:Mortality data were obtained from the National Health Services Central Registry. The analyses of non-response to follow-up and partial-response to follow-up include the 10,308 responders to baseline from all the 20 departments that make up the Whitehall II study. Of these 99.9% (10,297) have been followed for mortality. Mortality data were available for non-responders to baseline in 14 of the 20 departments that make up the Whitehall II study. Effective tracing of non-responders to baseline in the 6 remaining departments was impossible due to insufficient information.
Covariates: Information on age, sex and employment grade at baseline was derived from the Phase 1 questionnaire for responders and from Civil Service department files for non-responders. Civil Service employment grade was classified into high (senior administrators), intermediate (executives,
professionals and technical staff) and low (clerical and office support staff). As of August 1992 the salary range among high grade employees was £25 330 - £87 620 (Euro 32 583 - 112 680, US$ 44 428 - 153 622) and among low grade employees £7 387 – £11 917 (Euro 9 498 - 15 322, US$ 12 949 - 20 895).18;19
Statistical methods
Associations between response status and mortality are presented as mortality rates per 1,000 person years, or hazard ratios (HRs) and 95% CIs determined using Cox proportional hazard models with follow-up as the time-scale and responders as the reference category. Person years of follow follow-up were computed as follows: for responders, the start of follow-up (Phase 1) was their date of screening while for
subsequent phases it was the date of first participation in that phase. For non-responders, the start of follow-up (Phase 1) was taken as the date that screening began for those who worked in the same building, while for subsequent phases the midpoint date for the responders was used. Participants were followed for mortality up to 31st July 2006 or their date of death (8%), embarkation (1%) or
deregistration with a health authority (1%). For all analyses that included the non-responders at Phase 1, an indicator variable was included in the models to distinguish and adjust for any mortality differences between responders in the 14 departments that provided mortality data for the non-responders and the 6 departments that did not. As there was no strong evidence of sex differences, pooled estimates are presented. The cumulative effect of non-response across phases was assessed using the response status summary measure updated at each phase and fitted as a time dependent variable. The estimates are
presented as hazard ratios (HR) and 95% CIs for the total cohort and separately by employment grade category.
RESULTS
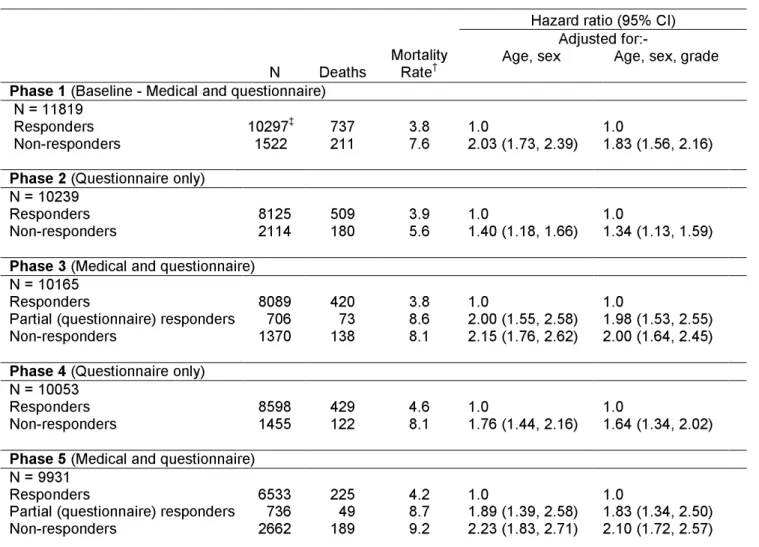
The age and sex-adjusted, all-cause mortality hazard for Phase 1 non-responders is double that for Phase 1 responders (Table 1). Non-response to follow-up at Phases 3 and 5 is associated with an increased hazard similar to that associated with Phase 1 non-response, but non-responders to Phases 2 and 4 (questionnaire-only phases) have lower HRs.
Partial response: There was no evidence that the HR for mortality among partial (questionnaire)
responders at Phase 3 (medical screening phase) was different from that for Phase 3
non-responders
. At Phase 4 (questionnaire only) there was no evidence that the HR for mortality among partial(telephone) responders, HR (95% CIs) 1.15 (0.79-1.67), was different to that for Phase 4
responders
. At Phase 5 (medical screening phase) the HR for mortality among partial (telephone) responders (2.08, 1.45-2.98), did not differ from that for partial (questionnaire) responders (1.89, 1.38-2.58), and both were no different to that for Phase 5non-responders
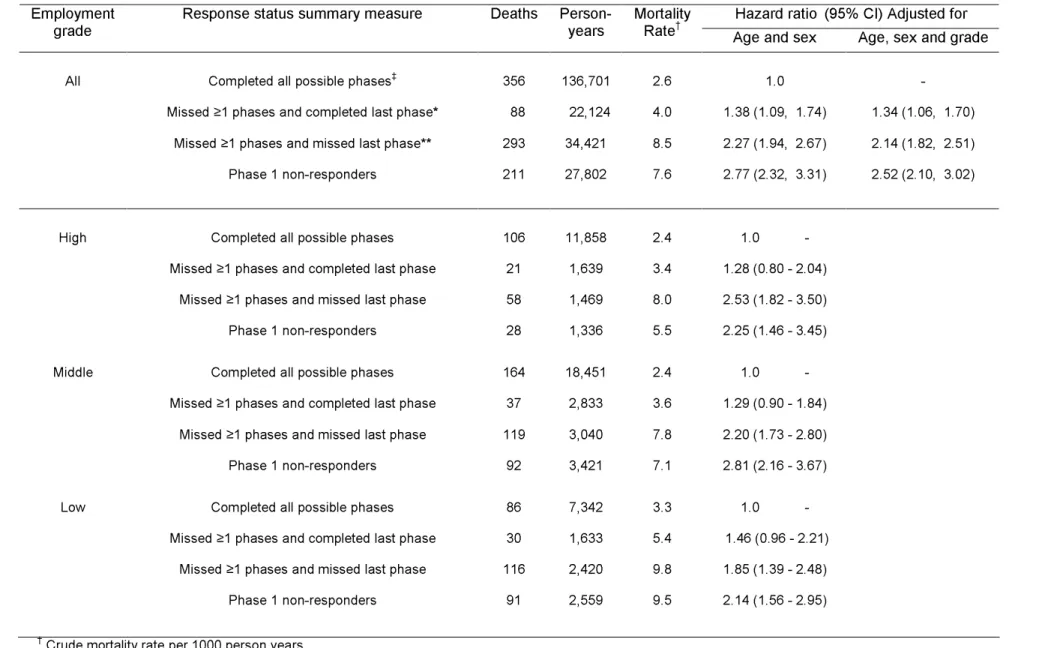
(2.23, 1.83-2.71). Adjustment of the HRs for non-responders and partial non-responders for employment grade gave estimates only marginally below those adjusted for age and sex.Non-response: Table 2 presents associations between the response status summary measure and mortality. Due to similar HRs for mortality between partial responders and non-responders at medical examination phases, and between partial (telephone) responders and responders at questionnaire phases, partial responders and non-responders are combined at Phases 3 and 5, while partial responders and responders are combined at Phase 4. Compared to participants who completed all possible follow-up surveys, the HR for mortality among non-responders at Phase 1 was 2.77 (2.32-3.31) - Table 2, upper section. The HR was 2.27 (1.94-2.67) among those who were non-responders at one or more subsequent phases and non-responders at their last possible phase, but 1.38 (1.09-1.74) among those who were non-responders at subsequent surveys but responders at their last possible phase. Adjustment for employment grade had little effect on these findings and analyses of associations between the response status summary measure and mortality within each of the three employment grade categories provided no evidence that associations differ by socioeconomic position - Table 2, lower section.
Non-response to last survey: As indicated above, missing one or more follow-up surveys was associated with an excess mortality risk of only 38% (p=0.007) provided the last possible survey had been
completed. To quantify the additional mortality risk associated with non-response to the last possible survey we undertook further analyses in which responders who missed one or more phases including the last possible phase were compared with those who either completed all their possible phases or who missed one or more phases but completed their last possible phase. This comparison showed that the
additional mortality risk associated with missing the last possible phase was over 100%, HR 2.02 (1.73 - 2.36), p<0.001.
DISCUSSION
The key finding of this paper is that non-response to clinical follow-up was associated with the same doubling of the mortality risk as non-response to baseline. Non-response to one or more follow-up surveys was associated with a 1.4-fold excess risk among those who responded to their last possible survey, but a 2.3-fold excess risk among those who missed their last possible survey. We also found that excess mortality risk is negligible among partial responders to questionnaire only surveys, but similar to that for non-responders for participants who miss a medical examination but respond partially through questionnaire completion. In addition, the study examined non-response by socioeconomic position and found no evidence that socioeconomic position modifies the association between non-response and mortality. Our findings that non-responders to baseline had a mortality hazard double that for responders is in line with findings from previous studies.2;5;7-14;20-26
Although a number of studies have reported somewhat higher levels of non-response in low
socioeconomic groups,5;6;23;27-33 few studies have examined whether the effects of non-response differ
across the socioeconomic strata.29;30;33 In the present study, mortality risks among non-responders were
little attenuated by adjustment for socioeconomic position measured by employment grade. Similarly, analyses within grade provided no evidence of differences in the associations between non-response and mortality. Recent findings from the population-based FINRISK surveys similarly observed little
attenuation of the association between non-response to baseline and mortality on adjustment for socioeconomic position, and a two-fold higher mortality risk in non-responders to baseline in every socioeconomic category.14 Studies that have examined morbidity have similarly provided little evidence
that the bias introduced by non-response to baseline differs across socioeconomic strata.29;33
It is implausible that there is a direct association between non-response and mortality, rather it is an association driven by a variety of common causes, for example ill-health, caring and accessibility. Some of these, such as measureable ill-health at baseline, were available for participants in the Whitehall II study, but not for non-responders to baseline, and many others were not measured. Consequently we have chosen to present our analyses adjusted only for age, sex and grade, which were available for everyone included in the analyses. Participants in the Whitehall II study were white-collar civil servants at study entry and covered a wide range of grades with a salary difference of over 10-fold between the top and bottom of the hierarchy. In this respect they are representative of the majority of employees in Western countries. Nonetheless, this work needs to be repeated in general population samples as the generalisability of our findings will be limited by the healthy worker effect at baseline which may produce
Our findings from a study with repeat data collections show the excess mortality associated with non-response to previous follow-up surveys is approximately 1.4-fold if the most recent possible survey is completed, but over 2-fold if it is missed. When collecting questionnaire data only, the health-related selection introduced by the inclusion of partial responders who only complete a short telephone interview is similar to that for those who complete a full questionnaire. This means their inclusion in analyses, while increasing the power of the study, will not reduce the bias associated with complete non-response to follow-up at that phase. However, when data collection includes both a medical and a questionnaire, partial responders who miss the medical examination are similar in health status to those who are complete non-responders. Inclusion in analyses of questionnaire or telephone interview data for these partial responders would thus both increase power and reduce the health-selection bias associated with non-response to follow-up. Our findings regarding partial responders are plausible. Attendance at a medical examination requires much more time and effort than completing a questionnaire or short-form telephone interview at home. Thus, non-response to surveys that include a medical examination outside the home is likely to capture a wider range of the unmeasured common causes of non-response and mortality. Additionally, any association between non-response and mortality may be strengthened further if non-responders miss a diagnosis or treatment that might have been brought to attention by the
medical examination.
With respect to studies designed to examine inequalities in health good news is provided by evidence that socioeconomic position does not modify the association between non-response and mortality.
Ethical approval:
Ethical approval for the Whitehall II study was obtained from the University College London Medical School committee on the ethics of human research.Key messages:
In common with non-response to baseline, mortality among non-responders to clinical follow-up is double that of responders. Non-response to follow-up surveys prior to the most recent survey is associated with a lower excess mortality risk.
Excess mortality risk is negligible among partial responders to questionnaire only surveys, but similar to that for non-responders for participants who miss a medical examination (but have partial response via questionnaire).
Socioeconomic position does not modify the association between non-response and mortality.
Sources of financial support:
The Whitehall II study has been supported by grants from the Medical Research Council; British Heart Foundation; Health and Safety Executive; Department of Health; National Heart Lung and Blood Institute (HL36310), US, NIH: National Institute on Aging (AG13196), US, NIH;Agency for Health Care Policy Research (HS06516); and the John D and Catherine T MacArthur
Foundation Research Networks on Successful Midlife Development and Socio-economic Status and Health. J.E.F. is supported by the Medical Research Council (Grant number G8802774), M.K by the Academy of Finland (project 117604), AS-M is supported by a ‘EURYI’ award from the European Science Foundation and a ‘Chaire d’excellence’ award from the French Ministry of Research, MGM by an MRC Research Professorship, PM is supported by the Academy of Finland and M.J.S. by a grant from the British Heart Foundation.
Acknowledgements:
We thank all participating Civil Service departments and their welfare, personnel, and establishment officers; the Occupational Health and Safety Agency; the Council of Civil Service Unions; all participating civil servants; and all members of the Whitehall II study team. In addition we would like to acknowledge the very constructive contributions of the reviewer.REFERENCES
(1) Dawber TR, Kannel WB, Lyell LP. An approach to longitudinal studies in a community: the Framingham Study. Ann N Y Acad Sci 1963; 107:539-556.
(2) Doll R, Hill AB. Mortality in relation to smoking: Ten years' observations of British Doctors. Br Med J 1964; 5395:1399-1410.
(3) Wilhelmsen L, Ljungberg S, Wedel H, Werko L. A comparison between participants and non-participants in a primary preventive trial. J Chronic Dis 1976; 29:331-339.
(4) Heilbrun LK, Nomura A, Stemmermann GN. The effects of nonresponse in a prospective study of cancer. Am J Epidemiol 1982; 116:353-363.
(5) Walker M, Shaper AG, Cook DG. Non-participation and mortality in a prospective study of cardiovascular disease. J Epidemiol Community Health 1987; 41:295-299.
(6) Benfante R, Reed D, MacLean C, Kagan A. Response bias in the Honolulu Heart Program. Am J Epidemiol 1989; 130:1088-1100.
(7) Heilbrun LK, Nomura A, Stemmermann GN. The effects of non-response in a prospective study of cancer: 15-year follow-up. Int J Epidemiol 1991; 20:328-338.
(8) Strandberg TE, Salomaa VV, Vanhanen HT, Naukkarinen VA, Sarna SJ, Miettinen TA. Mortality in participants and non-participants of a multifactorial prevention study of cardiovascular diseases: a 28 year follow up of the Helsinki Businessmen Study. Br Heart J 1995; 74:449-454.
(9) Berglund G, Nilsson P, Eriksson KF, Nilsson JA, Hedblad B, Kristenson H et al. Long-term outcome of the Malmo preventive project: mortality and cardiovascular morbidity. J Intern Med 2000; 247:19-29.
(10) Hara M, Sasaki S, Sobue T, Yamamoto S, Tsugane S. Comparison of cause-specific mortality between respondents and nonrespondents in a population-based prospective study: ten-year follow-up of JPHC Study Cohort I. Japan Public Health Center. J Clin Epidemiol 2002; 55:150-156. (11) Barchielli A, Balzi D. Nine-year follow-up of a survey on smoking habits in Florence (Italy): higher
mortality among non-responders. Int J Epidemiol 2002; 31:1038-1042.
(12) Jousilahti P, Salomaa V, Kuulasmaa K, Niemela M, Vartiainen E. Total and cause specific mortality among participants and non-participants of population based health surveys: a comprehensive follow up of 54 372 Finnish men and women. J Epidemiol Community Health 2005; 59:310-315. (13) Mattila VM, Parkkari J, Rimpela A. Adolescent survey non-response and later risk of death. A
prospective cohort study of 78,609 persons with 11-year follow-up. BMC Public Health 2007; 7:87.
(14) Harald K, Salomaa V, Jousilahti P, Koskinen S, Vartiainen E. Non-participation and mortality in different socioeconomic groups: the FINRISK population surveys in 1972-92. J Epidemiol Community Health 2007; 61:449-454.
(15) Paul O, Lepper MH, Phelan WH, Dupertuis GW, Macmillan A, McKean H et al. A longitudinal study of coronary heart disease. Circulation 1963; 28:20-31.
(16) Greenland S. Response and follow-up bias in cohort studies. Am J Epidemiol 1977; 106:184-187. (17) Krieger N. Why epidemiologists cannot afford to ignore poverty. Epidemiology 2007; 18:658-663. (18) Marmot MG, Davey Smith G, Stansfeld S, Patel C, North F, Head J et al. Health inequalities
among British civil servants: the Whitehall II study. Lancet 1991; 337:1387-1393.
(19) Rose G, Shipley M. Plasma cholesterol concentration and death from coronary heart disease: 10 year results of the Whitehall study. Br Med J 1986; 293:306-308.
(20) Manjer J, Carlsson S, Elmstahl S, Gullberg B, Janzon L, Lindstrom M et al. The Malmo Diet and Cancer Study: representativity, cancer incidence and mortality in participants and
non-participants. Eur J Cancer Prev 2001; 10:489-499.
(21) Carlsson GS, Svardsudd K. Comparison of participants and non-participants in a population study of injuries. The study of men born in 1913 and 1923. Scand J Soc Med 1985; 13:15-22.
(22) Chou P, Kuo HS, Chen CH, Lin HC. Characteristics of participants and reasons for non-participation in a population survey in Kin-Hu, Kinmen. Eur J Epidemiol 1997; 13:195-200. (23) Drivsholm T, Eplov LF, Davidsen M, Jorgensen T, Ibsen H, Hollnagel H et al. Representativeness
in population-based studies: a detailed description of non-response in a Danish cohort study. Scand J Public Health 2006; 34:623-631.
(24) Bengtsson C, Gredmark T, Hallberg L, Hallstrom T, Isaksson B, Lapidus L et al. The population study of women in Gothenburg 1980-81--the third phase of a longitudinal study. Comparison between participants and non-participants. Scand J Soc Med 1989; 17:141-145.
(25) Bengtsson C, Ahlqwist M, Andersson K, Bjorkelund C, Lissner L, Soderstrom M. The Prospective Population Study of Women in Gothenburg, Sweden, 1968-69 to 1992-93. A 24-year follow-up study with special reference to participation, representativeness, and mortality. Scand J Prim Health Care 1997; 15:214-219.
(26) Garcia M, Fernandez E, Schiaffino A, Borrell C, Marti M, Borras JM. Attrition in a population-based cohort eight years after baseline interview: The Cornella Health Interview Survey Follow-up (CHIS.FU) Study. Ann Epidemiol 2005; 15:98-104.
(27) Bergstrand R, Vedin A, Wilhelmsson C, Wilhelmsen L. Bias due to non-participation and heterogeneous sub-groups in population surveys. J Chronic Dis 1983; 36:725-728.
(28) Forthofer RN. Investigation of nonresponse bias in NHANES II. Am J Epidemiol 1983; 117:507-515.
(29) Van Loon AJ, Tijhuis M, Picavet HS, Surtees PG, Ormel J. Survey non-response in the
Netherlands: effects on prevalence estimates and associations. Ann Epidemiol 2003; 13:105-110. (30) Sogaard AJ, Selmer R, Bjertness E, Thelle D. The Oslo Health Study: The impact of self-selection
in a large, population-based survey. Int J Equity Health 2004; 3:3.
(31) Matthews FE, Chatfield M, Freeman C, McCracken C, Brayne C. Attrition and bias in the MRC cognitive function and ageing study: an epidemiological investigation. BMC Public Health 2004; 4:12.
(32) Goldberg M, Chastang JF, Zins M, Niedhammer I, Leclerc A. Health problems were the strongest predictors of attrition during follow-up of the GAZEL cohort. J Clin Epidemiol 2006; 59:1213-1221.
(33) Martikainen P, Laaksonen M, Piha K, Lallukka T. Does survey non-response bias the association between occupational social class and health? Scand J Public Health 2007; 35:212-215.
Box 1 - Whitehall II Study response rates
Phase of
data
collection
Start – Finish Content
Response Rate
Phase 1
1985 - 1988 Medical & questionnaire (73% of the target population)Phase 2
1989 - 1990 Questionnaire only (79% of responders to Phase 1)Phase 3
1991 - 1994 Medical & questionnaire (86%* of responders to Phase 1)Phase 4
1995 - 1996 Questionnaire only (84%* of responders to Phase 1)Phase 5
1997 - 1999 Medical & questionnaire (76%* of responders to Phase 1)TABLE 1. All-cause mortality by response status at Phase 1 (baseline) and at follow-up Phases 2 to 5, women and men combined
Hazard ratio (95% CI) Adjusted for:-
N Deaths Mortality Rate† Age, sex Age, sex, grade
Phase 1 (Baseline - Medical and questionnaire)
N = 11819
Responders 10297‡ 737 3.8 1.0 1.0
Non-responders 1522 211 7.6 2.03 (1.73, 2.39) 1.83 (1.56, 2.16)
Phase 2 (Questionnaire only)
N = 10239
Responders 8125 509 3.9 1.0 1.0
Non-responders 2114 180 5.6 1.40 (1.18, 1.66) 1.34 (1.13, 1.59)
Phase 3 (Medical and questionnaire)
N = 10165
Responders 8089 420 3.8 1.0 1.0
Partial (questionnaire) responders 706 73 8.6 2.00 (1.55, 2.58) 1.98 (1.53, 2.55)
Non-responders 1370 138 8.1 2.15 (1.76, 2.62) 2.00 (1.64, 2.45)
Phase 4 (Questionnaire only)
N = 10053
Responders 8598 429 4.6 1.0 1.0
Non-responders 1455 122 8.1 1.76 (1.44, 2.16) 1.64 (1.34, 2.02)
Phase 5 (Medical and questionnaire)
N = 9931
Responders 6533 225 4.2 1.0 1.0
Partial (questionnaire) responders 736 49 8.7 1.89 (1.39, 2.58) 1.83 (1.34, 2.50)
Non-responders 2662 189 9.2 2.23 (1.83, 2.71) 2.10 (1.72, 2.57)
† Crude mortality rate per 1000 person years
TABLE 2. All-cause mortality by summary response status stratified by employment grade, women and men combined
Hazard ratio (95% CI) Adjusted for Employment
grade Response status summary measure Deaths Person-years Mortality Rate†
Age and sex Age, sex and grade
All Completed all possible phases‡
356 136,701 2.6 1.0 -
Missed ≥1 phases and completed last phase* 88 22,124 4.0 1.38 (1.09, 1.74) 1.34 (1.06, 1.70)
Missed ≥1 phases and missed last phase** 293 34,421 8.5 2.27 (1.94, 2.67) 2.14 (1.82, 2.51)
Phase 1 non-responders 211 27,802 7.6 2.77 (2.32, 3.31) 2.52 (2.10, 3.02)
Completed all possible phases
106 11,858 2.4 1.0 -
Missed ≥1 phases and completed last phase 21 1,639 3.4 1.28 (0.80 - 2.04)
Missed ≥1 phases and missed last phase 58 1,469 8.0 2.53 (1.82 - 3.50)
High
Phase 1 non-responders 28 1,336 5.5 2.25 (1.46 - 3.45)
Completed all possible phases
164 18,451 2.4 1.0 -
Missed ≥1 phases and completed last phase 37 2,833 3.6 1.29 (0.90 - 1.84)
Missed ≥1 phases and missed last phase 119 3,040 7.8 2.20 (1.73 - 2.80)
Middle
Phase 1 non-responders 92 3,421 7.1 2.81 (2.16 - 3.67)
Completed all possible phases
86 7,342 3.3 1.0 -
Missed ≥1 phases and completed last phase 30 1,633 5.4 1.46 (0.96 - 2.21)
Missed ≥1 phases and missed last phase 116 2,420 9.8 1.85 (1.39 - 2.48)
Low
Phase 1 non-responders 91 2,559 9.5 2.14 (1.56 - 2.95)
† Crude mortality rate per 1000 person years ‡ Phases 1 – 5 or every phase prior to death
* Phase 1 responders who missed ≥1 phases after Phase 1, but completed their last possible phase ** Phase 1 responders who missed ≥1 phases after Phase 1 including their last possible phase