CfAIR2: NEAR-INFRARED LIGHT
CURVES OF 94 TYPE Ia SUPERNOVAE
The MIT Faculty has made this article openly available. Please share
how this access benefits you. Your story matters.
Citation
Friedman, Andrew S., W. M. Wood-Vasey, G. H. Marion, Peter
Challis, Kaisey S. Mandel, Joshua S. Bloom, Maryam Modjaz,
et al. “CfAIR2: NEAR-INFRARED LIGHT CURVES OF 94 TYPE Ia
SUPERNOVAE.” The Astrophysical Journal Supplement Series 220,
no. 1 (September 4, 2015): 9. © 2015 The American Astronomical
Society
As Published
http://dx.doi.org/10.1088/0067-0049/220/1/9
Version
Final published version
Citable link
http://hdl.handle.net/1721.1/100825
Terms of Use
Article is made available in accordance with the publisher's
policy and may be subject to US copyright law. Please refer to the
publisher's site for terms of use.
CFAIR2: NEAR-INFRARED LIGHT CURVES OF 94 TYPE Ia SUPERNOVAE
Andrew S. Friedman1,2, W. M. Wood-Vasey3, G. H. Marion1,4, Peter Challis1, Kaisey S. Mandel1, Joshua S. Bloom5, Maryam Modjaz6, Gautham Narayan1,7,8, Malcolm Hicken1, Ryan J. Foley9,10, Christopher R. Klein5, Dan L. Starr5,
Adam Morgan5, Armin Rest11, Cullen H. Blake12, Adam A. Miller13,15, Emilio E. Falco1, William F. Wyatt1, Jessica Mink1, Michael F. Skrutskie14, and Robert P. Kirshner1
1
Harvard-Smithsonian Center for Astrophysics, 60 Garden Street, Cambridge, MA 02138, USA;asf@mit.edu,pchallis@cfa.harvard.edu,kmandel@cfa.harvard.edu,
gnarayan@noao.edu,malcolmhicken@hotmail.com,efalco@cfa.harvard.edu,wfw781kra@gmail.com,jmink@cfa.harvard.edu,rkirshner@cfa.harvard.edu
2Center for Theoretical Physics and Department of Physics, Massachusetts Institute of Technology, Cambridge, MA 02139, USA 3
Department of Physics and Astronomy, University of Pittsburgh, 100 Allen Hall, 3941 O’Hara Street Pittsburgh, PA 15260, USA;wmwv@pitt.edu
4
Astronomy Department, University of Texas at Austin, Austin, TX 78712, USA;hman@astro.as.utexas.edu
5
Department of Astronomy, University of California Berkeley, Berkeley, CA 94720, USA;joshbloom@berkeley.edu,
cklein@berkeley.edu,dstarr1@gmail.com,amorgan@astro.berkeley.edu
6
Center for Cosmology and Particle Physics, New York University, Meyer Hall of Physics, 4 Washington Place, Room 529, New York, NY 10003, USA;
mmodjaz@nyu.edu
7
Physics Department, Harvard University, 17 Oxford Street, Cambridge, MA 02138, USA 8
National Optical Astronomy Observatory, 950 N. Cherry Avenue, Tucson, AZ 85719, USA 9
Department of Astronomy, University of Illinois at Urbana-Champaign, 1002 W. Green Street, Urbana, IL 61801, USA;rfoley@illinois.edu
10
Department of Physics, University of Illinois at Urbana-Champaign, 1110 W. Green Street, Urbana, IL 61801, USA 11Space Telescope Science Institute, STScI, 3700 San Martin Drive, Baltimore, MD 21218, USA;arest@stsci.edu 12
University of Pennsylvania, Department of Physics and Astronomy, 209 South 33rd Street, Philadelphia, PA 19104, USA;chblake@sas.upenn.edu
13
Jet Propulsion Laboratory, California Institute of Technology, Pasadena, CA 91125, USA;amiller@astro.caltech.edu
14
Department of Astronomy, P.O. Box 400325, 530 McCormick Road, Charlottesville, VA 22904, USA;skrutskie@virginia.edu
Received 2014 August 1; accepted 2015 February 20; published 2015 September 4 ABSTRACT
CfAIR2 is a large, homogeneously reduced set of near-infrared(NIR) light curves (LCs) for Type Ia supernovae (SNe Ia) obtained with the 1.3 m Peters Automated InfraRed Imaging TELescope. This data set includes 4637 measurements of 94 SNe Ia and 4 additional SNe Iax observed from 2005 to 2011 at the Fred Lawrence Whipple Observatory on Mount Hopkins, Arizona. CfAIR2 includes JHKsphotometric measurements for 88 normal and 6
spectroscopically peculiar SN Ia in the nearby universe, with a median redshift of z∼ 0.021 for the normal SN Ia. CfAIR2 data span the range from−13 days to +127 days from B-band maximum. More than half of the LCs begin before the time of maximum, and the coverage typically contains∼13–18 epochs of observation, depending on the filter. We present extensive tests that verify the fidelity of the CfAIR2 data pipeline, including comparison to the excellent data of the Carnegie Supernova Project. CfAIR2 contributes to afirm local anchor for SN cosmology studies in the NIR. Because SN Ia are more nearly standard candles in the NIR and are less vulnerable to the vexing problems of extinction by dust, CfAIR2 will help the SN cosmology community develop more precise and accurate extragalactic distance probes to improve our knowledge of cosmological parameters, including dark energy and its potential time variation.
Key words: cosmology: observations – distance scale – infrared: stars – supernovae: general – techniques: image processing– techniques: photometric
Supporting material: machine-readable tables
1. INTRODUCTION
Optical observations of Type Ia Supernovae (SN Ia) were crucial to the surprising 1998 discovery of the acceleration of cosmic expansion (Riess et al. 1998; Schmidt et al. 1998; Perlmutter et al. 1999). Since then, several independent cosmological techniques have confirmed the SN Ia results (see Frieman et al. 2008a; Weinberg et al.2013for reviews), while SN Ia provide increasingly accurate and precise measurements of extragalactic distances and dark energy(see Kirshner2010,2013; Goobar & Leibundgut2011for reviews). Increasing evidence suggests that SN Ia observations at rest-frame near-infrared (NIR) wavelengths yield more accurate and more precise distance estimates to SN Ia host galaxies than optical data alone(Krisciunas et al.2004b,2007; Wood-Vasey et al. 2008; Mandel et al. 2009, 2011, 2014; Contreras et al. 2010; Folatelli et al. 2010; Burns et al. 2011, 2014;
Stritzinger et al. 2011; Barone-Nugent et al. 2012; Kattner et al.2012; Phillips2012; Weyant et al.2014).
This work presents CfAIR2, a densely sampled, low-redshift photometric data set including 94 SN Ia NIR JHKs-band light
curves (LCs) observed from 2005 to 2011 with the f/13.5 Peters Automated InfraRed Imaging TELescope(PAIRITEL) 1.3 m telescope at the Fred Lawrence Whipple Observatory (FLWO) on Mount Hopkins, Arizona. Combining low-redshift NIR SN Ia data sets like CfAIR2 with higher-redshift samples will play a crucial role in ongoing and future SN cosmology experiments, from the ground and from space, which hope to reveal whether dark energy behaves like Einstein’s cosmolo-gical constant L or some other phenomenon that may vary over cosmic history.
While SN Ia observed at optical wavelengths have been shown to be excellent standardizeable candles using a variety of sophisticated methods correlating luminosity with LC shape and color, SN Ia are very nearly standard candles at NIR
© 2015. The American Astronomical Society. All rights reserved.
15
wavelengths, even before correction for LC shape or reddening (e.g., Wood-Vasey et al. 2008; Kattner et al. 2012; hereafter WV08and K12). Compared to the optical, SN Ia in the NIR are both better standard candles and relatively immune to the effects of extinction and reddening by dust. Systematic distance errors from photometric calibration uncertainties, uncertain dust estimates, and intrinsic variability of un-reddened SN Ia colors are outstanding problems with using SN Ia for precise cosmological measurements of dark energy with optical data alone(Wang et al.2006; Conley et al.2007,2011; Guy et al. 2007,2010; Jha et al.2007; Wood-Vasey et al.2007; Hicken et al. 2009a; Kessler et al. 2009; Campbell et al. 2013; Narayan 2013; Betoule et al. 2014; Rest et al. 2014; Scolnic et al. 2014a, 2014b). By contrast, many of the systematic uncertainties and discrepancies between the most prominent optical LCfitting and distance estimation methods are avoided with the incorporation of NIR data (Mandel et al. 2011; hereafter M11; Folatelli et al. 2010; Burns et al.2011; K12; Mandel et al. 2014). The most promising route toward understanding the dust in other galaxies and mitigating systematic distance errors in SN cosmology comes from NIR observations.
CfAIR2 JHKs observations with PAIRITEL are part of a
systematic multiwavelength program of CfA SN observations at FLWO. We follow up nearby SN as they are discovered to obtain densely sampled, high signal-to-noise ratio(S/N) optical and NIR LCs of hundreds of nearby low-redshift SN in UBVRIr′i′JHKs. Whenever possible, PAIRITEL NIR data
were observed for targets with additional optical photometry at the FLWO 1.2 m, optical spectroscopy at the 1.5 m Tillinghast telescope with the FAST spectrograph, and/or late-time spectroscopy at the MMT(Matheson et al.2008; Hicken2009; Hicken et al. 2009b,2012; Blondin et al.2012). By obtaining concurrent optical photometry and spectroscopy for many objects observed with PAIRITEL, we considerably increase the value of the CfAIR2 data set. Of the 98 CfAIR2 objects, 92 have complementary optical observations from the CfA or other groups, including unpublished data.16 Table 1 lists general properties of the 94 SN Ia.
It has only recently become understood that SN 2002cx-like objects, which we categorize as SN Iax (e.g., Foley et al.2013), are significantly distinct from both normal SN Ia and spectroscopically peculiar SN Ia (Li et al. 2003; Branch et al. 2004; Chornock et al. 2006; Jha et al. 2006a; Phillips et al. 2007; Sahu et al. 2008; Foley et al. 2009, 2010a, 2010b, 2013, 2014a, 2014b, 2015; Maund et al. 2010; McClelland et al. 2010; Narayan et al. 2011; Kromer et al. 2013; McCully et al. 2014b, 2014a; Stritzinger et al. 2015). Throughout, we treat the four SN Iax included in CfAIR2 (SN 2005hk, SN 2008A, SN 2008ae, SN 2008ha) as a separate class of objects from SN Ia (see Table 2).
This work is a report on photometric data from PAIRITEL, which improves upon and supersedes a previously published
subset including 20 SN Ia JHKs LCs fromWV08(implicitly
“CfAIR1”), 1 SN Iax LC from WV08 (SN 2005hk), and 1 SN Iax LC from Foley et al.(2009) (SN 2008ha), along with work presented in Friedman (2012, hereafter F12).17 Data points for these 20 objects have been reprocessed using our newest mosaic and photometry pipelines and are presented as part of this CfAIR2 data release. The CfAIR1 (WV08) and CfAIR2 NIR data sets complement previous CfA optical studies of SN Ia (CfA1: Riess et al. 1999; CfA2: Jha et al. 2006b; CfA3: Hicken et al. 2009b; and CfA4: Hicken et al.2012) and CfA5 (to be presented elsewhere). CfA5 will include optical data for at least 15 CfAIR2 objects and additional optical LCs for non-CfAIR2 objects.
The 4637 individual CfAIR2 JHKsdata points represent the
largest homogeneously observed and reduced set of NIR SN Ia and SN Iax observations to date. Simultaneous JHKsobserving
provided nightly cadence for the most densely sampled LCs and extensive time coverage, ranging from 13 days before to 127 days after the time of B-band maximum brightness(tB max).
CfAIR2 data have means of 18, 17, and 13 observed epochs for each LC in JHKs, respectively, as well as 46 epochs for the
most extensively sampled LC. CfAIR2 LCs have significant early-time coverage. Out of 98 CfAIR2 objects, 55% have NIR observations before tB max, while 34% have observations at
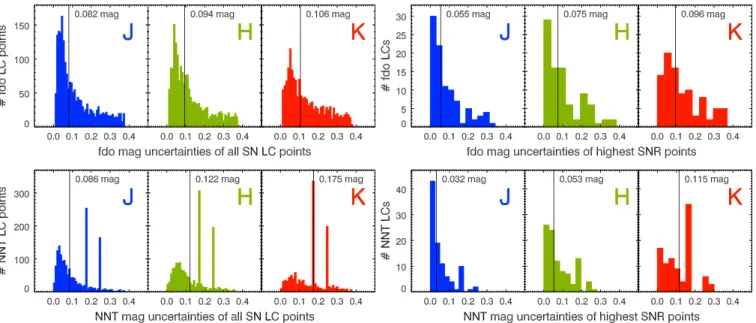
least 5 days before tB max. The highest-S/N LC points for each
CfAIR2 object have median uncertainties of ~0.032, 0.053, and 0.115 mag in JHKs, respectively. The median uncertainties
of all CfAIR2 LC points are 0.086, 0.122, and 0.175 mag in
JHKs, respectively.
Of the 98 CfAIR2 objects, 88 are spectroscopically normal SN Ia and 86 will be useful for SN cosmology(SN 2006E and SN 2006mq were discovered late and lack precise tB max
estimates). The six spectroscopically peculiar SN Ia and four SN Iax are not standardizable candles using existing LCfitting techniques and currently must be excluded from Hubble diagrams.
1.1. Previous Results with NIR SN Ia
For optical SN Ia LCs, many sophisticated methods are used to reduced the scatter in distance estimates. These include
m15( )B
D (Phillips 1993; Hamuy et al. 1996; Phillips et al. 1999; Prieto et al. 2006), multicolor LC shape (Riess et al.1996,1998; Jha et al.2006b,2007), “stretch” (Perlmutter et al. 1997; Goldhaber et al. 2001), Bayesian Adapted Template Match(Tonry et al.2003), color–magnitude intercept calibration(Wang et al.2003), spectral adaptive template (Guy et al.2005,2007; Astier et al.2006), empirical methods (e.g., SiFTO; Conley et al.2008), and BayeSN, a novel hierarchical Bayesian method developed at the CfA(M09,M11).
Unlike optical SN Ia, which are standardizable candles after a great deal of effort, spectroscopically normal NIR SN Ia appear to be nearly standard candles at the ∼0.15–0.2 mag level or better, depending on the filter (Meikle 2000; Krisciunas et al. 2004a, 2005a, 2007; Folatelli et al. 2010; Burns et al.2011; Phillips2012;WV08;M09;M11). Overall, SN Ia are superior standard candles and distance indicators in the NIR compared to optical wavelengths, with a narrow distribution of peak JHKs magnitudes and ∼5–11 times less
sensitivity to reddening than optical B-band data alone.
16
All 10 spectroscopically peculiar SN Ia and SN Iax have optical data from the CfA or other groups, including unpublished CfA5 optical data. Of the 88 spectroscopically normal CfAIR2 SN Ia in Table1, 64 have published optical data from the CfA or other groups, and 12 have unpublished CfA5 optical data. An additional four have CfA optical observations but no successfully reduced LCs yet: SN 2010jv, SN 2010ex, SN 2010ew, SN 2009fw. In addition, two objects have unpublished optical data from other groups, PTF10icb (PTF: Parrent et al.2011: only spectra included), and PTF10bjs (PTF, CfA4: only natural system r′i′). Six objects currently have no optical photometry, according to our search of the literature: SN 2010dl, SN 2009im, SN 2008hy,
Table 1
General Properties of 94 PAIRITEL SN Ia
SN R.A.a Decl.a Hostb Morphologyc z
heliod szhelio
d zd Discoveryb Discoverer(s)e Typef Typeg
Name α(2000) δ(2000) Galaxy Ref. Reference Reference
SN 2005ao 266.20653 61.90786 NGC 6462 SABbc 0.038407 0.000417 1 CBET 115 POSS IAUC 8492 Ia
SN 2005bl 181.05098 20.40683 NGC 4070 L 0.02406 0.00008 1 IAUC 8515 LOSS, POSS IAUC 8514 Iap
SN 2005bo 192.42099 −11.09663 NGC 4708 SA(r)ab pec? 0.013896 0.000027 1 CBET 141 POSS CBET 142 Ia
SN 2005cf 230.38906 −7.44874 MCG−01-39-3 S0 pec 0.006461 0.000037 1 CBET 158 LOSS IAUC 8534 Ia
SN 2005ch 215.52815 1.99316 1 L 0.027 0.005 3 CBET 166 ROTSE-III CBET 167 Ia
SN 2005el 77.95316 5.19417 NGC 1819 SB0 0.01491 0.000017 1 CBET 233 LOSS CBET 235 Ia
SN 2005eq. 47.20575 −7.03332 MCG−01-9-6 SB(rs)cd? 0.028977 0.000073 1 IAUC 8608 LOSS IAUC 8610 Ia
SN 2005eu 36.93011 28.17698 2 L 0.03412 0.000046 1 CBET 242 LOSS CBET 244 Ia
SN 2005iq 359.63517 −18.70914 MCG−03-1-8 Sa 0.034044 0.000123 1 IAUC 8628 LOSS CBET 278 Ia
SN 2005ke 53.76810 −24.94412 NGC 1371 (R’)SAB(r’l)a 0.00488 0.000007 1 IAUC 8630 LOSS IAUC 8631 Iap
SN 2005ls 43.56630 42.72480 MCG +07-7-1 Spiral 0.021118 0.000117 1 IAUC 8643 Armstrong CBET 324 Ia
SN 2005na 105.40287 14.13304 UGC 3634 SB(r)a 0.026322 0.000083 1 CBET 350 POSS CBET 351 Ia
SN 2006D 193.14111 −9.77519 MCG−01-33-34 SAB(s)ab pec? 0.008526 0.000017 1 CBET 362 BRASS CBET 366 Ia
SN 2006E 208.36880 5.20619 NGC 5338 SB0 0.002686 0.000005 2 CBET 363 POSS, LOSS, CROSS ATEL 690 Ia
SN 2006N 92.13021 64.72362 MCG +11-8-12 L 0.014277 0.000083 1 CBET 375 Armstrong IAUC 8661 Ia
SN 2006X 185.72471 15.80888 NGC 4321 SAB(s)bc 0.00524 0.000003 1 IAUC 8667 Suzuki, CROSS CBET 393 Ia
SN 2006ac 190.43708 35.06872 NGC 4619 SB(r)b pec? 0.023106 0.000037 1 IAUC 8669 LOSS CBET 398 Ia
SN 2006ax 171.01434 −12.29156 NGC 3663 SA(rs)bc pec 0.016725 0.000019 2 CBET 435 LOSS CBET 437 Ia
SN 2006cp 184.81198 22.42723 UGC 7357 SAB(s)c 0.022289 0.000002 1 CBET 524 LOSS CBET 528 Ia
SN 2006cz 222.15254 −4.74193 MCG−01-38-2 SA(s)cd? 0.0418 0.000213 1 IAUC 8721 LOSS CBET 550 Ia
SN 2006gr 338.09445 30.82871 UGC 12071 SBb 0.034597 0.00003 1 CBET 638 LOSS CBET 642 Ia
SN 2006le 75.17457 62.25525 UGC 3218 SAb 0.017432 0.000023 1 CBET 700 LOSS CBET 702 Ia
SN 2006lf 69.62286 44.03379 UGC 3108 S? 0.013189 0.000017 2 CBET 704 LOSS CBET 705 Ia
SN 2006mq 121.55157 −27.56262 ESO 494-G26 SAB(s)b pec 0.003229 0.000003 1 CBET 721 LOSS CBET 724 Ia
SN 2007S 150.13010 4.40702 UGC 5378 Sb 0.01388 0.000033 1 CBET 825 POSS CBET 829 Ia
SN 2007ca 202.77451 −15.10175 MCG−02-34-61 Sc pec sp 0.014066 0.00001 1 CBET 945 LOSS CBET 947 Ia
SN 2007co 275.76493 29.89715 MCG +05-43-16 L 0.026962 0.00011 1 CBET 977 Nicolas CBET 978 Ia
SN 2007cq 333.66839 5.08017 3 L 0.026218 0.000167 3 CBET 983 POSS CBET 984 Ia
SN 2007fb 359.21827 5.50886 UGC 12859 Sbc 0.018026 0.000007 2 CBET 992 LOSS CBET 993 Ia
SN 2007if 17.71421 15.46103 4 L 0.0745 0.00015 5 CBET 1059 ROTSE-III CBET 1059 Iap
SN 2007le 354.70186 −6.52269 NGC 7721 SA(s)c 0.006728 0.000002 1 CBET 1100 Monard CBET 1101 Ia
SN 2007nq 14.38999 −1.38874 UGC 595 E 0.045031 0.000053 1 CBET 1106 ROTSE-III CBET 1106 Ia
SN 2007qe 358.55408 27.40916 5 L 0.024 0.001 6 CBET 1138 ROTSE-III CBET 1138 Ia
SN 2007rx 355.04908 27.42097 6 L 0.0301 0.001 7 CBET 1157 ROTSE-III CBET 1157 Ia
SN 2007 sr 180.46995 −18.97269 NGC 4038 SB(s)m pec 0.005417 0.000017 2 CBET 1172 CSS CBET 1173 Ia
SN 2008C 104.29794 20.43723 UGC 3611 S0/a 0.016621 0.000013 1 CBET 1195 POSS CBET 1197 Ia
SN 2008Z 145.81364 36.28439 7 L 0.02099 0.000226 1 CBET 1243 POSS CBET 1246 Ia
SN 2008af 224.86846 16.65325 UGC 9640 E 0.033507 0.000153 1 CBET 1248 Boles CBET 1253 Ia
SNF20080514–002 202.30350 11.27236 UGC 8472 S0 0.022095 0.00009 1 ATEL 1532 SNF ATEL 1532 Ia
SNF20080522-000 204.19796 5.14200 SDSS? L 0.04526 0.0002 9 SNF SNF B09 Ia
SNF20080522-011 229.99519 4.90454 SDSS? L 0.03777 0.00006 9 SNF SNF B09 Ia
SN 2008fr 17.95488 14.64068 8 L 0.039 0.002 8 CBET 1513 ROTSE-III CBET 1513 Ia
SN 2008fv 154.23873 73.40986 NGC 3147 SA(rs)bc 0.009346 0.000003 1 CBET 1520 Itagaki CBET 1522 Ia
SN 2008fx 32.89166 23.87998 9 L 0.059 0.003 3 CBET 1523 CSS CBET 1525 Ia
SN 2008gb 44.48821 46.86566 UGC 2427 Sbc 0.037626 0.000041 3 CBET 1527 POSS CBET 1530 Ia
SN 2008gl 20.22829 4.80531 UGC 881 E 0.034017 0.000117 1 CBET 1545 CHASE CBET 1547 Ia
3 Astrophysical Journal Supplement Series, 220:9 ( 35pp ) , 2015 September Friedman et al.
Table 1 (Continued)
SN R.A.a Decl.a Hostb Morphologyc zheliod szhelio
d
zd Discoveryb Discoverer(s)e Typef Typeg
Name α(2000) δ(2000) Galaxy Ref. Reference Reference
SN 2008hm 51.79540 46.94421 2MFGC 02845 Spiral 0.019664 0.000077 1 CBET 1586 LOSS CBET 1594 Ia
SN 2008hs 36.37335 41.84311 NGC 910 E+ 0.017349 0.000073 2 CBET 1598 LOSS CBET 1599 Ia
SN 2008hv 136.89178 3.39240 NGC 2765 S0 0.012549 0.000067 1 CBET 1601 CHASE CBET 1603 Ia
SN 2008hy 56.28442 76.66533 IC 334 S? 0.008459 0.000023 1 CBET 1608 POSS CBET 1610 Ia
SN 2009D 58.59495 −19.18194 MCG−03-10-52 Sb 0.025007 0.000033 1 CBET 1647 LOSS CBET 1647 Ia
SN 2009Y 220.59865 −17.24675 NGC 5728 (R 1)SAB(r)a 0.009316 0.000026 2 CBET 1684 PASS, LOSS CBET 1688 Ia
SN 2009ad 75.88914 6.66000 UGC 3236 Sbc 0.0284 0.000005 1 CBET 1694 POSS CBET 1695 Ia
SN 2009al 162.84201 8.57833 NGC 3425 S0 0.022105 0.00008 1 CBET 1705 CSS CBET 1708 Ia
SN 2009an 185.69715 65.85145 NGC 4332 SB(s)a 0.009228 0.000004 2 CBET 1707 Cortini+, Paivinen CBET 1709 Ia
SN 2009bv 196.83538 35.78433 MCG +06-29-39 L 0.036675 0.000063 1 CBET 1741 PIKA CBET 1742 Ia
SN 2009dc 237.80042 25.70790 UGC 10064 S0 0.021391 0.00007 1 CBET 1762 POSS CBET 1768 Iap
SN 2009do 188.74310 50.85108 NGC 4537 S 0.039734 0.00008 1 CBET 1778 LOSS, POSS CBET 1778 Ia
SN 2009ds 177.26706 −9.72892 NGC 3905 SB(rs)c 0.019227 0.000021 2 CBET 1784 Itagaki CBET 1788 Ia
SN 2009fw 308.07711 −19.73336 ESO 597-6 SA(rs)0-? 0.028226 0.00011 1 CBET 1836 CHASE CBET 1849 Ia
SN 2009fv 247.43430 40.81153 NGC 6173 E 0.0293 0.00005 1 CBET 1834 POSS CBET 1846 Ia
SN 2009ig 39.54843 −1.31257 NGC 1015 SB(r)a 0.00877 0.000021 1 CBET 1918 LOSS CBET 1918 Ia
SN 2009im 53.34204 −4.99903 NGC 1355 S0 sp 0.0131 0.0001 1 CBET 1925 Itagaki CBET 1934 Ia
SN 2009jr 306.60846 2.90889 IC 1320 SB(s)b? 0.016548 0.00006 1 CBET 1964 Arbour CBET 1968 Ia
SN 2009kk 57.43441 −3.26447 2MFGC 03182 L 0.012859 0.00015 1 CBET 1991 CSS CBET 1991 Ia
SN 2009kq 129.06316 28.06711 MCG +05-21-1 Spiral 0.011698 0.00002 1 CBET 2005 POSS ATEL 2291 Ia
SN 2009le 32.32152 −23.41242 ESO 478-6 Sbc 0.017792 0.000009 2 CBET 2022 CHASE CBET 2025 Ia
SN 2009lf 30.41513 15.33290 10 L 0.045 0.002 3 CBET 2023 CSS CBET 2025 Ia
SN 2009na 161.75577 26.54364 UGC 5884 SA(s)b 0.020979 0.000006 2 CBET 2098 POSS CBET 2103 Ia
SN 2010Y 162.76658 65.77966 NGC 3392 E? 0.01086 0.000103 1 CBET 2168 Cortini CBET 2168 Ia
PS1-10w 160.67450 58.84392 Anonymous L 0.031255 0.0001 4 R14 PanSTARRS1 R14 Ia
PTF10bjs 195.29655 53.81604 MCG +09-21-83 L 0.030027 0.000073 1 ATEL 2453 PTF ATEL 2453 Ia
SN 2010ag 255.97330 31.50152 UGC 10679 Sb(f) 0.033791 0.000175 2 CBET 2195 POSS CBET 2196 Ia
SN 2010ai 194.84999 27.99646 11 E 0.018369 0.000123 1 CBET 2200 ROTSE-III, Itagaki CBET 2200 Ia
SN 2010cr 202.35442 11.79637 NGC 5177 S0 0.02157 0.000097 1 CBET 2281 Itagaki, PTF ATEL 2580 Ia
SN 2010dl 323.75440 −0.51345 IC 1391 L 0.030034 0.00015 1 CBET 2296 CSS CBET 2298 Ia
PTF10icb 193.70484 58.88198 MCG +10-19-1 L 0.008544 0.000008 2 ATEL 2657 PTF ATEL 2657 Ia
SN 2010dw 230.66775 −5.92125 12 L 0.03812 0.00015 1 CBET 2310 PIKA CBET 2311 Ia
SN 2010ew 279.29933 30.63026 CGCG 173-018 S 0.025501 0.000127 1 CBET 2345 POSS CBET 2356 Ia
SN 2010ex 345.04505 26.09894 CGCG 475-019 Compact 0.022812 0.000005 1 CBET 2348 Ciabattari+ CBET 2353 Ia
SN 2010gn 259.45832 40.88128 13 Disk Gal 0.0365 0.0058 1 ATEL 2718 PTF CBET 2386 Ia
SN 2010iw 131.31205 27.82325 UGC 4570 SABdm 0.021498 0.000017 1 CBET 2505 CSS CBET 2511 Ia?
SN 2010ju 85.48321 18.49746 UGC 3341 SBab 0.015244 0.000013 1 CBET 2549 LOSS CBET 2550 Ia
SN 2010jv 111.86051 33.81143 NGC 2379 SA0 0.013469 0.000083 1 CBET 2549 LOSS CBET 2550 Ia
SN 2010 kg 70.03505 7.34995 NGC 1633 SAB(s)ab 0.016632 0.000007 2 CBET 2561 LOSS CBET 2561 Ia
SN 2011B 133.95016 78.21693 NGC 2655 SAB(s)0/a 0.00467 0.000003 1 CBET 2625 Itagaki CBET 262 Ia
SN 2011K 71.37662 −7.34808 14 L 0.0145 0.001 3 CBET 2636 CSS CBET 2636 Ia
SN 2011aa 114.17727 74.44319 UGC 3906 S 0.012512 0.000033 2 CBET 2653 POSS CBET 2653 Iap?
SN 2011ae 178.70514 −16.86280 MCG−03-30-19 L 0.006046 0.000019 1 CBET 2658 CSS CBET 2658 Ia
SN 2011ao 178.46267 33.36277 IC 2973 SB(s)d 0.010694 0.000002 2 CBET 2669 POSS CBET 2669 Ia
SN 2011at 142.23977 −14.80573 MCG−02-24-27 SB(s)d 0.006758 0.00002 1 CBET 2676 POSS CBET 2676 Ia
SN 2011by 178.93951 55.32592 NGC 3972 SA(s)bc 0.002843 0.000005 1 CBET 2708 Jin+ CBET 2708 Ia
4 Astrophysical Journal Supplement Series, 220:9 ( 35pp ) , 2015 September Friedman et al.
Table 1 (Continued)
SN R.A.a Decl.a Hostb Morphologyc zhelio
d
zhelio
s d
zd Discoveryb Discoverer(s)e Typef Typeg
Name α(2000) δ(2000) Galaxy Ref. Reference Reference
SN 2011de 235.97179 67.76196 UGC 10018 (R’)SB(s)bc 0.029187 0.000017 2 CBET 2728 POSS CBET 2728 Iap?
SN 2011df 291.89008 54.38632 NGC 6801 SAcd 0.014547 0.000019 2 CBET 2729 POSS CBET 2729 Ia
Notes.
a
SN R.A., decl. positions[in decimal degrees] are best-fit SN centroids appropriate for forced DoPHOT photometry at fixed coordinates.
b
Host galaxy names, discovery references, and discovery group/individual credits from NASA/IPAC Extragalactic Database (NED; http://ned.ipac.caltech.edu/) and NASA/ADS (http://adswww.harvard.edu/ abstract_service.html). Also see IAUC List of SNe:http://www.cbat.eps.harvard.edu/lists/Supernovae.html. For SN Ia with non-standard IAUC names, we found the associated host galaxy from IAUC/CBET/ATel notices or the literature and searched for the recession velocity with NED. When the SN Ia is associated with a faint host not named in any major catalogs(NGC, UGC, K) but named in a large galaxy survey (e.g., SDSS, 2MASS), we include the host name from the large survey rather than “Anonymous.” However, to accomodate the table width on a single page, long galaxy names are numbered. 1: APMUKS(BJ) B141934.25 +021314.0(SN 2005ch), 2: NSF J022743.32+281037.6 (SN 2005eu), 3: 2MASX J22144070+0504435 (SN 2007cq), 4: J011051.37+152739 (SN 2007if), 5: NSF J235412.09+272432.3 (SN 2007qe), 6: BATC J234012.05+272512.23(SN 2007rx), 7: SDSS J094315.36+361709.2 (SN 2008Z), 8: SDSS J011149.19+143826.5 (SN 2008fr), 9: 2MASX J02113233+2353074 (SN 2008fx). The machine-readable version of this table has full galaxy names.
c
Host galaxy morphologies taken from NED where available. Hosts with unknown morphologies denoted byK
d
Heliocentric redshift zhelio,szhelioreferences are from 1: NED host galaxy name, 2: NED 21 cm or optical with smallest uncertainty, 3: CfA FAST spectrum on Tillinghast 1.5 m telescope, 4: Rest et al.(2014):
PanSTARRS1, 5: Childress et al.(2011), 6: CBET 1176, 7: Hicken et al. (2009a), 8: CBET 1513, 9: Childress et al. (2013). For SN 2008fr, the NED redshift incorrectly lists the redshift of SN 2008fs (see CBET
1513). Heliocentric redshifts have not been corrected for any local flow models.
e
Discovery References/URLs: LOSS: Lick Observatory Supernova Search(see Li et al.2000; Filippenko2005, and references therein); Tenagra II (http://www.tenagraobservatories.com/Discoveries.htm); ROTSE-III
(Quimby2006); POSS: Puckett Observatory Supernova Search (http://www.cometwatch.com/search.html); BRASS: (http://brass.astrodatabase.net); SDSS-II: Sloan Digital Sky Survey II (Frieman et al.2008b); CSS:
Catalina Sky Survey(http://www.lpl.arizona.edu/css/); SNF: Nearby Supernova Factory (http://snfactory.lbl.gov/); CHASE: CHilean Automatic Supernova sEarch (http://www.das.uchile.cl/proyectoCHASE/); CRTS:
Catalina Real-Time Transient Survey(http://crts.caltech.edu/); Itagaki (http://www.k-itagaki.jp/); Boles: Coddenham Astronomical Observatory, U.K. (http://www.coddenhamobservatories.org/); CROSS (http:// wwww.cortinasetelle.it/snindex.htm); LSSS: La Sagra Sky Survey (http://www.minorplanets.org/OLS/LSSS.html); PASS: Perth Automated Supernova Search (http://www.perthobservatory.wa.gov.au/research/spps. html); Williams 1997); PIKA: Comet and Asteroid Search Program (http://www.observatorij.org/Pika.html); PanSTARRS1: (http://pan-starrs.ifa.hawaii.edu/public/); THCA Supernova Survey (http://www.thca. tsinghua.edu.cn/en/index.php/TUNAS).
fSpectroscopic type reference. B09—Bailey et al. (
2009); Spectroscopic type reference. R14—Rest et al. (2014).
gSpectroscopic type of SN Ia—spectroscopically normal SN Ia. Spectroscopically peculiar SN Ia: including 91bg-like and 06gz-like objects. Uncertain spectroscopic types are denoted with a question mark (?):
SN 2011de: classified as normal Ia in CBET 2728. But NIR LC morphology is consistent with a slow declining object (e.g., SN 2009dc-like). We classify it as Ia-pec.; SN 2011aa: classified as SN 1998aq-like normal Ia in CBET 2653. But Brown et al.(2014) identified it as a Super Chandrasekhar mass candidate, and NIR LC morphology is consistent with a slow declining object (e.g., SN 2009dc-like). We classify it as Ia-pec.
SN 2010iw: classified as SN 2000cx-like, peculiar Ia in CBET 2511. But the NIR LC has the double-peaked morphology of normal Ia. We classify it as a normal Ia. (This table is available in machine-readable form.)
5 Astrophysical Journal Supplement Series, 220:9 ( 35pp ) , 2015 September Friedman et al.
Table 2
General Properties of 4 PAIRITEL SN Iax
SN R.A.a Decl.a Hostb Morphologyc zhelio
d
zhelio
s d
zd Discoveryb Discoverer(s)e Typef Typeg
Name α(2000) δ(2000) Galaxy Ref. Reference Reference
SN 2005hk 6.96187 −1.19819 UGC 272 SAB(s)d 0.012993 0.000041 1 IAUC 8625 SDSS-II, LOSS CBET 269; Ph07 Iax
SN 2008A 24.57248 35.37029 NGC 634 Sa 0.016455 0.000007 2 CBET 1193 Ichimura CBET 1198; F13; Mc14b Iax
SN 2008ae 149.01322 10.49965 IC 577 S? 0.03006 0.000037 2 CBET 1247 POSS CBET 1250; F13 Iax
SN 2008 ha 353.71951 18.22659 UGC 12682 Im 0.004623 0.000002 2 CBET 1567 POSS CBET 1576; F09 Iax
Notes.
a–eSee Table1caption. f
Spectroscopic type reference, Ph07: Phillips et al.(2007), F09: Foley et al. (2009), F13: Foley et al. (2013), Mc14b: McCully et al. (2014b).
g
Spectroscopic type Iax(Foley et al.2013).
(This table is available in machine-readable form.)
6 Astrophysical Journal Supplement Series, 220:9 ( 35pp ) , 2015 September Friedman et al.
Following Meikle (2000), pioneering work by Krisciunas et al.(2004a) (hereafterK04a) demonstrated that SN Ia have a narrow luminosity range in JHKs at tB maxwith smaller scatter
than in B and V. Using 16 NIR SN Ia, K04a found no correlation between optical LC shape and intrinsic NIR luminosity.K04ameasured JHKsabsolute magnitude
distribu-tions with 1σ uncertainties of only σJ= 0.14, σH= 0.18, and
0.12
Ks
s = mag. While K04a used a small, inhomogeneous, sample of 16 LCs, in WV08, we presented 1087 JHKs
photometric observations of 21 objects (including 20 SN Ia and 1 SN Iax), the largest homogeneously observed low-z sample at the time. NIR data from WV08 and the literature strengthened the evidence that normal SN Ia are excellent NIR standard candles, especially in the H band, where absolute magnitudes have an intrinsic rms of 0.15–0.16 mag, without applying any reddening or LC shape corrections, comparable to the scatter in optical data corrected for both.
WV08suggested that LC shape variation, especially in the J band, might provide additional information for correcting NIR LCs and improving distance determinations. In M09, we applied a novel hierarchical Bayesian framework and a model accounting for variations in the J-band LC shape to NIR SN Ia data, constraining the marginal scatter of the NIR peak absolute magnitudes to 0.17, 0.11, and 0.19 mag in JHKs, respectively
(see Figure 9 of M09). Folatelli et al. (2010) obtained similar dispersions of 0.12–0.16 mag in YJHKs, after correcting for
NIR LC shape. Using 13 well-sampled, low-extinction, normal NIR SN Ia LCs from the Carnegie Supernova Project(CSP), K12 find scatters in absolute magnitude of 0.12, 0.12, and 0.09 mag in YJH, respectively.K12also confirm that NIR LC shape correlates with intrinsic NIR luminosity, finding evidence for a nonzero correlation between the peak absolute JH maxima and the decline rate parameter Dm15, with only
marginal dependence in Y. For a set of 12 SN Ia with JH LCs, Barone-Nugent et al.(2012) find a very small JH-band scatter of only 0.116 and 0.085 mag, respectively, although their data set only includes 3–5 LC points for each of the 12 objects. Similarly, Weyant et al. (2014) use only 1–3 data points for each of 13 low-z NIR SN Ia to infer an H-band dispersion of 0.164 mag. Both Barone-Nugent et al.(2012) and Weyant et al. (2014) use auxiliary optical data to estimate tB max. All of these
results suggest that NIR data will be crucial for maximizing the utility of SN Ia as cosmological distance indicators.
1.2. Organization of Paper
This paper is organized as follows. In Section2, we discuss the current sample of nearby NIR SN Ia data including CfAIR2, describe the technical specifications of PAIRITEL, and outline our follow-up campaign. In Section3 we describe the data reduction process, including mosaicked image creation, sky subtraction, host galaxy subtraction, and our photometry pipeline. In Section 4, we present tests of PAIRITEL photometry, emphasizing internal calibration with Two Micron All Sky Survey(2MASS) field star observations, tests for potential systematic errors, and external consistency checks for objects observed by both PAIRITEL and the CSP. Throughout Sections 2–4, we frequently referenceF12, where many additional technical details can be found. In Section 5, we present the principal data products of this paper, which include JHKsLCs of 94 SN Ia and 4 SN Iax. Further analysis
of this data will be presented elsewhere. PAIRITEL and CSP comparison is discussed further in Section6. Conclusions and
directions for future work are summarized in Section 7. Additional details are included in a mathematical appendix (also see Section 7 ofF12).
2. OBSERVATIONS
In Section 2.1, we provide recent historical context for CfAIR2 by describing the growing low-z sample of NIR SN Ia LCs. In Sections 2.2–2.4, we overview CfA NIR SN observations, describe PAIRITELʼs observing capabilities, and detail our follow-up strategy to observe SN Ia in JHKs.
2.1. Low-z NIR LCs of SN Ia
Technological advances in infrared detector technology have recently made it possible to obtain high-quality NIR photo-metry for large numbers of SN Ia. Phillips(2012) provides an excellent recent review of the cosmological and astrophysical results derived from NIR SN Ia observations made over the past three decades. Early NIR observations of SN Ia were made by Kirshner et al.(1973), Elias et al. (1981,1985), and Frogel et al. (1987) and were particularly challenging as a result of the limited technology of the time. In addition, theflux contrast between the host galaxy and the SN Ia is typically smaller in the NIR than at optical wavelengths, making high-S/N observations possible only for the brightest NIR objects with the detectors available in the 1970s and 1980s. While this situation has improved somewhat in the subsequent decades, NIR photometry is still significantly more challenging than at optical wavelengths. Elias et al.(1985) was the first to present an NIR Hubble diagram for six SN Ia. Although these six SN Ia LCs were not classified spectroscopically, Elias et al. (1985) was also the first to use what became the modern spectroscopic nomenclature of Type Ia instead of Type I to distinguish between SN Ia and SN Ib; SN Ib are now thought to be core-collapse SN of stars that have lost their outer hydrogen envelopes(see Modjaz et al.2014and references therein).
In the late 1990s and early 2000s, panoramic NIR arrays made it possible to obtain NIR photometry comparable in quantity and quality to optical photometry for nearby SN Ia. The first early-time NIR photometry with modern NIR detectors observed before tB maxwas presented for SN 1998bu
(Jha et al.1999; Hernandez et al.2000). Since the first peak in the JHKs band occurs∼3–5 days before tB max, depending on
the filter, SN Ia must generally be discovered by optical searches at least ∼5–8 days before tB max in order to be
observed before the NIR maximum(F12; see Section2.4). Pioneering early work was performed in the early 2000s in Chile at the Las Campanas Observatory(LCO) and the Cerro Tololo Inter-American Observatory, spearheaded by the work of Krisciunas et al. (2000, 2001, 2003,2004b, 2004c). K04a presented the largest Hubble diagram of its kind to date with 16 SN Ia. Before WV08 published 21 PAIRITEL NIR LCs observed by the CfA at FLWO, a handful of other NIR observations, usually for individual or small numbers of SN Ia or SN Iax of particular interest, were presented (Cuadra et al.2002; Di Paola et al.2002; Candia et al.2003; Valentini et al. 2003; Benetti et al. 2004; Garnavich et al. 2004; Sollerman et al.2004; Krisciunas et al.2005b; Elias-Rosa et al. 2006, 2008; Krisciunas et al. 2006, 2007; Phillips et al. 2006, 2007; Pastorello et al. 2007a, 2007b; Stanishev et al.2007; Stritzinger & Sollerman2007; Pignata et al.2008; Taubenberger et al.2008; Wang et al.2008). The largest NIR
SN Ia sample prior to CfAIR2 was obtained by the CSP (Freedman 2005; Hamuy et al. 2006) at LCO, including observations of 59 normal and 14 peculiar NIR SN Ia LCs (Schweizer et al. 2008; Contreras et al. 2010; Stritzinger et al.2010,2011; Taubenberger et al.2011).18Other SN Ia or SN Iax papers with published NIR data since WV08include Krisciunas et al. (2009, 2011), Leloudas et al. (2009), Yamanaka et al.(2009), Barone-Nugent et al. (2012), Biscardi et al. (2012), Matheson et al. (2012), Taddia et al. (2012), Silverman et al. (2013), Amanullah (2014), Cartier et al. (2014), Foley et al. (2014b), Goobar et al. (2014), Stritzinger et al. (2014), Weyant et al. (2014), Marion et al. (2015), and Stritzinger et al. (2015). See Table3 for a fairly comprehensive listing of SN Ia and SN Iax with NIR observations in the literature or presented in this paper.
Overall, while ∼1000 nearby SN Ia have been observed at optical wavelengths, prior to CfAIR2, only 147 total unique nearby objects have at least one NIR band of published Y JHKs
data obtained with modern NIR detectors (from SN 1998bu onward). These include 121 normal SN Ia, 22 peculiar SN Ia, and 4 SN Iax . CfAIR2 adds 66 new unique objects, including 62 normal SN Ia. By this measure, CfAIR2 increases the world published NIR sample of total unique objects by 66/147≈ 45% and normal SN Ia by 62/121≈ 51%. Twelve additional CfAIR2 objects have new data that supersede previously published PAIRITEL LCs and no data published by other groups. If we include these, CfAIR2 adds 78 total objects and 73 normal SN Ia to the literature. By this measure, CfAIR2 increases the world published sample of NIR objects by 78/135≈ 58% and the sample of normal SN Ia by 72/110≈ 65%. See Table3.
2.2. PAIRITEL NIR Supernova Observations
Out of 121 total SN Ia and SN Iax observed from 2005 to 2011 by PAIRITEL, 23 are not included in CfAIR2. CfAIR2 includes improved photometry for 20 of 21 objects from WV08. For SN 2005cf, our photometry pipeline failed to produce a galaxy-subtracted LC, so we include the WV08 LC for SN 2005cf in CfAIR2 and all applicable figures or tables. These 20 objects include additional observations not published inWV08, processed homogeneously using upgraded mosaic and photometry pipelines(see Section3). Table1lists general properties of the 94 CfAIR2 SN Ia, and Table 2 lists these for the 4 CfAIR2 SN Iax.
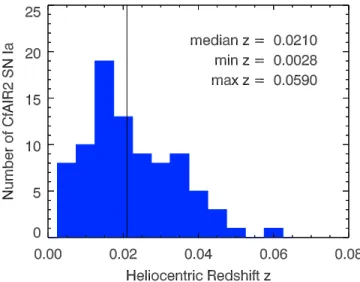
Heliocentric galaxy redshifts are provided in Tables1and2 and CMB frame redshifts are given in Table 9 to ease construction of future Hubble diagrams including NIR SN Ia data.19 We obtained recession velocities from identified host galaxies as listed in the NASA/IPAC Extragalactic Database (NED). In cases where NED did not return a host galaxy or the host galaxy had no reported NED redshift, we either obtained redshift estimates from our own CfA optical spectra(Matheson et al.2008; Blondin et al.2012) or found redshifts reported in the literature. Figure 1 shows a histogram of CfAIR2 heliocentric galaxy redshifts zhelio for 86 normal SN Ia with
tB maxestimates accurate to within less than 10 days.
From 2005 to 2011, we also obtained extensive PAIRITEL NIR observations of 25 SN Ib/c (Bianco et al. 2014) and 20 SN II (to be presented elsewhere). Table 4 references all previously published and in preparation papers using PAIR-ITEL SN data, including multiwavelength studies of individual objects (Tominaga et al. 2005; Kocevski et al. 2007; Foley et al.2009; Modjaz et al.2009; Wang et al.2009; Drout et al. 2013; Sanders et al. 2013; Fransson et al. 2014; Marion et al. 2014; Margutti et al. 2014) and NIR/optical LC compilations for SN of all types(e.g., Modjaz 2007; WV08; F12; Bianco et al. 2014). The most recent of these papers (Sanders et al.2013; Bianco et al.2014; Fransson et al.2014; Marion et al.2014; Margutti et al.2014) used the same mosaic and photometry pipelines also used to produce the CfAIR2 data for this paper (see Section 3). For completeness, we also include information on all other types of SN with published PAIRITEL observations for both current and older pipelines.
2.3. PAIRITEL 1.3 m Specifications
Dedicated in October 2004, PAIRITEL uses the 2MASS (Skrutskie et al. 2006) northern telescope together with the 2MASS southern camera. PAIRITEL is a fully automated robotic telescope with the sequence of observations controlled by an optimized queue-scheduling database (Bloom et al. 2006). Two dichroic mirrors allow simultaneous observing in JHKs (1.2, 1.6, and 2.2 μm, respectively; Cohen
et al.2003; Skrutskie et al.2006) with three 256 × 256 pixel HgCdTe NICMOS3 arrays. Figure 1 of WV08shows a com-posite JHKsmosaicked image of SN 2006D(see Section3.1).
Since the observations are conducted with the instrument that defined the 2MASS JHKs system, we use the 2MASS
point source catalog(Cutri et al.2003) to establish photometric zero points. Typical 30-minute(1800 s) observations (includ-ing slew overhead) reach 10σ sensitivity limits of ∼18, 17.5, and 17 mag for point sources in JHKs, respectively(F12). For
fainter objects, 10σ point source sensitivities of 19.4, 18.5, and 18 mag are achievable with 1.5 hr(5400 s) of dithered imaging in JHKs, respectively (F12). PAIRITEL thus observes
significantly deeper than 2MASS, which used a 7.8 s total exposure time to achieve 10σ point source sensitivities of 15.8, 15.1, and 14.3 mag in JHKs, respectively(Skrutskie et al.2006;
see Section4).
2.4. Observing Strategy
Automation of PAIRITEL made it possible to study SN with unprecedented temporal coverage in the NIR, by responding quickly to new SN and revisiting targets frequently (Bloom et al.2006;WV08;F12). CfAIR2 followed up SN discovered by optical searches at δ −30° with V 18 mag, with significant discovery contributions from both amateur and professional astronomers (see Tables1and 2). SN candidates with a favorable observation window and airmass <2.5 from Mount Hopkins were considered for the PAIRITEL observa-tion queue. We observed SN of all types but placed highest priority on the brightest SN Ia discovered early or close to maximum brightness. SN candidates meeting these criteria were often added to the queue before spectroscopic typing to observe the early-time LC. Since many optically discovered SN of all types brighter than V < 18 mag are spectroscopically typed by our group at the CfA20 or other groups within
18The CSP work did not yet distinguish SN Iax as a separate subclass from SN Ia.
19
However, note that none of the redshifts in Tables1and2or9have been corrected for local flow models. Objects with recession velocities 3000 km s−1(z 0.01) must have their redshifts corrected with local flow
models or other distance information before being included in Hubble
Table 3
SN Ia and SN Iax with Published NIR Photometry
SN Name Typea NIR Photometry SN Name Typea NIR Photometry SN Name Typea NIR Photometry
Referencesb Referencesb Referencesb
SN 2012Z Iax S15 SN 2007nq Ia CfAIR2;S11 SN 2007as Ia S11
SN 2014J Ia A14; Go14; F14b SN 2007le Ia CfAIR2;S11 SN 2007ax Ia-pec S11
SN 2013bh Ia-pec Si13 SN 2007if Ia-pec CfAIR2;S11 SN 2007ba Ia-pec S11
SN 2011fe Ia M12 SN 2007fb Ia CfAIR2 SN 2007bc Ia S11
SN 2010ae Iax S14 SN 2007cq Ia CfAIR2;WV08 SN 2007bd Ia S11
SN 2008J Ia Ta12 SN 2007co Ia CfAIR2 SN 2007bm Ia S11
SN 2011df Ia CfAIR2 SN 2007ca Ia CfAIR2;S11 SN 2007hx Ia S11
SN 2011de Ia-pec? CfAIR2 SN 2007S Ia CfAIR2;S11 SN 2007jg Ia S11
SN 2011by Ia CfAIR2 SN 2006mq Ia CfAIR2 SN 2007on Ia S11
SN 2011at Ia CfAIR2 SN 2006lf Ia CfAIR2;WV08 SN 2008R Ia S11
SN 2011ao Ia CfAIR2 SN 2006le Ia CfAIR2;WV08 SN 2008bc Ia S11
SN 2011ae Ia CfAIR2 SN 2006gr Ia CfAIR2;WV08 SN 2008bq Ia S11
SN 2011aa Ia-pec? CfAIR2 SN 2006cz Ia CfAIR2 SN 2008fp Ia S11
SN 2011K Ia CfAIR2 SN 2006cp Ia CfAIR2;WV08 SN 2008gp Ia S11
SN 2011B Ia CfAIR2 SN 2006ax Ia CfAIR2;WV08;C10 SN 2008ia Ia S11
SN 2010kg Ia CfAIR2 SN 2006ac Ia CfAIR2;WV08 SN 2009F Ia-pec S11
SN 2010jv Ia CfAIR2 SN 2006X Ia CfAIR2;WV08;C10; WX08 SN 2004eo Ia C10; Pa07b
SN 2010ju Ia CfAIR2 SN 2006N Ia CfAIR2;WV08 SN 2004S Ia K07
SN 2010iw Ia? CfAIR2 SN 2006E Ia CfAIR2 SN 2003hv Ia L09
SN 2010gn Ia CfAIR2 SN 2006D Ia CfAIR2;WV08;C10 SN 2003gs Ia-pec K09
SN 2010ex Ia CfAIR2 SN 2005na Ia CfAIR2;WV08;C10 SN 2003du Ia St07
SN 2010ew Ia CfAIR2 SN 2005ls Ia CfAIR2 SN 2003cg Ia ER06
SN 2010dw Ia CfAIR2 SN 2005ke Ia-pec CfAIR2;WV08;C10 SN 2002fk Ia Ca14
PTF10icb Ia CfAIR2 SN 2005iq Ia CfAIR2;WV08;C10 SN 2002dj Ia P08
SN 2010dl Ia CfAIR2 SN 2005hk Iax CfAIR2;WV08; Ph07 SN 2002cv Ia ER08; DP02
SN 2010cr Ia CfAIR2 SN 2005eu Ia CfAIR2;WV08 SN 2002bo Ia K04c ; B04
SN 2010ai Ia CfAIR2 SN 2005eq Ia CfAIR2;WV08;C10 SN 2001el Ia K03; S07
SN 2010ag Ia CfAIR2 SN 2005el Ia CfAIR2;WV08;C10 SN 2001cz Ia K04c
PTF10bjs Ia CfAIR2 SN 2005ch Ia CfAIR2;WV08 SN 2001cn Ia K04c
PS1-10w Ia CfAIR2 SN 2005cf Ia CfAIR2;WV08; Pa07a SN 2001bt Ia K04c
SN 2010Y Ia CfAIR2 SN 2005bo Ia CfAIR2 SN 2001ba Ia K04b
SN 2009na Ia CfAIR2 SN 2005bl Ia-pec CfAIR2;WV08 SN 2001ay Ia-pec K11
SN 2009lf Ia CfAIR2 SN 2005ao Ia CfAIR2;WV08 SN 2000cx Ia-pec Ca03; So04; Cu02
SN 2009le Ia CfAIR2 SN 2004ef Ia C10 SN 2000ce Ia K01
SN 2009kq Ia CfAIR2 SN 2004ey Ia C10 SN 2000ca Ia K04b
SN 2009kk Ia CfAIR2 SN 2004gs Ia C10 SN 2000bk Ia K01
SN 2009jr Ia CfAIR2 SN 2004gu Ia-pec C10 SN 2000bh Ia K04b
SN 2009im Ia CfAIR2 SN 2005A Ia C10 SN 2000E Ia V03
SN 2009ig Ia CfAIR2 SN 2005M Ia C10 SN 1999gp Ia K01
SN 2009fv Ia CfAIR2 SN 2005ag Ia C10 SN 1999ek Ia K04c
SN 2009fw Ia CfAIR2 SN 2005al Ia C10 SN 1999ee Ia K04b
SN 2009ds Ia CfAIR2 SN 2005am Ia C10 SN 1999cp Ia K00
SN 2009do Ia CfAIR2 SN 2005hc Ia C10 SN 1999cl Ia K00
SN 2009dc Ia-pec CfAIR2; T11; Y09 SN 2005kc Ia C10 SN 1999by Ia-pec G04
SN 2009bv Ia CfAIR2 SN 2005ki Ia C10 SN 1999ac Ia-pec Ph06
SN 2009an Ia CfAIR2 SN 2006bh Ia C10 SN 1999aa Ia-pec K00
SN 2009al Ia CfAIR2 SN 2006eq Ia C10 SN 1998bu Ia H00; J99
SN 2009ad Ia CfAIR2 SN 2006gt Ia-pec C10 PTF09dlc Ia BN12
SN 2009Y Ia CfAIR2 SN 2006mr Ia-pec C10 PTF10hdv Ia BN12
SN 2009D Ia CfAIR2 SN 2006dd Ia S10 PTF10mwb Ia BN12
SN 2008hy Ia CfAIR2 SN 2005hj Ia S11 PTF10ndc Ia BN12
SN 2008hv Ia CfAIR2;S11 SN 2005ku Ia S11 PTF10nlg Ia BN12
SN 2008hs Ia CfAIR2 SN 2006bd Ia-pec S11 PTF10qyx Ia BN12
SN 2008hm Ia CfAIR2 SN 2006br Ia S11 PTF10tce Ia BN12
SN 2008ha Iax CfAIR2; F09 SN 2006bt Ia-pec S11 PTF10ufj Ia BN12
SN 2008gl Ia CfAIR2 SN 2006ej Ia S11 PTF10wnm Ia BN12
SN 2008gb Ia CfAIR2 SN 2006et Ia S11 PTF10wof Ia BN12
SN 2008fx Ia CfAIR2 SN 2006ev Ia S11 PTF10xyt Ia BN12
SN 2008fv Ia CfAIR2; Bi12 SN 2006gj Ia S11 SN 2011hr Ia W14
SN 2008fr Ia CfAIR2 SN 2006hb Ia S11 SN 2011gy Ia W14
SNF20080522-011 Ia CfAIR2 SN 2006hx Ia S11 SN 2011hk Ia-pec W14
SNF20080522-000 Ia CfAIR2 SN 2006is Ia S11 SN 2011fs Ia W14
1–3 days of discovery, we rarely spent more than a few observations on objects we later deactivated after typing. All CfA SNe are spectroscopically classified using the SuperNova IDentification code (SNID; Blondin & Tonry2007).
From 2005 to 2011, ∼20–30 SN per year were discovered that were bright enough to observe with the PAIRITEL 1.3 m, with∼3–6 available on any given night from Mount Hopkins. Since we only perform follow-up NIR observations and are not conducting an NIR search to discover SN with PAIRITEL, we suffer from all the heterogeneous sample selection effects and
biases incurred by each of the independent discovery efforts. A full analysis of the completeness of our sample is beyond the scope of this work. Overall, with∼30% of the time on a robotic telescope available for SN observations, effectively amounting to over 6 months on the sky, we observed over 2/3 of the candidate SN that met our follow-up criteria. We also observed galaxy template images(SNTEMP) for each SN to enable host subtraction(see Section3.4).
3. DATA REDUCTION
Since WV08, we have substantially upgraded our data reduction software, including both pipelines for combining the raw data into mosaics and for performing photometry on the mosaicked images. All CfAIR2 data were processed homo-geneously with a single mosaicking pipeline(hereafter p3.6) that adds and registers PAIRITEL raw images into mosaics (Section 3.1). The mosaics, as well as their associated noise and exposure maps, were then fed to a single photometry pipeline(hereafter photpipe), originally developed to handle optical data for the ESSENCE and SuperMACHO projects (Rest et al.2005; Garg et al.2007; Miknaitis et al.2007) and modified to perform host galaxy subtraction and photometry on the NIR mosaicked images(Sections3.4–3.8). Earlier mosaic and photpipe versions have been used for previously published PAIRITEL SN LCs (see Table 4), with recent modifications by A. Friedman and W. M. Wood-Vasey to produce compilations of SN Ia and SN Iax (CfAIR2; this work) and SN Ib and SN Ic (Bianco et al.2014). Photpipe now takes as input improved noise mosaics to estimate the noise in the mosaicked images (Section 3.2), registers the images to a common reference frame with SWarp (Bertin et al.2002), subtracts host galaxy light at the SN position using reference images withHOTPANTS (Becker et al.2004,2007), Table 3
(Continued)
SN Name Typea NIR Photometry SN Name Typea NIR Photometry SN Name Typea NIR Photometry
Referencesb Referencesb Referencesb
SN 2008af Ia CfAIR2 SN 2006lu Ia S11 SN 2011hb Ia W14
SN 2008ae Iax CfAIR2 SN 2006ob Ia S11 SN 2011io Ia W14
SN 2008Z Ia CfAIR2 SN 2006os Ia S11 SN 2011iu Ia W14
SN 2008C Ia CfAIR2;S11 SN 2006ot Ia-pec S11 PTF11qri Ia W14
SN 2008A Iax CfAIR2 SN 2007A Ia S11 PTF11qmo Ia W14
SN 2007sr Ia CfAIR2; S08 SN 2007N Ia-pec S11 PTF11qzq Ia W14
SN 2007rx Ia CfAIR2 SN 2007af Ia S11 PTF11qpc Ia W14
SN 2007qe Ia CfAIR2 SN 2007ai Ia S11 SN 2011ha Ia W14
Notes. a
SN Spectroscopic Types: Ia—Normal SN Ia including 91T-like, 86G-like, and spectroscopically normal objects; Iap—Peculiar SN Ia including 91bg-like objects and extra-luminous, slow declining 06gz-like objects(Hicken et al.2007); Iax—SN Iax including 02cx-like objects distinct from peculiar SN Ia (Li et al.2003; Foley et al.2013). Spectroscopic type references for CfAIR2 objects are in Tables1and2, and in the references below for non-CfAIR2 objects with NIR photometry. SN with uncertain spectral types(SN 2011de, SN 2011aa, SN 2010iw) are denoted by a question mark (?) (see Table1caption).
bReferences for objects with at least one band of YJHK
sphotometry. CfAIR2: this paper;WV08: Wood-Vasey et al.(2008), W14: Weyant et al. (2014), S15:
Stritzinger et al.(2015), S14: Stritzinger et al. (2014), F14b: Foley et al. (2014b), Go14: Goobar et al. (2014), Ca14: Cartier et al. (2014), A14: Amanullah (2014),
Si13: Silverman et al.(2013), Ta12: Taddia et al. (2012), M12: Matheson et al. (2012), Bi12: Biscardi et al. (2012), BN12: Barone-Nugent et al. (2012), T11:
Taubenberger et al.(2011),S11: Stritzinger et al.(2011), K11: Krisciunas et al. (2011), S10: Stritzinger et al. (2010),C10: Contreras et al.(2010), Y09: Yamanaka
et al.(2009), L09: Leloudas et al. (2009), K09: Krisciunas et al. (2009), F09: Foley et al. (2009), WX08: Wang et al. (2008), T08: Taubenberger et al. (2008), S08:
Schweizer et al.(2008), P08: Pignata et al. (2008), ER08: Elias-Rosa et al. (2008), S07: Stritzinger & Sollerman (2007), St07: Stanishev et al. (2007), Ph07: Phillips
et al.(2007), Pa07b: Pastorello et al. (2007b), Pa07a: Pastorello et al. (2007a), K07: Krisciunas et al. (2007), Ph06: Phillips et al. (2006), ER06: Elias-Rosa et al.
(2006), K05: Krisciunas et al. (2005b), So04: Sollerman et al. (2004), K04c: Krisciunas et al. (2004a), K04b: Krisciunas et al. (2004b), G04: Garnavich et al. (2004),
B04: Benetti et al.(2004), V03: Valentini et al. (2003), K03: Krisciunas et al. (2003), Ca03: Candia et al. (2003), DP02: Di Paola et al. (2002), Cu02: Cuadra et al.
(2002), K01: Krisciunas et al. (2001), K00: Krisciunas et al. (2000), H00: Hernandez et al. (2000), J99: Jha et al. (1999).
(This table is available in machine-readable form.)
Figure 1. Histogram of heliocentric redshifts zheliofor 86 spectroscopically
normal CfAIR2 SN Ia from Table1with tB maxestimates accurate to within
less than 10 days. Bin size D =z 0.005. Redshift statistics for the sample include median (black vertical line, 0.0210), minimum (0.0028), and maximum (0.0590). Heliocentric redshifts have not been corrected for any localflow models.
and performs point-spread function (PSF) photometry using DoPHOT (Schechter et al.1993). Photometry is extracted from either the unsubtracted or the subtracted images by forcing DoPHOT to measure the PSF-weighted flux of the object at a fixed position in pixel coordinates (see Section3.4;F12).
In Section 3.1, we describe our p3.6 mosaic pipeline. In Section 3.2, we describe sky subtraction and our improved method to produce noise mosaics corresponding to the mosaicked images. In Section 3.3, we discuss the under-sampling of the PAIRITEL NIR camera. In Sections 3.4–3.7 we detail the host galaxy subtraction process and describe our method for performing photometry on the subtracted or unsubtracted images. Major photpipe improvements are summarized in Section3.8. SeeF12for additional details.
3.1. Mosaics
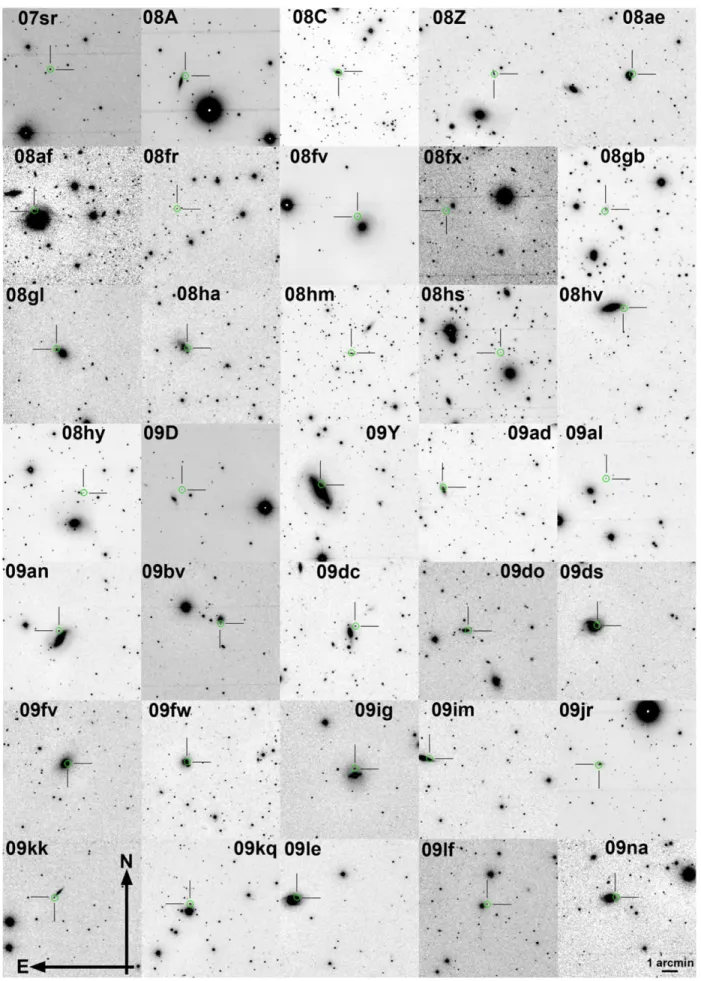
All CfAIR2 images were processed into mosaics at the CfA using p3.6 implemented in Python version 2.6.21 F12 and references in Table4describe older mosaic pipelines. Klein & Bloom(2014) provide a more detailed description of p3.6 as used for PAIRITEL observations of RR Lyrae stars. Figures3– 5 show sample p3.6 J-band mosaics for all 98 CfAIR2 objects.
Including slew overhead for the entire dither pattern, typical exposure times range from 600 to 3600 s, yielding∼50–150 raw images for mosaicking. Excluding slew overhead, effective exposure times are generally∼40%–70% of the time on the sky, yielding typical actual exposure times of∼250 to ∼2500 s. Raw images are obtained with standard double-correlated reads with the long-exposure(7.8 s) minus short-exposure (51 ms) frames in eachfilter treated as the “raw” frame input to p3.6. These raw 256 × 256 pixel images are of∼7.8 s duration with a plate scale of 2″ pixel−1and an 8′.53 × 8′.53 field of view (FOV). To aid with reductions, the telescope is dithered after each set of
three exposures with a step size <2′ based on a randomized dither pattern covering a typical∼12′ × 12′ FOV. The three raw images observed at each dither position are then added into “triplestacks” before mosaicking. The p3.6 pipeline processes all raw images by flat correction, dark current and sky subtraction, registration, and stacking to create final JHKs
mosaics usingSWarp (Bertin et al.2002). Bad pixel masks are created dynamically, andflat fields—which are relatively stable —were created from archival images. Since the short-timescale seeing also remains roughly constant in the several seconds of slew time between dithered images, we did notfind it necessary to convolve the raw images to the seeing of a raw reference image before mosaicking. The seeing over long time periods (several months) remains relatively constant at 0″.77–0″.85.22
The raw images are resampled from a raw image scale of 2″ pixel−1 into final mosaics with 1″ pixel−1 sampling with SWarp (Bertin et al. 2002). The typical FWHM in the final PAIRITEL mosaics is ∼2″.5–3″.0, consistent with the average image quality obtained by 2MASS(Skrutskie et al.2006).
The desired telescope pointing center for all dithered images is set to the SN R.A. and decl. coordinates from the optical discovery images. Unfortunately, as a result of various software and/or mechanical issues—for example, problems with the R. A. drive—the PAIRITEL 1.3 m telescope pointing accuracy can vary by∼1′–30′ from night to night. Catastrophic pointing errors can result in the SN being absent in all of the raw images and missing in the ∼12′ × 12′ mosaic FOV. More often, nonfatal pointing errors result in the SN being absent or off-center in some, but not all, raw images. In p2.0 used for WV08, the mosaic center was constrained to be the SN coordinates and the mosaic size in pixels was fixed. This resulted in a significant fraction of failed or low-S/N mosaics using an insufficient number of raw images. For p3.0–p3.6, the constraintfixing the SN at the mosaic center was relaxed Table 4
SN with Published or Forthcoming PAIRITEL Data
Object or Type(s) Reference Comments
Compilation
SN 2005bf Ic-Ib Tominaga et al.(2005) Unusual core-collapse object SN 2006aj Ic-BL Modjaz et al.(2006), Kocevski et al. (2007) Associated with GRB 060281
SN 2006jc Ib/c Modjaz(2007) Unusual core-collapse object; in M. Modjaz PhD thesis SN 2008D Ib Modjaz et al.(2009) Associated with Swift X-ray transient XRT 080109 SN 2005cf Ia Wang et al.(2009) Normal SN Ia, significant multiwavelength data
SN 2008ha Iax Foley et al.(2009) Extremely low luminosity SN Iaxa
WV08 Ia, Ia-pec, Iax Wood-Vasey et al.(2008) Compilation of 20 SN Ia and 1 SN Iax NIR LCsa
F12 Ia, Ia-pec, Iax Friedman(2012) Compilation of SN Ia and SN Iax in A. Friedman PhD thesisa
M07 Ib,Ic Modjaz(2007) Compilation of SN Ib and SN Ic in M. Modjaz PhD thesisb
PS1-12sk Ibn Sanders et al.(2013) Pan-STARRS1 project observations
SN 2005ek Ic Drout et al.(2013) Photometry from Modjaz(2007)b
SN 2011dh IIb Marion et al.(2014) SN in M51
SN 2009ip LBV Margutti et al.(2014) Luminous blue variable with outbursts. Not a SN
SN 2010jl IIn Fransson et al.(2014) Unusual core-collapse object
B14 Ib, Ic Bianco et al.(2014) Compilation of PAIRITEL SN Ib and SN Icb
CfAIR2 Ia, Ia-pec, Iax Friedman et al.(2015a) This paper; compilation of PAIRITEL SN Ia, SN Ia-pec, SN Iaxa
SN 2012cg Ia G. H. Marion et al.(2015b, in preparation) Bright Ia with multiwavelength data Notes.
a
Photometry in this paper supersedes PAIRITEL LCs from Wood-Vasey et al.(2008) (except SN 2005cf), SN 2008ha LC in Foley et al. (2009), andF12. b
B14 supersedes M. Modjaz PhD thesis.
21p1.0-p3.6 was developed at UC Berkeley and the CfA by J. S. Bloom, C. Blake, C. Klein, D. Starr, and A. Friedman.
22For typical seeing at FLWO since 2003, see https://www.mmto.org/
and the mosaic center was allowed to be the center of all imaging. This resulted in ∼15% more mosaic solutions than p2.0. Mosaics that failed processing at intermediate phot-pipe stages were excluded from the LC automatically. Some mosaics that succeeded to the end of photpipe were excluded based on visual inspection or by identifying outlier LC points during post-processing.
3.2. Sky Subtraction and Noise Maps
The PAIRITEL camera has no cold shutter, so dark current cannot be measured independently, and background frames include both sky and dark photons(“skark”). Fortunately, the thermal dark current counts across the raw frames are negligible in JHKs for the NICMOS3 arrays on timescales
comparable to the individual, raw, 7.8 s exposures (Skrutskie et al. 2006). Furthermore, the dark current rate does not detectably vary across the 1.5 hr of the maximum dither pattern used in these observations. Background frames also include an electronic bias, characterized by shading in each of the four raw image quadrants, which produces no noise, and amplifier glow, which peaks at the corners of the quadrants, and which, like thermal dark current, does produce Poisson noise. These intrinsic detector and sky noise contributions get smeared out over the mosaic dither pattern, producing characteristic patterns in the skark mosaics and mosaic noise maps(see Figure 2).23 PAIRITEL SN observations did not include on-off pointings alternating between the source and a nearby skyfield, so skark frames were created for each raw image in the mosaic by applying a pixel-by-pixel average through the stack of a time series of unregistered raw frames, after removing the highest and lowest pixel values in the stack. The stack used a time window of 5 minutes before and after each raw image. This approxima-tion assumes that the sky is constant on timescales less than 10 minutes. For reference, typical dithered image sequences have effective exposure times of 10–30 minutes. Figure2shows that for J band, where the sky counts are small compared to the various sources of detector noise, the skark and noise mosaics are dominated by the cumulative effect of the intrinsic detector features over the entire dither pattern, including dark current, shading, and amplifier glow.24By contrast, the H- and Ks-band
skark and noise mosaics in Figure2are dominated by sky counts and sky noise, respectively, which combine with the various detector imprints and spatiotemporal sky variation to produce the large-scale patterns smeared across the dither pattern.
Although the telescope is dithered (<2′) after three exposures at the same dither position, for host galaxies with large angular size2′–5′ (in the 8′.53 raw image FOV), host galaxy flux contamination introduces additional systematic uncertainty by biasing skark count estimates toward larger values, leading to oversubtraction of sky light in those pixels (F12). Still, the relatively large PAIRITEL 8′.53 FOV combined with a dither step size comparable or greater than the∼1′–2′ angular size of typical galaxies at z ∼ 0.02 allows us to safely estimate the sky from the raw frames in most cases.
This observing strategy also gives us more time on target compared to on-off pointing. While our approach can lead to systematic sky oversubtraction for SN and stars near larger galaxies, by testing the radial dependence of PAIRITEL photometry of 2MASS stars within 3′ of the SN (and close to the host galaxy), we estimate this systematic error to be negligible compared to our photometric errors, biasing SN photometry fainter by0.01 mag in JH and 0.02 in Ks(F12).
By comparison, mean photometric errors for each of the highest-S/N LC points from the set of SN in CfAIR2 are∼0.03, 0.05, and 0.12 mag in JHKs, respectively (with larger mean
statistical errors for all LC points of∼0.09, 0.12, and 0.18 mag in JHKs, respectively). We thus choose to ignore systematic
errors from sky oversubtraction in this work.
Since three raw frames are taken at each dither position and co-added into triplestacks before mosaicking, p3.6 now also constructs “tripleskarks,” by co-adding the three associated skark frames taken at each dither position. To remove the estimated background counts, p3.6 now subtracts the Figure 2. PAIRITEL Source, Skark, & Noise Mosaics. Mosaics (first row), skark mosaics(second row), and noise mosaics (third row) for the PAIRITEL
JHKsimages of SN 2009an from 2009 March 1. The SN is marked with green
circles. Images are displayed in SAOimage ds9 with zscale scaling, in grayscale with counts increasing from black to white. The skark images contain the number of sky + dark current + bias counts(skark counts) subtracted from each mosaic pixel. Median skark counts for these images were∼800, 6700, and 19,600 counts in JHKs, respectively, reflecting the sky noise increase toward
longer NIR wavelengths, which is worst in Ksband. The large-scale patterns in
the skark mosaics come from arcminute-scale spatial variations in the sky brightness of the raw frames, and both thermal dark current and amplifier glow, which peak at the corners of each detector quadrant, and which both contribute Poisson noise. The skark mosaics also show signatures of the relatively stable electronic bias shading patterns in each quadrant of the raw JHKs detectors,
which differ by bandpass. All of these contributions get smeared out over the mosaic dither pattern. Noise mosaics use source counts from the mosaic, skark counts from the skark mosaics, and noise from other sources(see Section 7.1 of
F12for assumptions used to estimate the noise per pixel). The large-scale patterns in the J-band skark and noise mosaics are dominated by the cumulative detector noise contributions, including thermal dark current, shading, and amplifier glow. By contrast, the H and Ks skark and noise mosaics are
dominated by sky counts and sky noise, respectively, which combine with the various detector imprints and spatiotemporal sky variation across the dither pattern to form the large-scale patterns in those bandpasses.
23The shading is an electronic bias that technically produces no noise. Shading was subtracted out as part of the skark counts for each corresponding raw image. However, the shading was included as a generic background contribution along with thermal dark current, amplifier glow, and sky counts and thus effectively contributes to the noise mosaics in Figure2.
24For further information on these features of NICMOS arrays, also used on the Hubble Space Telescope(HST), seehttp://documents.stsci.edu/hst/nicmos/ documents/handbooks/v10/c07_detectors4.html or http://www.stsci.edu/hst/ nicmos/documents/handbooks/DataHandbookv8/nic_ch4.8.3.html.
associated tripleskark from each triplestack before creating final mosaics and new skark and noise mosaics (see Figure2). Since the estimated skark noise can vary by ∼10%–100% across individual skark mosaics, modeling the noise in each pixel provides more reliable differential noise estimates at the positions of all 2MASS stars and the SN, although our absolute noise estimate is still underestimated since the noise mosaics do not model all sources of uncertainty(see Section 7.1 ofF12). To account for this, we also use 2MASS star photometry to empirically calculate inevitable noise underestimates and correct for them in SN photometry on subtracted or unsubtracted images(seeF12; Section4).
3.3. The PAIRITEL NIR Camera Is Undersampled The PAIRITEL infrared camera is undersampled because the 2″ detector pixels are larger than the sub-arcsecond atmospheric seeing disk at FLWO. This means that we cannot fully sample the PSF of the detected image. To achieve some subpixel sampling, PAIRITEL implements a randomized dither pattern. While dithering can help recover some of the image information lost from undersampling, large pixels with dithered imaging cannot fully replace a fully sampled imaging system (Lauer1999; Fruchter & Hook2002; Rowe et al.2011), and in practice, dithering does not always reliably produce the desired sub-pixel sampling. When we subtract host galaxy light, which requires PSF matching SN and SNTEMP mosaics, under-sampling leads to uncertainty in photometry for individual subtractions that can underestimate or overestimate theflux at the SN position. We correct for this by averaging many subtractions and removing bad subtractions, when producing CfAIR2 LCs(see Sections3.4–3.7).
3.4. Host Galaxy Subtraction
We obtain SNTEMP images after the SN has faded below detection for the PAIRITEL infrared camera, typically 6–12 months after the last SN observation. We use SNTEMP images to subtract the underlying host galaxy light at the SN position for each SN image that meets our image quality standards(see Sections3.5–3.6). To limit the effects of variable observational conditions and sensitivity to individual template observations of poor quality and to minimize the photometric uncertainty from individual subtractions, we try to obtain at least NT = ,2 and as many as NT=11 SNTEMP images that satisfy our image quality requirements (see Section3.7). In practice, we obtained medians of NT= , 4, and 3 usable SNTEMP images4 in JHKs, respectively (Figure 6). In cases with only NT =1
SNTEMP image, galaxy-subtracted LCs are deemed acceptable only for bright, well-isolated SN that are consistent with the unsubtracted LCs (see Sections3.5,4.2.2).
3.5. ForcedDoPHOT on Unsubtracted Images Forced DoPHOT photometry (Schechter et al. 1993) at a fixed position was performed on the unsubtracted SN images as an initial step for all PAIRITEL SN. ForcedDoPHOT LCs on unsubtracted images provide an excellent approximation to the final galaxy-subtracted LCs for SN that were clearly separated from their host galaxy(F12). Approximately 30% of SN of all types observed by PAIRITEL are well isolated from the host galaxy and bright enough so that the measured galaxy flux at the SN position is10% of the SN flux at peak brightness. We use 20 of these bright, well-isolated SN to perform internal
consistency checks to test for errors incurred from host galaxy subtraction(see Section4.2;F12).
3.6. Forced DoPHOT on Difference Images
We perform galaxy subtraction on all CfAIR2 objects to reduce the data with a homogeneous method.25 We used subtraction-based photometry following Miknaitis et al.(2007). The SNflux in the difference images is measured with forced DoPHOT photometry at fixed pixel coordinates, determined by averaging SN centroids from J-band or CfA optical V-band difference images with photometric detections of the object that had an S/N > 5. SN centroids are typically accurate to within 0″.2. Tests show no systematic LC bias for forced DoPHOT photometry as a result of SN astrometry errors if the SN centroid is accurate to within0″.5 (F12). The R.A. and decl. values in Tables1and2show best-fit SN centroid coordinates. These are typically more accurate than optical discovery coordinates from IAU/CBET notices, which may only be accurate to within1″–2″. Forced DoPHOT photometry at this fixed position in the difference images employs the DoPHOT PSF calculated from standard stars in the unconvolved image. For the difference images the calibrated zero point from the template is used, with suitable correction for the convolution of the SNTEMP image as detailed by Miknaitis et al.(2007).
3.7. Averaging Subtractions: NNT Method
We use NNT, an alternative galaxy subtraction method for CfAIR2, which uses fewer individual subtractions than the NN2 method(Barris et al.2005) used inWV08. With NNT, for each of the NSNmosaicked SN images, we subtract each of the usable
NT SNTEMP images, yielding at most NNNT =NSN ´NT
individual subtractions. NNT yields NT realizations of the LC
that can be combined into afinal galaxy-subtracted LC with a night-by-night weighted flux average after robust 3σ rejection and manual checks to exclude individual bad subtractions.26SN or SNTEMP images that failed our image quality requirements were also excluded from NNT via automatic photpipe tests and manual checks, yielding fewer bad subtractions than the purely automated process used inWV08.
By obtaining1NT⩽ 11usable SNTEMP images, includ-ing additional observations sinceWV08, most CfAIR2 SN Ia have NT SNTEMP images suitable for galaxy subtraction4 (see Figure 6). NNT allowed us to exclude individual bad subtractions, average over variance across subtractions from different templates, and produce CfAIR2 SN Ia LCs with more accurateflux measurements compared to NN2 forWV08. We discuss the statistical and systematic uncertainty incurred from NNT host galaxy subtraction in Section4.2. CfAIR2 NNT LCs also show better agreement with CSP photometry for the same objects compared toWV08(see Section4.3).27
25
Only SN 2008A(and the SN 2005cf LC retained fromWV08) use forced
DoPHOT and no host subtraction. NNT failed for SN 2008A as a result of poor-quality SNTEMP images(see Section3.7).
26
Weighted meanflux values on each night are weighted by the corrected DoPHOT uncertainties. An S/N >1 cut is employed for individual subtractions before NNT. An S/N >3 cut is employed forfinal LC points. NTcan differ nightly and by bandpass and is often smallest in Ks. See Sections4.1.2,4.2.2,
Table6, and the Appendix. 27
Some fainter SN Ia LCs that used NN2 in WV08 showed significant
systematic deviations from the published CSP photometry for the same objects. These discrepancies exceeded deviations expected from small bandpass differences without S-corrections(Contreras et al. 2010; M. Phillips 2009–