HAL Id: inserm-00133053
https://www.hal.inserm.fr/inserm-00133053
Submitted on 5 Mar 2007HAL is a multi-disciplinary open access archive for the deposit and dissemination of sci-entific research documents, whether they are pub-lished or not. The documents may come from teaching and research institutions in France or abroad, or from public or private research centers.
L’archive ouverte pluridisciplinaire HAL, est destinée au dépôt et à la diffusion de documents scientifiques de niveau recherche, publiés ou non, émanant des établissements d’enseignement et de recherche français ou étrangers, des laboratoires publics ou privés.
Multi-array EEG signals mapped with three dimensional
images for clinical epilepsy studies
Cristina Rocha, Jean-Louis Dillenseger, Jean-Louis Coatrieux
To cite this version:
Cristina Rocha, Jean-Louis Dillenseger, Jean-Louis Coatrieux. Multi-array EEG signals mapped with three dimensional images for clinical epilepsy studies. Visualization in Biomedical Computing, 1996, Hambourg, Germany. pp.467-476, �10.1007/BFb0046987�. �inserm-00133053�
Multi-Array EEG Signals Mapped with Three Dimensional Images for
Clinical Epilepsy Studies
C. Rocha, J-L. Dillenseger, J-L. Coatrieux
Laboratoire Traitement du Signal et de l'Image, INSERM
Université de Rennes 1, Campus de Beaulieu, 35042 Rennes Cedex, France
Abstract. The design of methods to simultaneously display signal and image data used in clinical epilepsy research is presented. Electrical sensors, spatially distributed into or over the head of the patient, are basic tools for epilepsy research. The considerable amount of sensors makes the interpretation of the acquired signals difficult when they are displayed as multiple electrical potentials vs. time curves. In addition, the dimension of the representation domain is increased after processing the signals (e.g. time-scale or time-frequency representations). The anatomical reference is always required to understand the mechanisms underlying the brain electrical activity. The solutions reported here make use of two dimensional (2D) or three dimensional (3D) spatio-temporal mappings, surface cartographies projected onto the anatomical structures and compositions of depth/surface/morphology information.
1. Introduction
Epilepsies are neurological disorders that lead to transient and repetitive interruptions in normal electrical brain activity [1]. The medical application domain of this paper is related to the clinical research in epilepsy. We will describe the design of a platform that helps the interpretation of the information collected on the patient or the information a priori known. From a global point of view we can identify four information sources (figure 1):
1 - Imaging modalities. Magnetic Resonance Imaging (MRI) and Computed Tomography (CT) are modalities that provide the morphological reference to the brain structures. MRI is preferable to CT because it gives more information concerning brain tissues. Single Photon Emission Computed Tomography (SPECT) and Positron Emission Tomography (PET) give functional information and are used to identify the pathological brain areas.
2 - Electromagnetic data. The brain electrical activity is acquired by Electroencephalograms (EEG) (surface recordings), and Stereo-EEG (SEEG) (in-depth recordings). The magnetic components are acquired by Magnetoencephalograms (MEG). These modalities provide a fine temporal description of the underlying process evolution.
3 - Anatomical and functional models. After registration with the morphological volumes they help for the understanding and the delimitation of the affected brain structures.
4 - Clinical observations. The antecedents of the patients and their medical history are completed by a video monitoring during the seizures in order to objectively record an important part of the epilepsy semiology.
This examination protocol of epileptic patients is very demanding and only specialized medical centers are able to totally achieve it. This protocol is dedicated to highly handicapped patients for whom a surgical intervention must be considered.
The several information sources taking part of the clinical research must be merged and integrated into a multimodal platform that should meet the requirements of the monitoring constraints (signal and real time video observations with the possibility of events marking) and of the 3D visualization of the imaging modalities. The present work is focused on a subset of the overall problem: the simultaneous representation of EEG and SEEG signals on the morphological data. The objective is to facilitate the interpretation of the signals and to have a better understanding of the depth/surface relationships. In Section 2 the problem of matching signals and 3D images is addressed and in Section 3 the different visualization solutions will be described and discussed. The conclusion will set some new perspectives which will complement the platform.
HAL author manuscript inserm-00133053, version 1
HAL author manuscript
Fig. 1. The four fundamental information sources involved in the monitoring of epileptic patients.
2. Problem Statement: 3D Image and Signal Matching
The EEG and SEEG signals are characterized by:
1 - The spatial arrangement of the electrodes. To produce an EEG recording, the electrodes are distributed over the head of the patient according to standard settings (the International 10/20 System is an example). They are sparsely scattered which means that the signals have a low spatial sampling rate. In order to recover the whole electrical mapping over the scalp some interpolation scheme must be applied. The SEEG signals are acquired by means of needle electrodes placed in the brain (figure 2), crossing several brain structures. Because there is a set of recording sensors along each electrode, these sensors form a regular linear array.
Fig. 2. Schematic drawing showing the brain structures, the localization of the in-depth electrodes, and SEEG signals acquired between seizures.
2 - The number and the characteristics of the recording sensors. The surface signals are usually issued from a small number of electrodes (about twenty). But this number must be increased (up to 60 or more) in order to better identify the localization of the pathological electrical activity. The depth recordings are normally performed by electrodes with fifteen sensors which are geometrically assumed to be points. In order to remove any ambiguity when localizing the epileptic source, five or six electrodes are normally placed in the brain. The characteristics of the sensors are mainly related with their shape and size and with the quality of the contact between the skin and the electrode for the case of surface recordings.
3 - The sampling frequency. The sampling frequency of the signals is usually set between 200 and 500 Hz.
After each recording session there is an enormous amount of data to be stored (most of it without significant information). This arises because of the frequency, the total number of sensors and the duration of the monitoring period: during several days and both during epileptical activity (seizures) and interictal periods (between seizures). The graphic representation with multiple electrical potentials vs. time curves (figure 2) does not give information about the spatial relationship between the different electrodes, nor the relationship between the electrodes and the anatomy. It is then advantageous to integrate the representation of the signals into the morphological space of the patient.
The MRI and CT images are suitable for the description of the 3D morphological space and their 3D rendering must be worked out. The methods for the 3D rendering in medical imaging are classified according to their primitive encoding (surface or volume), their projection modes (direct projection or ray casting), and the visual cues that provide the 3D perception (shading, transparency, color, motion, ...). For the state-of-art in this domain, we refer [2] and the special issues [3][4]. An extension of the 3D visualization package X-Image 3D [5] was used for the results reproduced in this paper.
In order to match the electromagnetic data with the morphological structures, the common information of both modalities is used, e.g. the 3D positions of the sensors. Some solutions for the problem of matching the positions of the sensors on the morphology are: measuring the positions of the EEG sensors over the surface of the head by a 3D positioning system (e.g. the Polhemus system), registering the in-depth electrodes from radiological projections or directly from a 3D image modality.
3. Some Representative Visualization Examples
3.1 Visualization of Signals and Its Transforms
To compact and enhance the global perception of the signals, two representations will be presented here. This first type of representation gives no anatomical reference, not even in a schematic form. The spatial relationships are lost and the clinician must mentally reconstruct them.
Multiple Linear Arrays Over Time
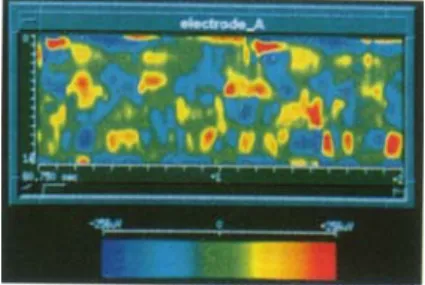
To produce a graphic plot [6] that represents the signal amplitudes recorded on each in-depth electrode as a function of time, spatial interpolation is required because of the low spatial sampling of the sensors (15 in the present case). Time interpolation is not necessary since the sampling frequency is high enough. Figure 5 illustrates the obtained space-time map for a single electrode. The sensor positions are placed along the vertical axis. The top of the vertical axis corresponds to the deepest sensor. Spline interpolation was used along this axis. Time is plotted on the horizontal axis. The signal amplitude is encoded through a rainbow color look-up-table: blue for negative values going towards red for positive, values near zero are green.
In terms of visual comprehension, this representation gives: (i) a good spatial discrimination between the signals acquired by the different sensors along one electrode, (ii) a better perception of the events and their instantaneous delays. A step by step mode or an automatic sequential viewing facilitates the data exploration. The spatial and temporal relations between the different electrodes can be visualized when several windows are displaying the different space-time maps.
Fig. 5. A space-time map of SEEG signals
Linear Arrays and Transformations of the Raw Data
Another kind of representation of the temporal observations is obtained after applying signal processing techniques in order to transform the raw data domain. These transforms have the particularity of modifying the dimension of the representation domain. Consequently, some new visual clues must be worked out when the space dimension is augmented. A simple illustration example is given by the Fourier Transform where a time domain observation x(t) is transformed into the frequency domain X(f) and is then described by two variables: modulus and phase (or real and imaginary parts). The most recent research dealing with time-scale and time-frequency representations pointed out the necessity of high-level visualization tools because, most often, only a subjective interpretation of the results is performed. We will illustrate the associated visualization problems with two examples in which the dimension of the original representation is enhanced: a monodimensional graph is converted into a bidimensional diagram.
The first 2D diagram (figure 6) shows the time-scale decomposition of an EEG epoch (top of the figure) which corresponds to an interictal period where some paroxystic transient events (spikes, spike waves) are present. Using a continuous wavelet transform as described in [7], the signal is decomposed into 30 levels and the modulus of each level is plotted (the amplitude is represented by the color look-up-table shown on the right side of the figure). With this representation the transients are enhanced. The purpose of this wavelet decomposition was to design an original detection framework [8]. To complete the representation, the phase information also should be depicted.
Fig. 6. Time-scale (Wavelet) representation
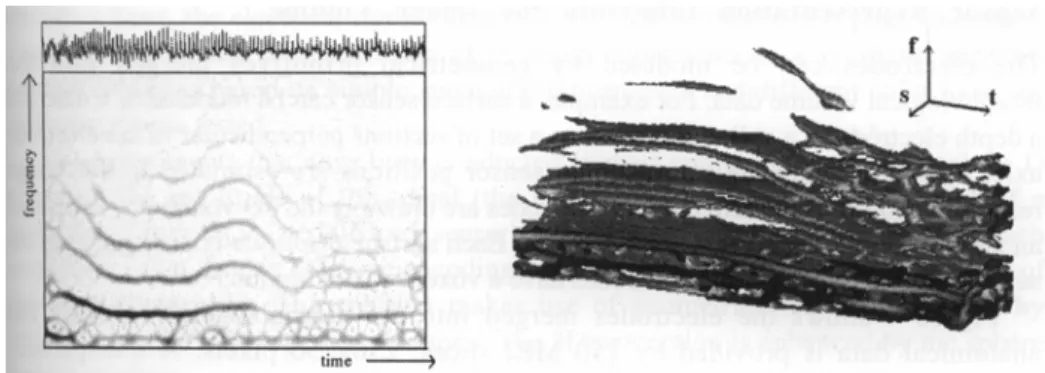
The second 2D diagram (figure 3, left side) depicts a time-frequency representation (Smoothed Pseudo Wigner-Ville distribution) that was computed in order to emphasize the non-stationary behavior of the signal [9]. The SEEG epoch (plotted on the top) was recorded during an ictal period. The vertical axis corresponds to the frequency and the horizontal one to the time. Because this representation enhances the time-frequency behavior of the signal components, it is then possible to analyze the different frequency components of the signal and to track them over time.
Fig. 3. Time-frequency representation (left) and Iso-surface representation of a volume obtained after stacking the 2D time-frequency representation diagrams (right).
If we take into account the alignment of the sensors along one in-depth electrode, several 2D diagrams can be stacked and represented as a 3D volume where the coordinates of the axes are the frequency (or the scale level), the time and the sensor positions. This volume is then rendered by the same procedures used to visualize the 3D morphological images. The resulting image (figure 3, right
side) shows a 3D visualization of a time-frequency representation of short time segments (5s) of signals acquired by one electrode (12 sensors). The inverse distance weighted interpolation was performed along the sensor's positions. The final result is produced by a ray casting technique where the surface threshold was interactively defined by the user. This kind of representation allows the use of several analyzing tools (translation, rotation, transparency), but the visual interpretation of the results is not easy just because of our non-familiarity with the space description.
3.2 Signal and Image Fusion
The knowledge of the spatial relationship between the depth electrodes and the brain structures and also the relationship between the depth electrodes and the surface ones is essential for the interpretation of the epileptic data. The depth electrodes/brain structures relationship is only partially given by the morphological imagery modalities (MRI, CT) because these modalities produce a macroscopic description of the brain structures. A more detailed description of the non-visible structures on the image modalities can be obtained by matching an anatomical atlas on the real volume. As far as we know the surface/in-depth relationship was never analyzed by the help of 3D visualization techniques.
Sensor Representation Into/onto the Image Volume
The electrodes can be modeled by geometrical primitives merged into the morphological volume data. For example, a surface sensor can be modeled as a disc and a depth electrode as a cylinder built from a set of sections perpendicular to the electrode axis, thus simulating the sensors. The sensor positions are estimated in the image reference coordinate system and the electrodes are drawn in the 3D volume by the use of an analytical description or a digitized one. Each surface electrode is orthogonal to the surface normal and the depth electrodes have a voxelized description.
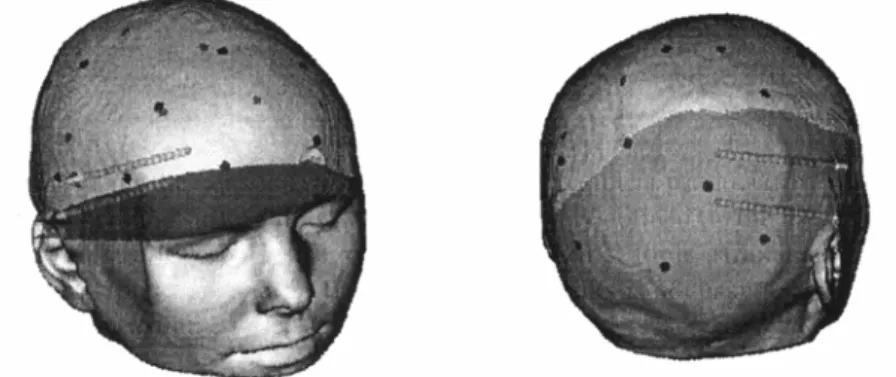
Figure 4 shows the electrodes merged into the morphological volume. The anatomical data is provided by 150 MRI slices, 256x256 pixels. A transparency coefficient is assigned to the region of interest that corresponds to the EEG measurement space (the scalp). The lower part of the head is made opaque, as well as the electrodes. Volume rendering techniques are used to achieve the visualization of the depth and surface electrodes together with the image data. The thickness of the in-depth electrodes has been artificially increased in order to enhance the perception of the representation.
Fig. 4. Visualization of the scalp surface, the surface sensors and the depth electrodes. 3D Surface Mapping
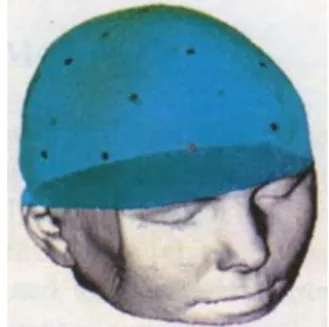
The 3D morphological surface cartography has been partially described in [10]. The overall problem, reported in [11], includes the interpolation schemes, the transparency effects, the type of the signals to be visualized (original or transformed) and the display modalities protocols. One interpolation procedure is used to estimate the potential values over all the points of the scalp, taking into account the sensors spatial sampling rate. Several procedures can be used [12]: linear interpolation, multiquadratic, spherical splines and B splines. In our case we use the spherical splines. The scalp surface where the potentials representation is projected can be rendered as opaque or transparent (figure 8). The electrical potentials are encoded by a color look-up-table that encodes the signals as blue for negative and red for positive values. The 3D shape is obtained by surface shading.
Various display protocols are available: a temporal sequence is rendered from a given point of view as a sequence of time indexed maps or as a time varying map (i.e. an animation). In this last case the frequency of display must be lower than the signal sampling frequency, in order to let the user analyze the sequence (according to our experiments, a refreshing rate of 2 to 5 images/second is acceptable). Step by step and replay facilities are also included as analyzing tools.
The result of the signal transforms (as described previously) can also be mapped. We refer [7] for an example showing an enhanced localization of a paroxystic event on the frontal area, using a 3D surface mapping of a continuous wavelet transform.
Fig. 8. 3D surface cartography (EEG) 3D Depth and Surface Mapping
We now consider the representation of a function (a linear distribution) along the depth electrodes. The problem concerning the representation of an abstract phenomenon (like the electrical potentials) is related to encoding the visual support. This encoding support can have a geometrical basis and/or one color. With the surface potentials the representation support was the scalp and the information was encoded by the color. On the other hand, the electrical signals acquired within the brain have a pinpoint nature. For this reason, the representation of in-depth signals needs a synthetic support. Several solutions based on simple geometrical primitives and different color look-up-tables have been tested.
The experiments that have been conducted suggest combining two approaches: 1) encoding the amplitude of the signal (the modulus) by a variation of the size of a geometrical support located on each sensor's position, and 2) a color is assigned to each amplitude value. In this case one encoding procedure (the size) enhances the effect of the other (the color). The solution makes use of geometrical supports defined by spheres centered on the sensor positions. The 3D perception is enhanced by the sphere surface shading.
The representation of a short time sequence of the electrical potentials recorded along the depth electrodes is displayed in figure 7, where the scalp is rendered as transparent. Potentials are encoded by a rainbow color scale and the variation of the diameter of the geometrical support (sphere) that is located on each sensor position. The support diameter varies according to the absolute value of the potential. The temporal aspect of the phenomena can then be analyzed. Because the electrical activity is directly represented in the morphological reference, its time and space coherence is immediately perceived. At the beginning of the time sequence, an electrical event occurred on the inner sensors of the electrode (left side of the windows). Some time steps later, a similar event can be observed on the inner sensor of the upper electrode.
The composition of surface and depth measurements is then possible. Figure 9 depicts four different viewing directions at the same time instant where the depth recordings are associated to the semi -transparent surface cartography. This dual representation allows to understand directly the relationship between the internal and surface measurements. This representation has as main characteristics: (i) global (surface) and local (depth) views of the phenomena are simultaneously available, and (ii) the time consuming examination and correlation of several channels is replaced by a fully integrated image that can be interactively explored.
This work has been oriented toward electrical potentials. However, this representation method can be used for any other variable that is relevant for the interpretation of the phenomena (e.g. phase delay between the sensors, frequency components).
Fig. 7. A short time sequence of SEEG signals
Fig. 9. Composition of EEG/SEEG representations
4. Conclusion
The proposed solutions for the display of in-depth or surface signals in clinical epilepsy research present a high interest to facilitate the identification of the source of paroxystic events, as well as their tracking in relation with the cortical structures, The integration in the same 3D morphological space of the signals represented by data arrays distributed along linear or surface structures gives the possibility to preserve the fundamental space-time relations.
It has been shown that the signal-image fusion can handle data of high order multidimensional spaces. The main benefit of these methods is that they can be applied to other medical areas and investigation techniques such as evoked potentials [13], electrocorticography or magnetoencephalography. The visualization of multiple anatomical structures with their respective cartographies and also the representation of volumes generated from time-scale or time-frequency transforms related to their anatomical space are now under study.
Acknowledgments. To Patrick Chauvel, Jean-Michel Badier and Patrick Marquis from the Clinical Epilepsy Research Unit of the University Hospital of Rennes, where the EEG and SEEG signals were acquired. To Lotfi Senhadji and Mohammad Shamsollahi for providing us their results on signal transforms and Fabrice Wendling for the electrical potential vs. time curves, all from the LTSI. To JNICT (Junta Nacional de Investigação Cientifica e Tecnológica, Portugal), which is supporting the work of the author C. Rocha, scholarship PRAXIS XXI/BD/5312/95.
References
1. Lopes da Silva, F.: Neural mechanisms underlying brain waves: from neural membranes to networks. Electroenceph. and Clinic. Neurophys. 79 (1991) 81-93
2. Kaufman, A. (ed.): Volume visualization. IEEE Computer Society Press, Los Alamitos, California, Order no. 1979 (1990)
3. Coatrieux, J-L., Barillot, C.: A survey of 3D display techniques to render medical data. Höhne, Fuchs, Pizer (eds.): 3-D Imaging in Medicine NATO ASI Series F60 (1990) 175-195
4. Rhodes, M. L.: Graphics in medicine. Special issue of IEEE CG&A 13-6 (1993) 49-92
5. Dillenseger, J-L., Rocha, C., Coatrieux, J-L.: 'X-Image 3D': An evolutionary software system for interactive visualization and analysis of multidimensional biomedical data. Proc. International Congress on Medical Informatics MIE 12 (1994) 590-596
6. Badier, J-M.: Etude de la localisation des sources cérébrales d'activité paroxystique par cartographie. Ph.D. Thesis, Université de Technologie de Compiègne, France (1991)
7. Senhadji, L., Dillenseger, J-L., Rocha, C., Wendling, F., Kinie A.: Wavelet analysis of EEG for mapping of epileptic events. Annals of Biomed. Eng. 25-5 (1995) 543-552
8. Senhadji, L., Bellanger, J-J., Carrault, G.: Détection temps-échelle d'événements paroxystiques intercritiques en électroencéphalographie. Traitement du Signal 12-4 (1995) 357-371
9. Shamsollahi, M. B., Senhadji, L., Le Bouquin-Jeannes, R.: Time-frequency analysis: a comparison of approaches for complex EEG patterns in epileptic seizures. Proc. IEEE-EMBS 17 (1995)
10. Dillenseger, J-L., Coatrieux, J-L.: Functional and morphological data fusion in electroencephalography. Proc. IEEE-EMBS 14 (1992) 2022-2023
11. Dillenseger, J-L.: Imagerie tridimensionnelle morphologique et fonctionnelle en multimodalité. Ph.D. Thesis, Université François Rabelais de Tours, France (1992)
12. Nielson, G.: Scattered data modeling. IEEE CG&A 13-1 (1993) 60-70
13. Gevins, A., Brickett, P., Costales, B., Le, J., Reutter, B.: Beyond topographic mapping: towards functional-anatomical imaging with 124-channel EEGs and 3-D MRIs. Brain Topography 3-1 (1990) 53-64