READ THESE TERMS AND CONDITIONS CAREFULLY BEFORE USING THIS WEBSITE. https://nrc-publications.canada.ca/eng/copyright
Vous avez des questions? Nous pouvons vous aider. Pour communiquer directement avec un auteur, consultez la première page de la revue dans laquelle son article a été publié afin de trouver ses coordonnées. Si vous n’arrivez pas à les repérer, communiquez avec nous à [email protected].
Questions? Contact the NRC Publications Archive team at
[email protected]. If you wish to email the authors directly, please see the first page of the publication for their contact information.
NRC Publications Archive
Archives des publications du CNRC
This publication could be one of several versions: author’s original, accepted manuscript or the publisher’s version. / La version de cette publication peut être l’une des suivantes : la version prépublication de l’auteur, la version acceptée du manuscrit ou la version de l’éditeur.
Access and use of this website and the material on it are subject to the Terms and Conditions set forth at
Experimental analysis and design considerations of virtual
environments creation
El-Hakim, Sabry; Boulanger, Pierre; Blais, François; Beraldin, Jean-Angelo;
Roth, Gerhard
https://publications-cnrc.canada.ca/fra/droits
L’accès à ce site Web et l’utilisation de son contenu sont assujettis aux conditions présentées dans le site LISEZ CES CONDITIONS ATTENTIVEMENT AVANT D’UTILISER CE SITE WEB.
NRC Publications Record / Notice d'Archives des publications de CNRC:
https://nrc-publications.canada.ca/eng/view/object/?id=d9bf77b0-1bea-4897-aa68-0d9aa79606d5 https://publications-cnrc.canada.ca/fra/voir/objet/?id=d9bf77b0-1bea-4897-aa68-0d9aa79606d5
National Research Council Canada Institute for Information Technology Conseil national de recherches Canada Institut de Technologie de l’information
Experimental Analysis and Design Considerations of
Virtual Environments Creation*
S.F. El-Hakim, G. Roth, and J.-A. Beraldin
January 1999
Copyright 2000 by
National Research Council of Canada
Permission is granted to quote short excerpts and to reproduce figures and tables from this report, provided that the source of such material is fully acknowledged.
*
published in SPIE Proceedings, Videometrics VI, San Jose, CA. January 28-29, 1999.Experimental analysis and design considerations of virtual environments
creation
S.F. El-Hakim
*, G. Roth, and J.-A. Beraldin
Institute for Information Technology, National Research Council,
Ottawa, Ontario, Canada K1A 0R6
ABSTRACT
Selecting the appropriate 3-D capture and modeling technologies to create the contents of a virtual environment (VE) remains a challenging task. One of the objectives of the environment-modeling project in our laboratory is to develop a design strategy for selecting the optimum sensor technology and its configuration to meet the requirements for virtual environment applications. This will be based on experimental evaluation of all performance aspects of several systems for creating virtual environments. The main problems include: practical sensor calibration, the registration of images particularly in large sites in the absence of GPS and control points, the complete and accurate coverage of all details, and maintaining realistic-look at real-time rate. This paper focuses on the evaluation of the performance of some approaches to virtual environment creation using specifically designed laboratory experimentation. By understanding the potentials and limitations of each method, we are able to select the optimum one for a given application.
Keywords: Virtual Environments, VE, 3D, Data Capture, Geometric Modeling, Calibration, Registration, Range sensors, Photogrammetry, Accuracy, Evaluation.
1. INTRODUCTION
There is an increased demand for models of objects and sites for virtual environment (VE) applications1, such as virtual museums, historical sites documentation, mapping of hazardous sites and underground tunnels (mine automation), and as-built modeling of industrial and power plants for design verification and modification. Except for image-based rendering (IBR) methods2 which do not need a geometric model, there are several procedure steps to generate the VE model:
1. Data collection to cover all necessary details. 2. Generation of 3D points or images.
3. Registration of all points or images in one coordinate system.
4. Creating an efficient geometric model, usually at various resolutions for level-of-detail (LOD) hierarchy. 5. Placing texture maps on the geometric model for realistic look.
6. Rendering at acceptable speed.
The main problems include: the practical and precise sensor calibration, the registration of images particularly in large indoor sites in the absence of external positioning tools such as global positioning systems (GPS) or control points, the complete and accurate coverage of all details, and maintaining realism during real-time display. What makes environment or site modeling more difficult than object modeling is the size and complexity. Furthermore, the site is often without closure, i.e. one or more of its ends is open and the first and last images do not overlap. This makes the registration based only on the overlapping 3D data more difficult and less accurate. Another problem is that a complete coverage of all details will require a large number of images often from different type of sensors, which requires that the data be integrated properly.
Applications requiring reality-based 3D model that is accurate and realistic looking vary significantly in their requirements. Industrial design and documentation, training, and operations in hazardous environments usually require higher geometric accuracy than marketing or visualization applications. Given the application requirements, selecting and implementing the most efficient method for data collection and modeling is not obvious. Several methods and a variety of sensors exist. They vary significantly in the ability to capture details, cost, accuracy, speed, and ease of use. Selecting the most suitable and efficient method, along with its configuration is not easy because:
*
• For some of the paradigms, actual capabilities and limitations are not known, neither are the effects of the many possible configuration parameters. Most published VE modeling experiments do not report such information as the accuracy and the amount of effort actually needed. Examples of reported accuracy or error analysis can be found in only limited number of publications3,4,5,16,26,39.
• Application requirements, such as accuracy and level of geometric details, are not really known for many applications. Some applications, such as as-built documentation require 1-2 cm accuracy3 however, most other applications do not specify a definite figure. In most cases however, modeling of complex and large environments is a compromise between what is feasible with today’s technology and what the user considers acceptable. The question is what is an acceptable geometric accuracy? For visualization and most VE applications, the main issue is whether the human observer can detect the reconstruction errors. Local errors, such as ripples or dents in a planner surface, even if they were small, are noticeable and thus not acceptable. On the other hand, much larger systematic errors, such as wrong dimensions or two walls with an angle of, for example, 93 degrees instead of 90 degrees, are not visually detectable.
In order to achieve our objective of developing some guidelines for selecting the best approach for a given set of requirements, an experimental analysis of the different methods and sensors is required. Specifically we need to:
• Collect enough data to be able to apply selected methods at various configurations.
• Produce the most accurate and photo-realistic model from each method.
• Compare all methods objectively for each evaluation category.
• Produce a guideline for design strategy for environment modeling.
The results presented here focus on model-based methods and the geometric fidelity of the model. The use of texture mapping to achieve realism has been dealt with in an earlier paper5.
The remainder of the paper is organized as follows. In the second section, a background of selected methods for environment modeling is presented. In the third section we describe the sensors and systems used for the data collection in our experiments. Section four describes the algorithms and software tools for processing the data, along with the registration, and model creation. The results of experiments performed on a specially designed test site are outlined in section five. The discussion and analysis of the results, in addition to an attempt to provide some recommendations for environment modeling, is given in the sixth section.
2. BACKGROUND OF SELECTED PARADIGMS FOR VE CREATION
A number of paradigms have been developed for acquiring and processing the data from a real scene to create virtual environments. By understanding the potential and limitations of each method, we will be able to select the appropriate one for given application requirements. However, unlike object modeling, which is more established and enjoys the availability of suitable sensors and techniques, site or environment modeling remains rather experimental. With all methods approximating the geometry, or trading off between accuracy, complexity and cost, finding a standard approach or procedure remains elusive. The methods vary from a fast, inexpensive, and fully automatic image-based rending (IBR) to a computationally challenging, costly, time consuming, and labor intensive, albeit geometrically accurate, multi-sensor approach. Several methods fill the gap between these two extremes. Most are at an early stage of development and are confined to research laboratories or designed to model a specific type of site. Nevertheless, we may classify the methods as follows:
1. Methods using range-sensor plus texture images.
2. Methods using overlapped 2D images to generate 3D points. 3. Image-based rendering methods.
4. Any combination of the above methods
In addition, each method has its own configuration parameters and various implementation alternatives. The modeling method is also intimately related to the 3D coordinate extraction technique. Surface reconstruction methods can be divided into those requiring a priori known structure of the data (such as points are organized in an image, slices or contours) and those that rely only on the data (unstructured or unorganized points). The methods vary significantly in the geometric level of
details, geometric accuracy, generated data size, cost, speed, and automation or ease of use. A short overview of these methods is given next.
2.1 Range Sensors
Range sensors can generate complete data of visible surfaces that are rather featureless to the human eye or a video camera. Furthermore, they do not require operator-assisted algorithms to generate the 3D coordinates. The disadvantages are that unreliable results may take place on highly reflective surfaces and where sharp range discontinuities exist6,14. Finally, these 3D active range sensors are usually configured for a specific volume of measurement or range and are not re-configurable.
2.1.1 Triangulation-based sensors
For applications requiring less than 10-meter range, short and medium range sensors, which are usually based on structured light and triangulation, are often employed. Short range sensors7, 8, 9 are designed for mainly small objects placed at less than 0.5 m, while medium range8, 9 can cover ranges from 0.5 m to 2 m depending on the configuration. They have been used successfully in model creation applied to cultural heritage and space10,11. For ranges between 2 m and 10 m, there are a limited number of triangulation-based sensors available. However, some systems have been built with baselines in excess of 1000 mm to cover distances up to 100 m. A sensor with such a baseline was not considered in our design for lack of compactness. For example, a more compact sensor known as the Random Access Camera (RAC) is based on the auto-synchronized scanning12 and has a baseline of only 90-mm. It can cover ranges from 0.5m to 10 m. Expected accuracy at the closest range is 0.03 mm but it is about 20 mm at the 10-m range13. A short-range sensor will require a much higher number of 3D images; thus the high accuracy of the individual images may be offset by larger error propagation due to registration. Medium range sensors require a lower number of images but the main disadvantage is that the accuracy deteriorates rapidly at longer ranges as expected with triangulation-based sensors.
2.1.2 Time of flight – time delay methods
Long-range sensors, which are capable of covering a large volume of the scene in a single image or perhaps a few images at ranges exceeding 10 meters, are usually based on the time-of-flight (TOF) technology. Data from this type of range sensor scanners, plus texture, has been used for creating VR model of the interior of large structures15,16,17. Although the large volume coverage is very convenient, since the whole scene can be covered with a small number of 3D images, the accuracy is usually in the 10-100 mm range18. These scanners also tend to be more costly than shorter-range sensors. For a given site, the choice is now between using a long range sensor that produces less accurate data but with less registration error, or a short to medium-range sensor that produce more accurate data but requires larger number of images resulting in greater registration error.
2.2. Photogrammetry
Using only overlapped 2D images, from digital still cameras, video cameras, or scanned photographs, along with some CAD information has been demonstrated in a number of practical applications3,4,19,20. The accuracy is usually higher than range sensors. However, only feature points can be obtained, which produces an unorganized set of sparse points. With the help of a CAD model, interactive editing of the resulting model, and adding texture maps, this approach can be effective particularly for architecture and uncluttered environments. The number of 3D points can be increased, to add more geometric details, as needed. However, this can be tedious for a large number of images and even not feasible if many curved surfaces and small geometric details exist. Due to the "ill-posed" nature of the problem, some constraints in the form of information about the scene, or at least strong geometric camera configuration, is required.
2.3. Image-Based Rendering
IBR is a popular and effective way of viewing virtual environments created from 2D images2,21,22. The environment is displayed as spherical or cylindrical panoramas built from a sequence of images taken by a digital camera mounted on a tripod or handheld23. Errors in composing the panoramas due to errors in intrinsic camera parameters, mainly the focal length and radial lens distortion, have been analyzed24. It has been found that solving for the focal length simultaneously with creating the panoramas can reduce the effect of error in the focal length on the length of the panorama. In most literature,
however, the evaluation is based on “visual quality” rather than any quantitative measure. Currently, this approach is not included in our experimentation, however it will be covered in the near future.
2.4. Combining Different Methods
Using multiple sensors and fusing their data generally reduces the error produced by each sensor individually, and improves the chances of detecting large errors such as speckle noise and holes. Also, since no one type of sensor is suitable for all environments and objects, the optimum design may in fact require various 3D and 2D imaging technologies to capture all details6. A range sensor may capture some of the 3D data, resulting in dense ordered points for sculptured surfaces. Overlapping 2D images and photogrammetry can be used to create the remainder of the points, a sparse set of unorganized points appropriate for planner surfaces. Image-based rendering may then be applied to surfaces at a large distance or those with which the user is not interacting, such as the openings through doors and windows25. Even with the sensor combinations, small parts of the environment will remain not captured due to shape complexity and occlusions. This means that we may also need additional data such an existing CAD model or direct measurements to accurately fill those gaps. When we are using all the different data sources for a large complex site a question remains, that is how can we effectively combine the different types of data and the different modeling paradigms together?
2.5. Choosing the optimum approach
Given the required accuracy or error bounds and the noise level in the raw data, what are the optimum sensors, configurations, and methods of computation needed in order to guarantee not to exceed the required error bounds and capture all the details? The optimum choice of sensor configuration and method of computation is the one that minimizes the effect of, or the least sensitive to, the data noise and systematic errors. Several studies of error behavior and analysis are available. We will describe and make use of these studies and fill the gaps where necessary.
For triangulation-based methods, the camera configuration is a tradeoff between good geometry and coverage. Network design, or camera configuration, for a photogrammetry-based method significantly affects the accuracy. An order of magnitude of improvement is achieved with four highly convergent cameras over the case of two nearly parallel cameras 26,27. Achieving an optimum configuration in an indoor environment where the objective is to model every surface in that environment may be unrealizable or at least impractical. Other methods for 3D reconstruction from a sequence of 2D images, such as structure from motion, have also been extensively analyzed28. For laser-scanning triangulation sensors, effect of geometric configuration can also be analyzed in a similar fashion as in photogrammetry13. However, many other error sources exist. For example speckle noise29 and edges or reflectance discontinuities13,14 may contribute much larger errors than those due to geometric configuration. One should also consider the final representation of the model. For efficient display, it is usually approximated by a mesh of triangles, thus becoming less accurate than the raw data or a CAD model.
Ease of use and automation is also an important factor, which is not emphasized when performance is evaluated in the literature. For example, using a sequence of 2D images requires some manual intervention to generate 3D data. Although efforts are being made to automate this process, expertise is required, not only in the processing of data but also at the acquisition stage. On the other hand, laser scanners, when properly calibrated, directly and automatically generate 3D points. The cost of the system components and speed of all operations, from acquisition to display, are important parameters of any environment modeling system. Laser scanners that are capable of capturing large volume at high speed are usually the most expensive of data acquisition devices, not only because they require costly components and careful design and assembly, but also because they are not widespread commercially. Conversely, off-the-shelf video and digital still cameras are the least expensive. If we consider the speed of generating the 3D coordinates, the comparison becomes less obvious. Laser scanners may take longer to capture the data, but they output 3D coordinates of all scanned points directly. On the other hand, video and digital cameras can acquire images fast, however, post-processing is still required to generate only a rather limited number of 3D coordinates.
2.6. The environment modeling project at NRC
The goal of the environment-modeling project at the Visual Information Technology (VIT) group at NRC is a comprehensive technology demonstration, evaluation, and transfer to industry for practical applications. One of the first tasks is to experimentally test various data acquisition and modeling techniques for modeling of sites of various complexity and size. All the parameters mentioned in the preceding sub-sections will be evaluated for each paradigm. The first results from this
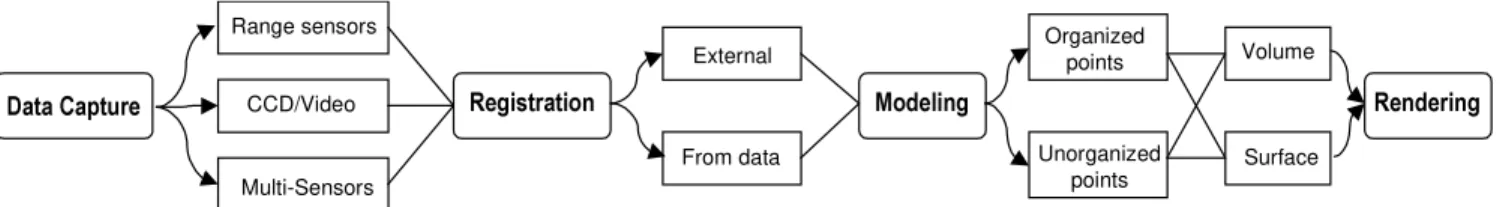
project will be described in the following sections. We will initially consider only model-based techniques and will include IBR in the future. Specifically, the various paradigms we are currently analyzing are summarized in figure 1. These are by no means comprehensive, nevertheless they give an idea of the different ways one can accomplish the environment modeling task. For instance, in the registration process, one may obtain the position and orientation of each image a priori from a different instrument or positioning system (the external method) or from the 3D data itself. Not shown in the figure is that the modeling procedure includes various algorithms for data integration, or view merging, to deal with the overlapped portions of the data, along with polygon simplification30 to optimize the rendering procedure. Moreover, texture-mapping31 is not included in this figure since it will not be dealt with in the tests presented in this paper.
'DWD &DSWXUH Range sensors CCD/Video Multi-Sensors 5HJLVWUDWLRQ External From data 0RGHOLQJ Organized points Unorganized points Volume Surface 5HQGHULQJ
Figure 1: Possible model-based directions to create virtual environments, from data capture to rendering.
3. DATA CAPTURE
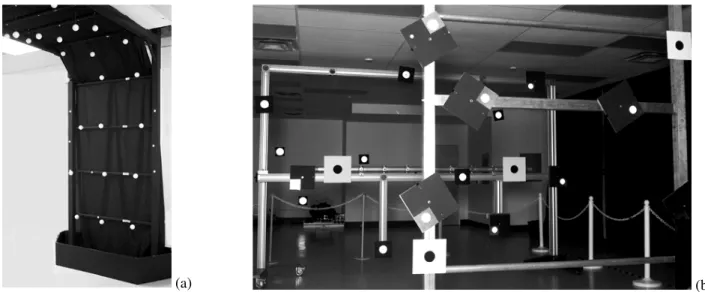
Two hardware set-ups were used for the experiments, the first is a multi-sensor data capture system and the second is a longer-range laser range sensor. The design objective of the multi-sensor data capture system for our experimental analysis is to acquire geometric and photometric data from relatively large environments and output registered 3D and 2D images. The system must be flexible and easily configurable to the various test cases. The only restriction on mounting the sensors is that each must have an unobstructed field of view. To satisfy the flexibility requirement, different types of sensor, mainly laser scanners, analogue CCD cameras, and digital still color cameras are employed. Figure 2 shows this data collection mobile platform with 12 analogue video CCD cameras, digital still camera with 1152x864 pixels resolution mounted on a pan-tilt unit, and a range sensor, Biris32, capable of ranges up to about 3.2 m, mounted on another pan-tilt unit. An industrial PC with a flat touch-screen-display controls all components. A longer-range sensor, the RAC mentioned in section 2.1, is also used in the experiments (Figure 3). At present, this range sensor is mounted on its own tripod with its own computer hardware and power supply. However, a more portable version is currently being developed and will replace the shorter-range sensor on the platform. This new version of the RAC will cover ranges from 1.0 m up to about 10 m.
Up to 12 CCD cameras Range sensor
on pan-tilt unit Digital color camera
on pan-tilt unit
Industrial PC
Figure 2: The mobile data acquisition platform
Figure 3: The RAC mounted on tripod and a pan-tilt unit.
4. DATA PROCESSING, REGISTRATION, AND MODELING TOOLS
For the display, processing, manipulation of images, calibration, registration, and geometric modeling, several software tools are employed. Some of the software is commercially available while the remainder is developed at our laboratory. The various tools are briefly described here.
4.1. The Virtual Reality Builder (VRB) Software Tool
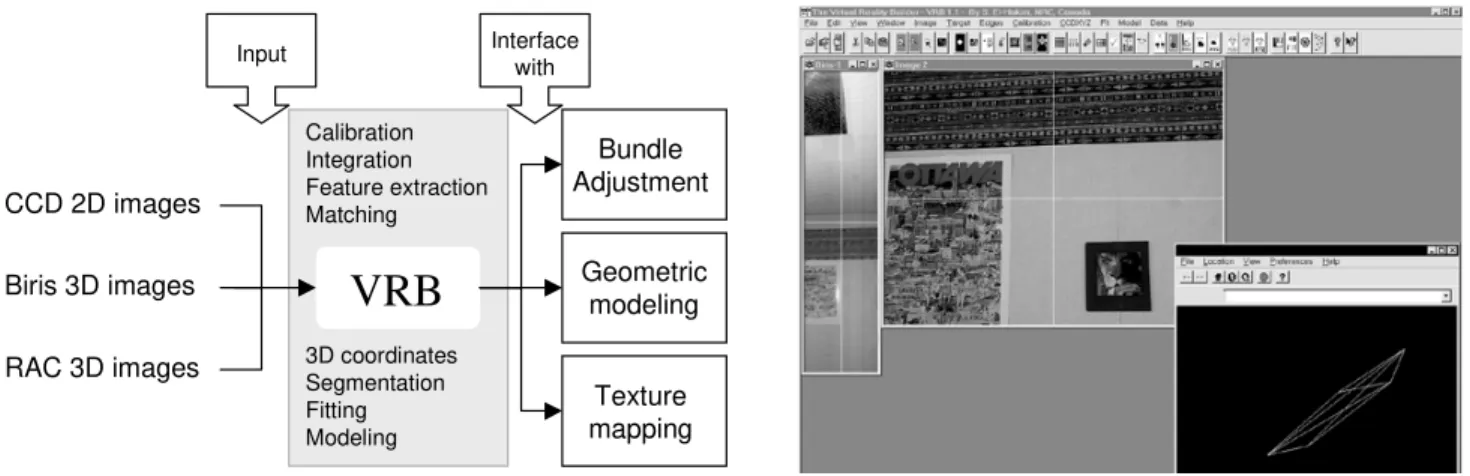
Before presenting the results of the experiments, it may be useful to describe the main software tool developed for this purpose. It is a model creation tool that is written in C++ for the purpose of accurate calibration, registration, and 3D-point generation. It can process data from all the sensors used for our experiments, mainly digital 2D images and range images from Biris and the random access camera. It can perform precise calibration of all these sensors and interactively register their data. It has feature extraction capabilities for targets, edges and corners as well as 3D surface segmentation. Stereo matching and computation of 3D coordinates of points from overlapped 2D images is also automatically performed. Some basic surface modeling of unorganized points and texture mapping using VRML are also possible. The program interfaces with the bundle adjustment and more advanced geometric modeling and texture-mapping programs. Since many of the operations required to extract the 3D model from the various types of data remain manual, the program is made to be user friendly and includes many time saving features. Keeping track of all the images and their parameters, and all the extracted 2D and 3D points is handled automatically.
VRB
CCD 2D images Biris 3D images RAC 3D images Bundle Adjustment Geometric modeling Texture mapping Calibration Integration Feature extraction Matching 3D coordinates Segmentation Fitting Modeling Input Interface withFigure 4: The VRB software tool takes various sensor data and interfaces with bundle, modeling, and texture mapping tools.
4.2. Selected Registration Procedures and Tools
For the 3D data, two registration methods were used, the first is a photogrammetric method and the second is an instance of the iterated closest point (ICP) method using PolyWorks software. For the registration between the texture-mapping images and the 3D model, the VRB software described above is employed.
The photogrammetry-based registration approach was described in details in an earlier publication33 and is only summarized here. The analogue CCD cameras within one cart position are mounted so that they produce a strip of images. These images are pre-registered, i.e. their parameters relative to each other are known. On the other hand, relative location parameters of images in different strips (different cart positions) are unknown. These parameters are computed from bundle adjustment, using the known relative camera locations in each cart position as constraints. Additional constraints from the known relationships between points, as determined from range sensor data, are utilized to strengthen the bundle solution.
The second method minimizes the registration errors of all views simultaneously by minimizing the distance between the measured points of each view and the interpolated surfaces from all other views34. This approach is effective only if the surface itself offers enough constraints or structural complexity and sufficient overlap must be present between pairs of view, including first and last image.
4.3. Selected Geometric Modeling Approaches and Tools
Approaches for geometric modeling are of two types. They either take advantage of the existing structure of the data points organized in image format, slices, or contours, or they operate directly on unorganized points. The methods can be further subdivided based on whether they are volume-based or surface-based. Three methods were used in our tests. A volume-based approach that uses either organized or unorganized points, a based approach that uses organized points, and a surface-based approach using unorganized points.
The first algorithm is a voxel-based mesh creation algorithm developed in our laboratory36. The marching-cubes algorithm35 is used to generate the triangles for each voxel. This approach has the following characteristic:
• It uses a simple voxel data structure, which is very efficient in both space and time.
• It is able to process 3D data in raster, profile and point cloud format.
• It has a number of different ways of handling noisy and spurious 3D data points.
• It can fill holes in the triangulation to close the mesh and create a true volumetric model.
• It can report the accuracy of the triangular mesh relative to the original 3D data.
• It can handle 3D data that has an associated intensity or color value.
The goal in mesh creation is usually to achieve specified mesh accuracy relative to the original data. Typically, this required accuracy is in the range of 1/10 mm to 2 mm. Note that when we speak of modeling accuracy we are talking about the faithfulness of the final triangulation relative to the 3D data. That is not the same as the accuracy of the original 3D data relative to the true object geometry. The accuracy of the created mesh relative to the 3D data in a voxel-based approach depends on the voxel size. It is possible to increase the mesh accuracy by simply reducing the voxel size. However, the voxel size must be at least two to three times greater than the sampling density of the 3D data. For this reason, all voxel algorithms by their nature tend to smooth the original data. This tends to blur small details, but also reduces noise.
The second approach is an iterative multi-resolution surface triangulation technique that computes coarse surface triangulation from an initial high-resolution surface triangulation37. A sequential optimization process is implemented in order to remove, in each iteration, the vertex minimizing the re-triangulation error. The aim of the sequential algorithm is thus to remove the maximum number of vertices while keeping the triangulation error as low as possible. The equi-angularity of surface triangulation is optimized in 3-D space throughout the sequential process. The algorithm also preserves triangulation topology and orientation discontinuities on the surface. The processed surface triangulation should form a closed 3-D volume to reduce registration errors but this condition is not mandatory. The software tool PolyWorks from Innovmetric Software Inc., which applies this method, has been used for our tests.
The third approach is used mainly for unorganized 3D points38. The unorganized point approach does not make any prior assumptions about the connectivity of points. This is usually the case with 3D points generated by a photogrammetric technique. The software tool Wrap from Raindrop Geomagic Inc. implements this approach. The initial surface is a convex hull guaranteed to be closed and manifold. However, it is usually the case that an editing is required to remove unwanted filled sections of the model. This software tool provides an easy semi-automatic visual editing of the initial model to generate the desired final surface.
5. TEST RESULTS AND ANALYSIS
The test-site for studying the various approaches to environment modeling is located at the top floor of our labs. The site was originally an open room covering the entire floor area before we divided it into the shape and dimensions shown in figure 5. The dividing walls can be removed and repositioned to create a new site with different shape and dimensions when desired. The site contains wood carving wall decorations, moldings, posters, highly textured wall papers, pipes, and surfaces with various reflectance properties. All these items are easily removed or reconfigured, and new items can also be added for future experiments. One of the sides is open to the rest of the floor, while the other sides have no openings such as doors or windows. The underlying idea behind this first site design is to have basic geometric shapes with sufficient variations to test the quality of data registration and dimensional accuracy and assess the problems and the amount of effort required with each approach. Once this is tested, we can proceed with added complexities such as openings, doors, windows, columns, and standing objects in the interior of the room, in addition to sub-divisions into multiple rooms.
The following tests were carried out:
• Test A: Short-range sensor (Biris) with registration from a photogrammetric bundle adjustment and modeling by automatic volume-based triangulation using in-house software.
• Test B: Overlapped 2D images and photogrammetric bundle adjustment only, using in-house software, and modeling by creating convex hull then visually editing it using Wrap software.
• Test C: Medium-range sensor (the RAC) with registration by an ICP method and modeling by automatic surface-based triangulation using PolyWorks software.
4.724m 6.452m 8 .38 2m 2 .74 3m
*Arrows show acquisition directions
Figure 5: The test site.
5.1. Calibration accuracy
All the sensors used for the experiments were calibrated using targets mounted on stable structures and accurately measured by theodolites (figure 6). The calibration accuracy for each sensor, which was checked by measuring known targets with the sensors, is displayed in table 1.
(a) (b)
Sensor X Y Z
CCD cameras at 2.5 m 0.16 0.27 0.32
Biris at 2.5 m range 2.53 3.69 2.54
RAC at 18 m range 15.8 23.7 17.1
The calibration of the RAC was only partially correct. Even though our calibration laboratory is 20 m in length, its width and height is less than the coverage of the RAC, which has 40ox50o field of view. This means that the areas near the edges of the 3D images produced by the camera will be somewhat distorted since the calibration targets did not cover those regions. For the Biris and the CCD cameras, the calibration accuracy was within expectations.
Table 1: Calibration accuracy
5.2. Registrations Accuracy
Using known, independently measured, distances between several features, across a significant number of images, checked the registration accuracy. The root mean square of the differences between the known distances and the distance obtained by each approach were:
• Test A: Registered short-range sensor images (68 images): 16 mm (About 8 mm at the short section and 20 mm at the wider section of the room. This could be due to the fact that the wider section is outside the calibrated range of the range sensor.)
• Test B: Photogrammetric bundle adjustment points (204 images): 6 mm
• Test C: Registered medium-range sensor (RAC) images (20 images): 49 mm
Accuracy of bundle adjustment was not as high as reported in inspection applications, which can be one part in 25,000 to 100,000. Here we only achieved about one part in 2000. Many reasons contribute to this, but mainly pointing error (by design, no well-defined targets or sharp edges were used), using standard analogue cameras (640x480 pixels) and frame grabbers, small camera baselines, and non-convergent images. In addition, no control points were used anywhere. This demonstrates that such a far from ideal configuration resulted in an error propagation from about 0.3 mm in a single position (12 images) to 6 mm over the full 17 positions (204 images).
Since the test site has an open side, the ICP registration method did not originally give accurate results even though the number of images was small. When several objects, such as room dividers, were added to fill the opening to ensure that there will be an overlap between the first and last 3D image, the method worked better. Another factor affecting the accuracy of the ICP registration is the fact that some walls have large planner surfaces without much 3D details.
5.3. Geometric Modeling
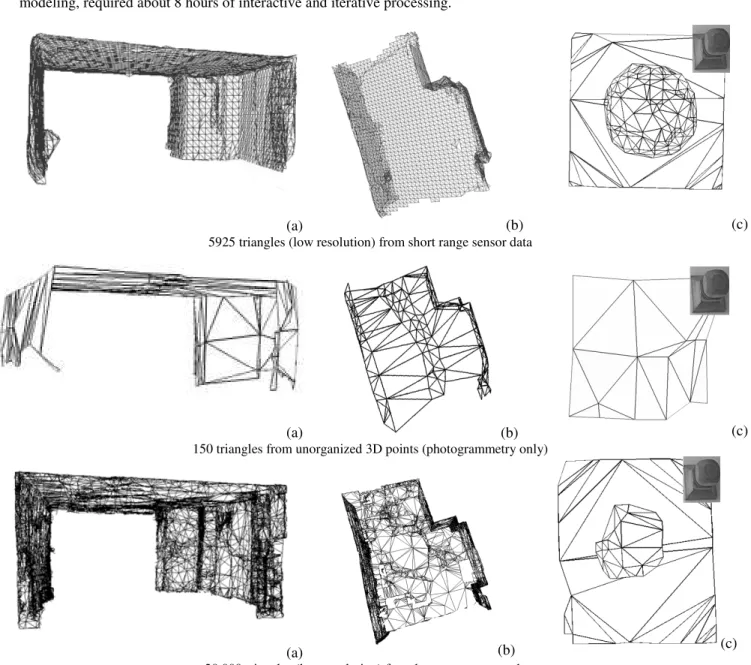
Figure 7 shows the results of the geometric modeling of the same site using three different types of data, each with a different registration technique and a different modeling approach (tests A, B, and C described above). The figure is self-explanatory and shows clearly the differences between each approach. Figures (a) and (b) show the overall shape of the site while (c) show the level of detail on a close up portion. One can observe an error in the shape of the left wall (figure 7(a), test B) due to lack of accurate points on the edge where the wall meets the ceiling. Also in Figure 7(b), test C, an inaccurate registration by the ICP method could be noticed on the long and flat left wall.
5.4. Speed and Effort
The speed of creating the virtual environment and the level of effort and expertise required are better assessed by breaking each test into separate components and evaluating each component individually. The components are data acquisition, 3D coordinate computation, registration, and geometric modeling. The times do not include data acquisition for texture images or texture mapping since these are more or less the same for all methods.
• Test A: Data acquisition time was approximately 50 minutes, and was fully automatic once the sensors were set up on the cart in such a way that the overlapped images cover the intended scene. Set up time took only a few minutes since this site had no visibility problems, an issue that will be analyzed in future tests. The 3D coordinate computation required no additional time, but the registration required about 4.5 hours of interactive feature extraction and processing. The geometric modeling was fully automatic and required about 5 minutes to complete.
• Text B: Data acquisition was only 4 minutes, and was fully automatic but required set up similar to test A. The 3D coordinate computation and the registration steps are combined in the bundle adjustment and required about 4 hours of
interactive feature extraction and processing. The geometric modeling was initially fully automatic and required a fraction of a second, but required interactive visual editing which was easy to perform in about a minute.
• Test C: Data acquisition was approximately one hour, and required more expertise to operate and set up the camera than the other two tests. The 3D coordinate computation required no additional time, but the registration and geometric modeling, required about 8 hours of interactive and iterative processing.
(a) (b) (c)
5925 triangles (low resolution) from short range sensor data
(a) (b) (c)
150 triangles from unorganized 3D points (photogrammetry only)
(a) (b) (c)
20,000 triangles (low resolution) from long range sensor data
Figure 7: The geometric model from 3 different paradigms. (a) front view, (b) top view, (c) one close up detail
6. CONCLUDING REMARKS
In this paper we addressed the problem of selecting the most suitable and efficient method for a given virtual environment application. It is important to note that our objective is not to promote a particular approach but rather to compare and analyze the various alternatives available. We based our analysis of the methods on specifically designed experiments in our laboratory test site. Since this project is still a work in progress, the performance analysis of the various approaches is by no means complete. For example, error numerical quantification of all methods, either by functions or look-up tables and curves, is being prepared. The effect of texture on geometric models with varying accuracy and details is being evaluated. Also a
more automatic procedure for registering the texture from a 2D image on the geometric model produced by another sensor needs to be developed to complete our set of tools. This process is currently carried out manually for each texture image since no information on the position of the 2D sensor is usually available. In spite of all the work that remains to be done, several design considerations have already emerged from the completed experiments:
• Considering only the environment shape as a whole, the photogrammetry approach provided the highest geometric accuracy at the lowest cost. However, the model generated from the unorganized points required interactive editing to remove a large number of unwanted triangles. Also several iterations between extracting 3D points and modeling were required, mainly to add new points to define surface intersection lines and points. Without points in the appropriate locations, a corner for example will be modeled incorrectly as a single plane rather than the intersection of three planes. A lack of points at somewhat complex surfaces will also result in many geometric details being approximated by planes when modeled (see figure 7c). This is usually overcome to a degree by texture mapping, however several tests remain to be carried out to actually verify the effectiveness of the texture mapping approach.
• For 3D images produced by a range sensor, a registration method from a positioning device or a source other than the 3D data itself may be required to register the data in most environments. Unless there is an overlap between the first and last 3D image, methods such as ICP will not be sufficiently accurate. Having this overlap is not a problem for objects, however, for sites there may be large openings that make this difficult to accomplish. Planer surfaces, particularly if they are large, will also cause registration problems using only data-based methods.
• Triangulation-based range sensors which can provide images of large volumes at more than 10 m range are not easy to calibrate. Since we are using a model-based calibration procedure, targets with known positions covering the full scanning volume are needed. This can become unmanageable and cumbersome and is often not readily available. Therefore, a more practical calibration procedure for these sensors, based on the use of planes in the scene rather than measured targets, is now being developed at our laboratory.
ACKNOWLEDGEMENTS
We would like to extend our appreciation to Luc Cournoyer and Charles Massicotte for performing the RAC imaging and modeling, and to Louis-Guy Dicaire for developing some of the data acquisition software.
REFERENCES
1. M. Sheehan. Virtual Environments. SRI Consulting TechMonitoring Report, 65 pages, October, 1997.
2. S.B. Kang, "A survey of image-based rendering techniques", Technical Report CRL 97/4, Cambridge Research Lab, Digital Equipment Corp., 1997.
3. G. Hilgers, H.-J. Przbilla, D. Woytowicz, "The digital photogrammetric evaluation system PHAUST for as-built documentation", Proc. ISPRS Comm. V, pp. 226- 229, Hakodate, Japan, 1998.
4. H. Haggren, S. Mattila, "3D indoor modeling from videography", SPIE Vol 3174, Videometrics V, pp. 14-20, 1997. 5. S.F. El-Hakim, C. Brenner, G. Roth, "A multi-sensor approach to creating accurate virtual environments", ISPRS
Journal for Photogrammetry and Remote Sensing, 53(6), December 1998.
6. S.F. El-Hakim, J.-A. Beraldin, "On the integration of range and intensity data to improve vision-based three-dimensional measurements", SPIE Proc., Vol. 2350, Videometrics III, pp. 306-321, 1994
7. Hymarc Ltd., http://www.hymarc.com 8. Vitana Corp., http://www.vitana.com 9. Cyberware Inc., http://www.cyberware.com
10. J-A Beraldin, L. Cournoyer, M. Rioux, F. Blais, S.F.El-Hakim and G. Godin. Object model creation from multiple range images: Acquisition, Calibration, Model Building and Verification. International Conf. on Recent Advances in 3-D 3-Digital Imaging and Modeling, Ottawa, Canada: 326-333. May 12-15, 1997.
11. J.-A. Beraldin, F. Blais, L. Cournoyer, M. Rioux, F. Bernier and N. Harrison. Portable digital 3-d imaging system for remote sites. The 1998 IEEE International Symp. on Circuit and Systems, Monterey, CA, USA: 326-333. May 31-June 3, 1998.
12. F. Blais, J.-A. Beraldin, M. Rioux, R.A. Couvillon, S.G. MacLean, ''Development of a real-time tracking laser range scanner for space applications'', Workshop on Computer Vision for Space Applications - Antibes, Sept. 22-24, 1993.
13. S.F. El-Hakim, J.-A. Beraldin. "Configuration design for sensor integration", SPIE Proc., Vol. 2598, Videometrics IV, pp. 274-285, 1994.
14. M. Buzinski, A. Levine, W.H. Stevenson, "Performance characteristics of range sensors utilizing optical triangulation", Proc. IEEE/AESS National Aerospace and Electronics Conf., pp. 1230-1236, 1992.
15. Y. Miyatsuka, X. Chen, Y. Takahashi, "Archaeological 3D GIS for virtual museum in Damascus", Proc. ISPRS Comm. V, pp. 348- 355, Hakodate, Japan, 1998.
16. K. Ng., V. Sequeira, S. Butterfield, D. Hogg, J.G.M. Goncalves, "An integrated multi-sensory system for photo-realistic 3D scene reconstruction", Proc. ISPRS Comm. V, pp. 356- 363, Hakodate, Japan, 1998.
17. A.E. Johnson, R. Hoffman, J. Osborn, M. Hebert, "A System for semi-automatic modeling of complex environments", Proc. International Conference on Recent Advances in 3-D Digital Imaging and Modeling, Ottawa, pp. 213-220, 1997. 18. M. Hebert, E. Krotkov. "3-D Measurements from Imaging Laser Radars: How Good Are They?'' International Journal
of Image and Vision Computing, 10(3), pp. 170-178, 1992.
19. D. Chapman, A. Deacon, "Panoramic imaging and virtual reality - filling the gaps between the lines", ISPRS Journal for Photogrammetry and Remote Sensing, 53(6), December 1998.
20. P.E. Debevec, C.J. Taylor, J. Malik, "Modeling and Rendering Architecture from Photographs: A hybrid geometry and image-based approach", Proc of ACM SIGGRAPH'96, pp. 11-20, 1996.
21. L. McMillan, G. Bishop, "Plenoptic modeling: An image-based rendering system", Proc. of ACM SIGGRAPH’95, pp. 39-46, 1995.
22. T. Kondo, K. Oda, M. Obata, T. Doihara, "Automated mosaicing from video imagery captured from moving platform", Proc. ISPRS Comm. V, pp. 743- 745, Hakodate, Japan, 1998.
23. R. Szeliski, H.-Y. Shum, "Creating full view panoramic image mosaics and environment maps", Proc. Of ACM SIGGRAPH’97, pp. 251-258, 1997.
24. S.B. Kang, R. Weiss, "Characterization of errors in compositing panoramic images", Technical Report CRL 96/2, Cambridge Research Lab, Digital Equipment Corp., 1996.
25. D. Aliaga, A.A. Lastra, "Architectural walkthroughs using portal textures", Proc. IEEE Visualization'97, pp. 355-363, 1997.
26. C.S. Fraser, "Network design", In K.B. Atkinson (ed.): Close Range Photogrammetry and Machine Vision. Whittles Publishing, UK, 375 pages, pp. 256-281, 1996.
27. S. Mason, "Expert system-based design of close-range photogrammetric networks", ISPRS Journal of Photogrammetry and Remote Sensing, 50(5), pp. 13-24, October, 1995.
28. S. Soatto, P. Perona, "Reducing structure from motion: a general framework for dynamic vision Part 2: Implementation and experimental assessment", IEEE Trans. Pattern Analysis and Machine Intelligence, 20(9), pp. 943-960, Sept. 1998. 29. R. Baribeau, M. Rioux, "Influence of speckle on laser range finders", Applied Optics, 30, pp. 2873-2878, 1991.
30. D. Luebke, "A survey of polygonal simplification algorithms", Dept. Computer Science, University of North Carolina, Chapel Hill, Tech. Report TR97-045, 1997.
31. M. Weinhaus, V, Devarjan, "Texture mapping 3D models of real-world scenes", ACM Computing Survey, (29)4, 325-365, 1997.
32. F. Blais, M. Lecavalier, J. Bisson, "Real-time processing and validation of optical ranging in a cluttered environment", ICSPAT, Boston, MA, pp. 1066-1070, 1996.
33. S.F. El-Hakim, P. Boulanger, F. Blais, J.-A. Beraldin, "A system for indoor 3D mapping and virtual environments", SPIE Proc., Vol. 3174, Videometrics V, pp. 21-35, 1997.
34. R. Bergevin, M. Soucy, H. Gagnon, D. Laurendeau, "Towards a general multi-view registration technique", IEEE Trans. Pattern Analysis and Machine Intelligence, 18(5), pp. 540-547, May 1996.
35. W.E. Lorensen, H.E. Cline, "Marching cubes: a high resolution 3D surface reconstruction algorithm", Computer Graphics. ACM SIGGRAPH'87, 21(4), July, pp.163-169, 1987.
36. G. Roth, E. Wibowo, "An Efficient volumetric method for building closed triangular meshes from 3-D image and point data", Proc. of Graphics Interface 97, pp. 173-180, 1997.
37. M. Soucy, D. Laurendeau, "Multiresolution surface modeling based on hierarchical triangulation", Computer Vision and Image Understanding 63(1), 1–14, 1996.
38. H. Edelsbrunner, E. Mucke, "Three-dimensional alpha-shapes", ACM Transaction on Graphics, 13, pp.43-72, 1992. 39. Y.C. Hsieh, D.M. McKeown, F.P. Perlant, “Performance evaluation of scene registration and stereo matching for