Publisher’s version / Version de l'éditeur:
Vous avez des questions? Nous pouvons vous aider. Pour communiquer directement avec un auteur, consultez la première page de la revue dans laquelle son article a été publié afin de trouver ses coordonnées. Si vous n’arrivez pas à les repérer, communiquez avec nous à [email protected].
Questions? Contact the NRC Publications Archive team at
[email protected]. If you wish to email the authors directly, please see the first page of the publication for their contact information.
https://publications-cnrc.canada.ca/fra/droits
L’accès à ce site Web et l’utilisation de son contenu sont assujettis aux conditions présentées dans le site LISEZ CES CONDITIONS ATTENTIVEMENT AVANT D’UTILISER CE SITE WEB.
Inter-Noise 2004 [Proceedings], pp. 1-6, 2004-08-01
READ THESE TERMS AND CONDITIONS CAREFULLY BEFORE USING THIS WEBSITE. https://nrc-publications.canada.ca/eng/copyright
NRC Publications Archive Record / Notice des Archives des publications du CNRC :
https://nrc-publications.canada.ca/eng/view/object/?id=c13b945b-1b00-48ca-bb86-db345f28bf65 https://publications-cnrc.canada.ca/fra/voir/objet/?id=c13b945b-1b00-48ca-bb86-db345f28bf65
NRC Publications Archive
Archives des publications du CNRC
This publication could be one of several versions: author’s original, accepted manuscript or the publisher’s version. / La version de cette publication peut être l’une des suivantes : la version prépublication de l’auteur, la version acceptée du manuscrit ou la version de l’éditeur.
Access and use of this website and the material on it are subject to the Terms and Conditions set forth at Forward and reverse transmission loss measurements
Forward and reverse transmission loss measurements
Warnock, A.C.C.
NRCC-47035
A version of this document is published in / Une version de ce document se trouve dans : Inter-Noise 2004, 33rd International Congress and Exposition on Noise Control Engineering,
Prague, Czech Republc, August 22-25, 2004, pp. 1-6
The 33rd International Congress and Exposition on Noise Control Engineering
1/6
Forward and Reverse Transmission Loss Measurements
A.C.C. Warnock
Institute for Research in Construction, National Research Council Canada, 1200 Montreal Road, Ottawa, Ontario K1A 0R6, Canada
Abstract [175] According to the simple theory underlying measurements of sound transmission loss, it should not matter which of the two rooms is selected as the source room; the sound fields are assumed to be diffuse. In practice, different values of sound transmission loss are measured when the roles of the rooms are reversed. The differences exceed the repeatability limits for the test and are seen throughout the frequency range for standard testing. These differences can give rise to two different
single number ratings – STC or Rw – for the same structure tested in a single laboratory. No criteria are
given in standard test methods for selecting which room is the source when testing normal walls and floors. The solution proposed here is that standards should require testing in both directions. Differences at low frequencies can be attributed to modal responses of the rooms and the specimen. No explanation for the differences at high frequencies has been found.
1 INTRODUCTION
There are two main standard methods for measuring sound transmission loss (sound reduction index) using the two-room method – ASTM E90 [1] and ISO 140-3 [2]. Both only require that measurements be made in one direction – one of the rooms is designated as the source room, the other automatically is the receiving room. Neither standard gives any guidance on how to select the role for each room in most cases. ISO 140-3 does specify that if one surface of the specimen is more absorptive than the other, the more absorptive surface shall be in the source room. Users may also choose to test in two directions but it is not mandatory.
At low frequencies the room modal response influences the measured transmission loss values, and so is a factor in determining the reproducibility of the two-room test methods. Measurements made in both directions [3] at the National Research Council showed differences in transmission loss at low frequencies that were large enough to give different sound transmission class (STC) [4], or weighted sound reduction index (Rw)[5] ratings. This observation caused us to routinely measure
transmission loss in both directions in our test facilities. This paper presents the findings. The data for three room pairs show differences at low frequencies as expected but there are also unexpected and often quite large differences at high frequencies.
2 TEST ROOMS
In the wall test suite originally built at NRC around 1955, one room had a volume of 65 m3 and the other a volume of 250 m3. Both rooms were essentially box-shaped and the smaller was used as the
source room for many years. In 1998 the smaller room was replaced [6] with one having a volume of 145 m3. This new room has a pentagonal floor plan. The NRC floor test suite [3] was commissioned in 1992 and has room volumes that are approximately equal at 175 m3. Each room is equipped with four loudspeakers with separate amplifiers and noise sources. Average sound pressure levels are determined by moving the microphone in each room to nine different positions. Since 1997 enough data have been collected in all three test suites to allow a closer examination of differences in transmission loss when the direction of the test is changed.
3 EXAMPLE OF DIFFERENCES
When transmission loss plots for the two measurement directions are compared on a single chart, it is not always obvious that there are significant differences. Occasionally, however, differences are enough to cause the STC or Rw ratings to be different. Figure 1 shows one such result measured in
the floor facility. In this case, “forward” and “reverse” mean the upper room and the lower room respectively act as the source room.
10 20 30 40 50 60 70 80 63 125 250 500 1k 2k 4k Frequency, Hz TL , d B reverse STC 56, Rw 54 forward STC 54, Rw 54
Figure 1: Sound transmission loss measured in two directions in the floor facility.
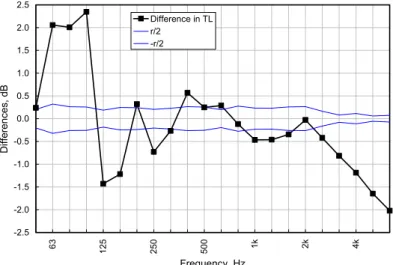
The graph shows differences in transmission loss at low frequencies as might be expected but there are also differences at high frequencies. The STC rating differs by two points for this floor while, in this case, the Rw rating is the same. When only differences are plotted, as in Figure 2, it is clear that
the differences are much greater than the repeatability limits for the facility. These transmission loss differences are not random. Once a specimen has been installed, the differences do not change significantly when the measurements are repeated.
4 MEAN NORMALIZED DIFFERENCES
Microphone calibration errors might explain some part of these differences. In all three facilities, the movable microphone in each room is calibrated each day before testing begins using a pistonphone. Inspection of many of these difference plots suggests that the average difference for the frequency range 200 to 800 Hz is zero. In some cases there were small but obvious biases due to the uncertainty associated with calibration. To minimize any effects due to calibration uncertainty, each difference spectra was normalized so the mean difference in the frequency range 200 to 800 Hz was zero. Although this normalization was applied, it did not change the average values to any great extent because calibration uncertainty is less than the changes seen due to changing measurement direction.
3/6
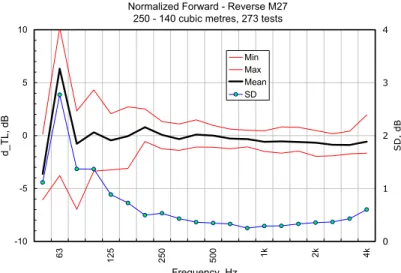
The normalized differences for each test suite are shown in Figure 3, Figure 4, and Figure 5. Each graph shows the mean difference, the minimum and maximum differences observed and the standard deviation of the differences. It is disturbing that the average difference for each test suite is not zero at all frequencies. It is even more disturbing that the maximum and minimum differences observed are so different from zero. Such differences can be expected to lead to differences in single number ratings – sound transmission class, weighted sound reduction index and others. While the details differ, each test suite shows the same kind of general behavior.
-2.5 -2.0 -1.5 -1.0 -0.5 0.0 0.5 1.0 1.5 2.0 2.5 63 125 250 500 1k 2k 4k Frequency, Hz Differences, dB Difference in TL r/2 -r/2
Figure 2: Difference in transmission loss for two measurement directions compared with repeatability limits for the floor facility.
Forward - reverse M59 - normalized to 200-800 average 175 cubic metres, 197 tests
-10 -5 0 5 10 63 125 250 500 1k 2k 4k Frequency, Hz d_T L, dB 0 1 2 3 4 SD , dB Min Max Mean SD
Normalized Forward - Reverse M27 250 - 140 cubic metres, 273 tests
-10 -5 0 5 10 63 125 250 500 1k 2k 4k Frequency, Hz d_T L, dB 0 1 2 3 4 SD , dB Min Max Mean SD
Figure 4: Normalized forward-reverse differences for current wall facility
Forward -Reverse TL, normalized 250 -65 cub m, 131 tests -10 -5 0 5 10 63 125 250 500 1k 2k 4k Frequency, Hz d_T L, dB 0 1 2 3 4 SD , dB Min Max Mean SD
Figure 5: Normalized forward-reverse differences for old wall facility
The conclusion that derives from these data is not really new. The expression used to calculate transmission loss, TL = L(source) – L(receive) + 10 log S/A, is only an approximation to the reality of reverberation room test suites. It is commonly assumed that when the measurement frequency is high enough – above the Shroeder frequency for example – that the rooms provide a good approximation to the ideal diffuse field. If this is so, transmission loss should not depend on measurement direction, but it does.
A laboratory operator may choose to reject measurements where the smaller of two rooms acts as the receiving room on the grounds that modal effects are likely to be more pronounced there. There is no basis for rejecting measurements into the smaller of the two rooms at higher frequencies. So, given two sets of transmission loss measurements in different directions, it is only practical to take the mean as the best estimate of the true value.
5 VARIATIONS IN SINGLE NUMBER RATINGS
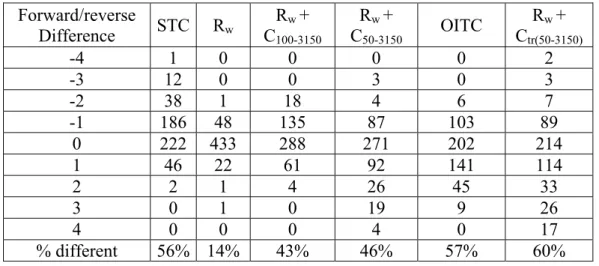
These differences cause differences in the summary ratings generated by the test methods depending on which direction the test was run. The table below shows the distribution of differences for 507 tests run in the three facilities. The table shows results for two ASTM ratings
5/6
(sound transmission class, STC, and outdoor-indoor transmission class [7], OITC) and for four ISO 717 ratings. Perusal of the table shows that the Rw rating is least sensitive to the effect of
changing test direction in these facilities but it is not immune to it. All other ratings are affected to about the same degree. Simply by reversing the test direction, a laboratory operator can generate two ratings for a specimen differing by a few points, enough to make the difference between meeting or not meeting building code requirements in North America. The table and the figures show that the discrepancies become more important when data below 100 Hz are included.
STC differs from Rw in two main respects: the reference contour extends from 125 to 4000 Hz and
no measured value may lie more than 8 dB below the reference contour – the “8 dB rule”.For many lightweight stud walls and joist floors, the STC rating is determined by application of the 8 dB rule to the transmission loss values below 250 Hz; quite often the STC is determined by the transmission loss in one band. Because of the 8 dB rule, the STC rating is very sensitive to changes in transmission loss caused by changing test direction.
The 8 dB rule is sometimes applied at high frequencies when a wall or floor has a marked coincidence dip and so determines the STC rating. In one recent measurement, the STC changed by 3 points when the test direction was changed because of changes in the transmission loss values and the application of the 8 dB rule at 2500 Hz.
Table 1: Distribution of forward-reverse differences for two ASTM ratings and four ISO 717 ratings. Rw + C100-3150 is the difference in A-weighted levels for the frequency range 100 to 3150 Hz for a pink noise spectrum attenuated by the transmission loss contour. Rw + C50-3150 is the same but for the frequency range 50 to 3150 Hz. Rw + Ctr(50-3150) is the difference in A-weighted levels for a traffic noise spectrum attenuated
by the transmission loss contour.
Forward/reverse Difference STC Rw Rw + C100-3150 Rw + C50-3150 OITC Rw + Ctr(50-3150) -4 1 0 0 0 0 2 -3 12 0 0 3 0 3 -2 38 1 18 4 6 7 -1 186 48 135 87 103 89 0 222 433 288 271 202 214 1 46 22 61 92 141 114 2 2 1 4 26 45 33 3 0 1 0 19 9 26 4 0 0 0 4 0 17 % different 56% 14% 43% 46% 57% 60%
6 POSSIBLE REASONS FOR THE DIFFERENCES
Differences at low frequencies can be explained in a general way as modal effects. The rooms do not provide good approximations to a diffuse sound field at low frequencies. At the high end of the frequency range, there is no such convenient explanation. Several variables were examined to see if there were any correlations between them and the differences. Variables examined were room temperature and humidity, transmission loss, and differences in temperature, humidity and air absorption . None of these variables showed any significant correlation with the TL differences. There were some cases where TL differences at high frequencies could be attributed to flanking
transmission; the TL values were very close to the facility limit. These cases were excluded from the analysis.
7 SUMMARY
Changing the direction of a transmission loss test can change the STC, Rw or other ratings
generated. A laboratory operator who chooses to run a standard test in both directions has no way to decide which of the two sets of results obtained is correct. It would be preferable for standard test methods [1, 2] to require measurements in both directions as a means of improving reproducibility for these test methods. The number of microphone positions required for a test in one direction could be reduced somewhat to avoid doubling the time for testing if this is thought necessary. With automated systems, however, the measurement time is negligible compared to time spent for construction, administration and report preparation.
It could be argued that since Rw is largely unaffected by direction of measurement in these facilities,
that measurements in two directions is not necessary. When the ISO spectrum adaptation terms are being used however, especially down to lower frequencies, then averaging two tests should reduce uncertainty.
REFERENCES
[1] ASTM E90. Standard Test Method for Laboratory Measurement of Airborne Sound Transmission Loss of Building Partitions.
[2] ISO 140-3. Acoustics, Measurement of sound insulation in buildings and of building elements – laboratory measurements of airborne sound insulation of building elements.
[3] R.E. Halliwell, J.D. Quirt, and A.C.C. Warnock. Design And Commissioning of a New Floor Sound Transmission Facility. Proceedings of INCE93.
[4] ASTM E413. Classification for Rating Sound Insulation.
[5] ISO 717-1. Acoustics, Rating of sound insulation in buildings and of building elements. Airborne sound insulation in buildings and of interior building elements.
[6] R.E. Halliwell. Renovations of the IRC/NRC Acoustical Transmission Loss Facility for Walls, and their Effects, Internal Report 826, Institute for Research in Construction, National Research Council Canada, 2001