Publisher’s version / Version de l'éditeur:
Canadian Acoustics, 32, September 3, pp. 174-175, 2004-09-01
READ THESE TERMS AND CONDITIONS CAREFULLY BEFORE USING THIS WEBSITE.
https://nrc-publications.canada.ca/eng/copyright
Vous avez des questions? Nous pouvons vous aider. Pour communiquer directement avec un auteur, consultez la première page de la revue dans laquelle son article a été publié afin de trouver ses coordonnées. Si vous n’arrivez pas à les repérer, communiquez avec nous à [email protected].
Questions? Contact the NRC Publications Archive team at
[email protected]. If you wish to email the authors directly, please see the first page of the publication for their contact information.
NRC Publications Archive
Archives des publications du CNRC
This publication could be one of several versions: author’s original, accepted manuscript or the publisher’s version. / La version de cette publication peut être l’une des suivantes : la version prépublication de l’auteur, la version acceptée du manuscrit ou la version de l’éditeur.
Access and use of this website and the material on it are subject to the Terms and Conditions set forth at
Using a spherical microphone array for identification of airborne sound
transmission paths
Gover, B. N.
https://publications-cnrc.canada.ca/fra/droits
L’accès à ce site Web et l’utilisation de son contenu sont assujettis aux conditions présentées dans le site LISEZ CES CONDITIONS ATTENTIVEMENT AVANT D’UTILISER CE SITE WEB.
NRC Publications Record / Notice d'Archives des publications de CNRC:
https://nrc-publications.canada.ca/eng/view/object/?id=dba8a10e-4b66-4406-8e6b-664c4d813664 https://publications-cnrc.canada.ca/fra/voir/objet/?id=dba8a10e-4b66-4406-8e6b-664c4d813664
Using a spherical microphone array for identification
of airborne sound transmission paths
Gover, B.N.
NRCC-47307
A version of this document is published in / Une version de ce document se trouve dans : Canadian Acoustics/Acoustique canadienne, v. 32, no. 3, Sept. 2004, pp. 174-175
U
SING AS
PHERICALM
ICROPHONEA
RRAY FORI
DENTIFICATION OFA
IRBORNES
OUNDT
RANSMISSIONP
ATHSBradford N. Gover
Institute for Research in Construction, National Research Council, Ottawa, Ontario K1A 0R6 [email protected]
1. INTRODUCTION
Assessment of the sound insulation properties of building partitions (e.g., walls, floors) is usually conducted according to standard procedures. ASTM E90 and E336 and ISO 140-3 and 140-4 provide means of rating the sound insulation performance of partitions in the laboratory or in the field. The results of these tests do not necessarily indicate whether an otherwise highly-insulating partition contains weak spots or leaks, other than a lowered overall rating. This paper presents the results of some initial efforts using a highly directional microphone array measurement system for identification of such weak spots.
Major weak spots such as holes may be obvious, but even subtle ones may be of importance. Recent work has shown that, particularly near the threshold of intelligibility, a slight increase in speech signal level can lead to a large increase in intelligibility [1]. This may have important implications on rating the “speech security” level of a meeting room, for instance. In these cases, finding even minor weak spots in the room boundaries may be of interest.
2.
MICROPHONE ARRAY SYSTEM
A spherical array measurement system has been previously developed for assessment of directional variation of sound within rooms [2,3]. By measuring the impulse response at each array microphone, then beamforming, a directional impulse response due to sound arriving from within the array aperture is obtained. This is simultaneously computed for steering directions distributed over all 3D angles. Analysis of this set of directional impulse responses allows determination of the temporal and angular variations of arriving sound at the array position.
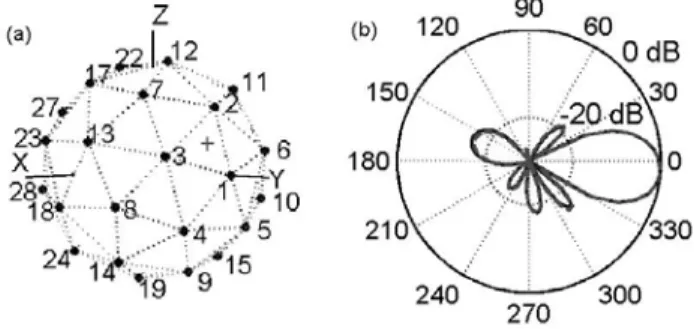
Two free-field arrays of 32 omnidirectional electret microphones, differing only in diameter, were constructed. The layout of the array microphones is shown in Fig. 1(a). Filter-and-sum beamforming is used with each array to generate a narrow beam over a different frequency range. The beampattern of the 48 cm-diameter array in the 800 Hz 1/3-octave band, and that of the 16 cm-diameter array in the 2500 Hz 1/3-octave band are shown in Fig 1(b). The 3-dB beamwidth of each pattern is only 28 degrees; the directivity index is over 14 dB.
Figure 1 (a) Layout of microphones in 32-element spherical array, (b) beampattern in 1/3-octave bands: 800 Hz (48 cm array) and 2500 Hz (16 cm array). The are two curves, nearly coincident.
3.
MEASUREMENTS
A 2.44-by-3.66 m test wall was constructed between two reverberation chambers at NRC. The wall had a single row of 90 mm wood studs (610 mm on centre), with a single layer of 16 mm drywall directly attached to the studs on one side, and a single layer of 16 mm drywall mounted on 13 mm resilient channels (610 mm on centre) on the other side. The cavity was completely filled with glass fibre batts. A standard ASTM E90 test was performed and the wall was found to have an STC rating of 52. Array measurements were subsequently made with the array 0.8 m from the centre of the wall in one chamber, and an omnidirectional loudspeaker 2.3 m from the wall in the other chamber. The room containing the array had a 1/3-octave band reverberation time of 4.3 s in the 800 Hz band, and 3.0 s in the 2500 Hz band. To more accurately represent typical office and residential rooms, all measurements were also made with absorptive material in the chamber containing the array. With the absorption present, the 1/3-octave band reverberation time was lowered at 800 Hz to 0.65 s, and at 2500 Hz to 0.60 s.
3.1 Partial Slit in Test Wall
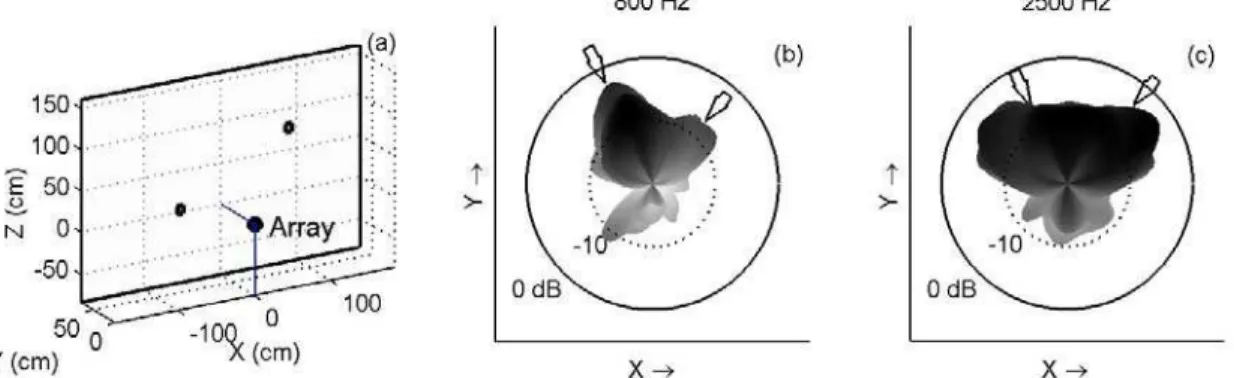
A seam between two sheets of drywall on the side facing the array (the layer mounted on resilient channels) was intentionally widened to 5 mm. Such a “slit” could arise from improper cutting or installation of drywall, for instance. After this modification, the STC of the wall was measured to be 50. A directional measurement made with the absorption in the room with the array is presented in
Fig. 2. Panel (a) shows the geometry of the setup, indicating the wall and the slit with heavy lines. Panels (b) and (c) show a plot of the sound energy arriving during the first 35 ms of the response, viewed from above. The arrow indicates the expected direction of sound incidence from the slit. The shape of the surface indicates that the sound transmission through the slit is detected in both the 800 Hz and 2500 Hz 1/3-octave bands.
3.2 Partial Holes in Test Wall
After the slit was caulked and taped, two 8-by-10 cm holes were cut in the drywall, one on either side of the wall. The holes did not line up, and were cut through one layer of drywall only, the glass fibre batts were left intact. The STC of the wall in this state was still 52. A directional measurement made without the absorption in the room with the array is presented in Fig. 3. Panel (a) again shows the geometry, indicating the holes in the wall. Panels (b) and (c) show a plot of the sound energy arriving during the first 35 ms of the response, viewed from above. The arrows indicate the expected directions of sound incidence from the holes. The shape of the surface indicates that the sound transmission through the holes is detected in the 800 Hz 1/3-octave band, but not in the 2500 Hz 1/3-octave band. This is presumably due to the fact that less sound power is transmitted at 2500 Hz. The difference in level arriving
from the two holes is likely due to the difference in distance of each from the array.
4. CONCLUSIONS
A spherical array measurement system has been employed to locate weak spots in a wall. In conditions where the “defects” in the wall were minor enough to cause no, or only a slight, reduction in STC, they were localized accurately. The technique was effective even under conditions of high reverberation, and showed that the “detectability” of the defects varied with frequency. These initial investigations indicate that the present approach seems capable of identifying weak spots in a reliable and effective manner.
REFERENCES
[1] B.N. Gover and J.S. Bradley, “Measures for assessing architectural speech security (privacy) of closed offices and meeting rooms,” J. Acoust. Soc. Am. (accepted August 2004). [2] B.N. Gover, J.G. Ryan, and M.R. Stinson, “Microphone array measurement system for analysis of directional and spatial variations of sound fields,” J. Acoust. Soc. Am., 112, 1980– 1991 (2002).
[3] B.N. Gover, J.G. Ryan, and M.R. Stinson, “Measurements of directional properties of reverberant sound fields in rooms using a spherical microphone array,” J. Acoust. Soc. Am. (in press).
Figure 2 Measurement with slit in one side of test wall: (a) geometry of setup. Energy arriving at array during first 35 ms of impulse response is shown in (b) 800 Hz and (c) 2500 Hz 1/3-octave band.
Figure 3 Measurement with two partial holes in test wall: (a) geometry of setup. Energy arriving at array during first 35 ms of impulse response is shown in (b) 800 Hz and (c) 2500 Hz 1/3-octave band