FOR NURSING HOME BEDS by
Matthew E. Farber
SUBMITTED IN PARTIAL FULFILLMENT OF THE REQUIREMENTS FOR THE DEGREES OF
BACHELOR OF SCIENCE and
MASTER OF CITY PLANNING at the
MASSACHUSETTS INSTITUTE OF TECHNOLOGY
June, 1975
Signature of Author
Department of Urban Studies and Planning, May 27, 1975 Certified by
Thesis Supervisor Accepted by
Chairman,~Departnienal Com'n t ee "hhhuate StidinEs
Rotch
Ss.INST.
JUN 30
1975
DETERMINING THE NEED FOR NURSING HOME BEDS
by
Matthew E. Farber
Submitted to the Department of Urban Studies and Planning on
May 27, 1975 in partial fulfillment of the requirements for
the degrees of Bachelor of Science and Master of City
Plan-ning.
ABSTRACT
The increasing costs of health care and the expansion
of the nursing home industry have contributed to the growing
attention given to nursing homes.
This thesis surveys the
present methods used in determining the need for nursing
home beds and suggests improvements in this planning
method-ology.
The presently used determining need methodologies are
reviewed and critiqued. Considerations often overlooked in
determining need are discussed. Specifically, the concept
that the supply of beds will create demand is analyzed and
is found to be unconfirmed by United States and Massachusetts
data.
THESIS SUPERVISOR:
Thomas R. Willemain
Acknowledgements
The enlightening advice, steadfast patience, and con-tinual encouragement of Professor Thomas R. Willemain were priceless, and I shall be forever grateful.
The time, energy, and critical comments offered by Professor Robert Hollister, Lecturer Michael Joroff, and Mr. Greg W. Rothman were greatly appreciated.
The understanding and encouragement of Sharon helped make this work a reality.
Table of Contents Abstract .. ... 2 Acknowledgements ... 3 List of Figures ... 7 List of Tables .. ... 11 Dedication ... .. 12
Chapter 1: Nursing Homes - Part of the Health Care System 1.0 Overview ... 13
1.1 Rising Costs and the Expansion of Nursing Homes... 13
1.2 Certification of Need (C/N) ... Se 14 1.3 Survey of the Development of Health Planning ... 15
1.4 Problems with C/N and Regulation ... .17
1.5 Other Problems with C/N ... 18
1.6 Necessity for "Determining Need" ... 19
1.7 Thesis Content ... 19
References ... ... . . ... 21
Chapter 2: Current Methodologies for Determining Need 2.0 Introduction ... 23
2.1 Demand versus Need ... 23
2.2 Hill-Burton Methodology...24
2.3 Massachusetts's C/N for Nursing Homes ... .26
2.4 North Dakota's Modified Hill-Burton Formula ... 27
2.6
Summary ..
...
29
References ...
30
Chapter 3:
Considerations in Determining Bed Need
3.0 Overview...
323.1
The Development of Different Levels of
Nursing Care in Massachusetts ... 33
3.2
The Massachusetts Rate Setting Commission ...
37
3.3
Nursing Home Misutilization as Found in the
Literature ...
40
3.4
Periodic Medical Review ...
.44
3.5
Hospital Waiting Time Study ... 45
3.6
A Simple Mathematical Model of Nursing
Home Placement ...
46
3.7
The Effective Number of Beds ... 55
3.8
The Development of Home Health Services ...
56
3.9
Problems Faced by Home Health Services ...
57
3.10 The Use of Home Care and Extended Care
Facilities ...
59
3.11 Summary .. ...
60
References . ...
62
Chapter 4: The Roemer-Feldstein Hypothesis and Nursing
Homes
4.0
Introduction ... .64
4.1
Roemer's Work ... 64
4.2
Feldstein's Work ... 65
4.3
Nursing Homes and the Roemer-Feldstein
66
Hypothesis ...
References .. ... 101
Chapter 5:
Appendix
-Policy Recommendations ... 102 Computing the Final Per Diem Rate ... . 106
List of Figures
Figure No. Page Title
3-1 49 Hospital Census Medically Ready for Discharge versus Number of Nursing Home Beds Per Capita
3-2 50 Average Delay Awaiting Nursing Home Placement versus Number of Nursing Home Beds Per Capita
3-3 51 Average Daily Cost/Patient versus
Number of Nursing Home Beds Per Capita
3-4 53 Days spent Awaiting Nursing Home Placement versus Nursing Home Length of Stay
3-5 54 Average Daily Cost/Patient versus
Nursing Home Length of Stay
4-1 67 Number of Nursing Home Residents versus Number of Nursing Home Beds Per Capita
(Annotated)
4-2 68 Number of Nursing Home Residents versus Number of Nursing Home Beds Per Capita in the United States
Figure No. Page Title
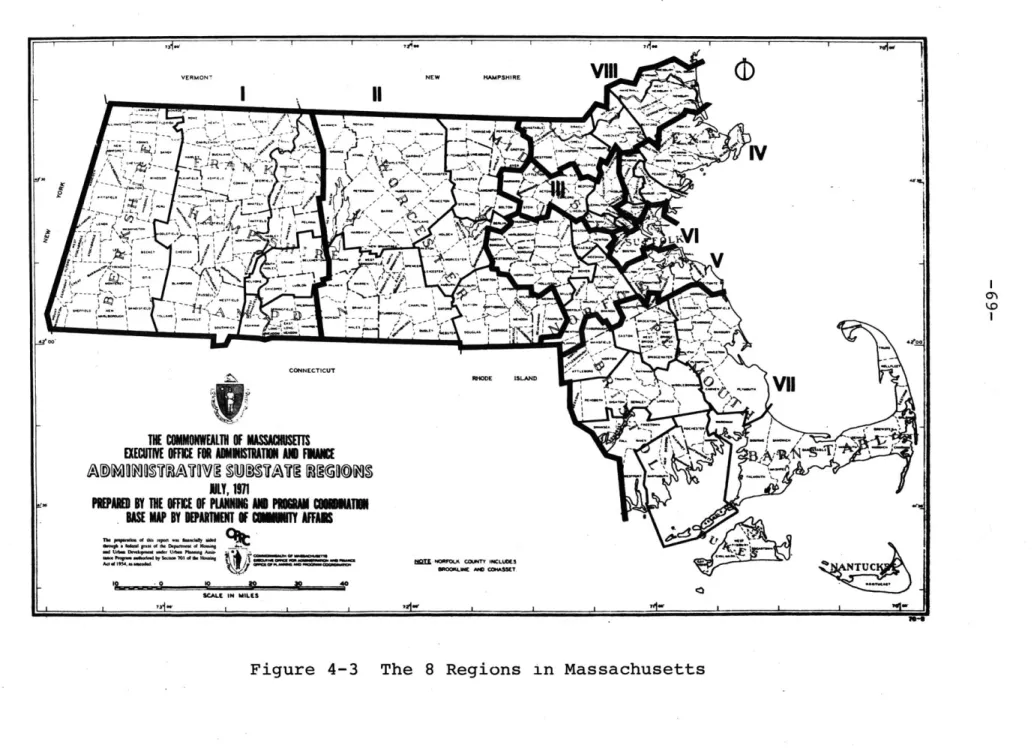
4-3 69 The Eight Regions in Massachusetts
4-4 71 Patient Days versus Number of Nursing Home Beds Per Capita ~
4-5 72 Patient Days versus Number of Skilled Nursing Home Beds Per Capita
4-6 73 Patient Days versus Number of Inter-mediate Care Beds Per Capita
4-7 74 Patient Days versus Number of Rest Home Beds Per Capita
4-8 76 Hospital Bed/Population Ratio versus Hospital Utilization
4-9 77 Percentage of Inappropriately Placed Patients versus Number of Nursing Home Beds Per Capita
4-10 79 Percentage of Patients Admitted from Hospitals versus Number of Nursing Home Beds Per Capita
4-11 80 Percentage of Patients Admitted from Hospitals versus Number of Skilled Nursing Home Beds Per Capita
4-12 81 Percentage of Patients Admitted from Hospitals versus Number of Intermediate
Care Beds Per Capita
4-13 82 Percentage of Patients Admitted from Hospitals versus Number of Rest Home Beds Per Capita
Figure No. Page Title
4-14 84 Percentage of Patients Admitted from Home versus Number of Skilled Nursing Beds Per Capita
4-15 85 Percentage of Patients Admitted from Home versus Number of Nursing Home Beds Per Capita
4-16 86 Percentage of Patients Admitted from Home versus Number of Intermediate Care Beds Per Capita
4-17 87 Percentage of Patients Admitted from Home versus Number of Rest Home Beds Per Capita
4-18 89 Percentage of Patients Discharged Due to Death or to Hospital versus Number of Nursing Home Beds Per Capita
4-19 90 Percentage of Patients Discharged Due to Death or to Hospital versus Number of Skilled Nursing Home Beds Per Capita
4-20 91 Percentage of Patients Dsicharged Due to Death or to Hospital versus Number of Intermediate Care Beds Per Capita
4-21 92 Percentage of Patients Discharged Due to Death or to Hospital versus Number of Rest Home Beds Per Capita
4-22 93 Percentage of Patients Discharged Due to Death versus Number of Nursing Home Beds in U.S. Per Capita
Figure No. Page Title
4-23 95 Number of "Problem Patients" versus Number of Nursing Home Beds Per Capita in U.S.
4-24 96 Percentage of Patients with Selected Disabilities versus Number of
Nursing Home Beds Per Capita
4-25 97 Percentage of Patients with Selected Disabilities versus Number of Skilled Nursing Home Beds Per Capita
4-26 98 Percentage of Patients with Selected Disabilities versus Number of Inter-mediate Care Beds Per Capita
4-27 99 Percentage of Patients with Selected Disabilities versus Number of Rest Home Beds Per Capita
List of Tables Table No. Page Title
2.1 25 Hill-Burton Bed/Population Ratios 3.1 38 Maximum Allowable Variable Costs
Dedication
To my Grandmother.
Chapter 1: Nursing Homes - Part of the Health Care System
1.0 Overview
The rapid expansion of the nursing home industry, coupled with the rising costs of health care, has brought attention to nursing homes. Methods of determining the need
for nursing home beds grow in importance as more and more states adopt regulatory measures to control the growth of health care facilities.
This thesis will review the methods of determining need for nursing homes currently in use. Each approach to estimating bed requirements has certain underlying assump-tions and differing viewpoints of what must be considered to successfully determine how many beds are required. Some considerations that the current methods overlook, such as
the level of inappropriate use of nursing homes, and the
relationship between nursing homes, hospitals, and home health services, are presented. The assumption that planning should be based on projected need, since it is widely held that sup-ply creates demand, is analyzed in detail. The thesis con-cludes with a series of policy recommendations.
1.1 Rising Costs and the Expansion of Nursing Homes
During the fiscal year 1972, the United States spent $83.4 billion, 7.6% of the GNP, on health care. The number of skilled nursing home beds increased from 150,000 to 650,000
nationwide between 1950 and 1970;2 intermediate care and
related nursing facilities provided an additional 400,000
beds in 1970.3 In Massachusetts, in 1973, there were 49,471
nursing home beds compared with 29,201 acute general hospital
beds.
4U.S. expenditures on the hursing home industry have
in-creased from $142 million to $2.84 billion between 1950 and
1969,
an increase of 1902%.
Nursing homes comprised over
42% of all Massachusetts Department of Public Welfare
expen-ditures in medical assistance programs6 in 1973.
Nationwide,
Medicaid financed 50% of all nursing home residents in 1973,
while Medicare financed only 4% of nursing home care.7 This
difference is reflected in Medicaid's 1973 expenditures on
nursing home care which totaled $1.9 billion, compared to
about one tenth as much ($206 million) from Medicaid.
81.2
Certification of Need (C/N)
The ever rising costs for health care necessitated
intervention. Certificate of Need (C/N) legislation has been
one response by states to regulate the growth of the health
care sector. C/N, first adopted in New York in 1965, was an
attempt to put "teeth" into planning:
a C/N is required from
the state for the addition to or new construction of a health
facility or change in service. This is a regulatory measure
added to the planning process. Presently, 24 states have
9
state, 1 the goal behind C/N is to control the costs of care by regulating the capacity and the distribution of facilities. Thus, cost containment has been one main reason for C/N.
1.3 Survey of the Development of Health Planning
The Hill-Burton Hospital Construction Act, adopted in 1946, appropriated federal funds for construction and renova-tion of hospitals. This formula was flawed,1 as we shall examine in Chapter 2; however, the concept of determining need was instituted.
In an effort to provide patients at the regional level with the latest advances in diagnosing and treating heart
disease, cancer, stroke, and related diseases, the federal government established the Regional Medical Programs (RMP) in 1965. RMP had some difficulties. First of all, it was devel-oped through a categorical approach to each disease. Second, it was never clear if its goal was to upgrade the existing health care delivery system or to change it. Finally, RMP could do no nwre than encourage voluntary efforts for cooperative arrangements between institutions.
The Partnership for Health Act of 1966 was an attempt to integrate comprehensive planning with the programs for health care. State Comprehensive Health Planning (CHP) agen-cies, known as "A" agenagen-cies, and local "B" agencies were pro-moted. The governing boards of these CHP agencies had to
consist of a majority of consumers. However, CHP failed, revealing deficiencies in the Partnership for Health Act.
Reasons for failure included: (1) financing the Local B agencies; (2) the absence of incentives, with persuasion as the only means of influence; (3) coping with the mandate to improve the health system without interfering with current practice; (4) and the primitive state of planning method-ologies.1 2 , 13 Such planning efforts and the resulting avoid-ance of action has been termed "paper planning."1 4
A 1972 amendment to the Social Secuirty Act, Section 1122, instituted the C/N concept at the federal level allowing the Department of Health,Education, and Welfare to deny inter-est and depreciation payments to hospitals by Medicare and Medicaid if the state has not approved the construction of the bed facilities. If a state adopted Section 1122, more
federal funds became available to the A and B agencies.
Since 1972, thirty seven states have adopted Section 1122.15 These payments cover only about 6% of the average cost of a construction project, and therefore do not necessarily stop unapproved construction.16 However, a study for HEW on the impact of Section 1122 indicates that it has accelerated the development of the process of regulating facility construction in 20 states.1 7
On January 4, 1975, the National Health Planning and Resource Development Act was signed into law, merging CHP,
RMP, and the Hill-Burton Hospital Construction program. One billion dollars has been authorized to establish a national
network of area wide and state health planning agencies. The
state agencies are designated by the Governors and do not have
to be the State's Health Department. The state agencies are
now required to review at least every five years the
"appro-priateness" of health services provided by institutions in the
state. The area wide agencies would determine the
appropriate-ness and send their recommendations to the state agency.
Originally, the bill read "need" rather than "appropriateness"
of institutional health services, but the American Hospital
Association (AHA) argued for the change on the grounds that
the original wording jeopardized the ability to borrow funds
in the private money market if a hospital could be declared
"unneeded". The AHA also had a paragraph deleted, the
para-graph stating that an area side agency was required to "work
for the improvement or elimination" of an institution once it
had been declared inappropriate.18
The National Health
Plan-ning and Resource Development Act requires states to adopt C/N
laws that compel area wide agencies to recommend action and
the state agency to rule on this recommendation.
1.4
Problems with C/N and Regulation
Since all states must now adopt C/N laws, we should
be-aware of some of the problems resulting from regulation in the
health care system. Clark Havighurst has explored some of
these problems.19 C/N bolsters a monopoly and has
institution-alized two cartel practices.
One cartel practice is output
restrictions and the other, market division. Note that since 1968, the AHA has been a proponent of C/N. As an
alternative to C/N, financial incentives through rate setting have been proposed. This system, however, provides for con-trolling only the use of the facility - after capital has already been invested in it - instead of the existence of the
building itself.
1.5 Other Problems with C/N
C/N has other drawbacks besides regulatory problems. C/N is reactionary in that it lacks the power to initiate action where needed, and can respond only to proposals brought before it. C/N is dealing with an open system of resource
allocation: controlling the upper limit of beds in one area by denying a C/N does not necessarily result in reallocation of financial resources to a needed area or type of service. The merger of regulation and planning roles has taken its toll. It is ironic that planners seek regulatory roles even though regulation appears to weaken planning efforts. This weakening is due to a steady number of C/N applications that demand prompt review, comment, and action, and therefore re-ceive higher priority than developing a master plan. Limited resources are generally allocated to regulatory functions. Another problem is that a local plan may run counter to the
intentions of the B agency's supporters. The C/N program also assumes that there is an accepted methodology for determining
need and for developing plans. Methodologies often lead to controversy and criticism based on their inherent assump-tions. Because the planning criteria used in the regula-tory process are never fully developed, the combination of planning and regulation seems to undermine the planning ef-fort, and erode the credibility and power of the entire process.
1.6 Necessity for "Determining Need"
Criteria that define need must be developed in order that regulation consistently be rational and coherent. Since C/N is based on the ability to determine shortages
or excesses of health care facilities and services, increased attention is being focused on methodologies used in deter-mining need -- the foundation of the C/N process.
1.7 Thesis Content
The methodologies presently used in determining need will be reviewed in Chapter 2 with emphasis on determining
the need for nursing homes. Chapter 3 explores some consid-erations- that are generally neglected by current approaches to estimating nursing home bed requirements. The concept of progressive patient care is introduced and the history of the different levels of nursing care in Massachusetts is present-ed. The role of the Massachusetts Rate Setting Commission is then reviewed in regard to nursing home rates and
the literature as well as the results of Massachusetts's
Periodic Medical Review will then be explored in the context of the relationship between hospital discharges and nursing home admissions. A recent study of the days spent waiting in a hospital for a nursing home bed will be reviewed, and a mathematical model is introduced to help illustrate the relationship between nursing homes and hospitals. A dis-cussion follows of the difference between the number of beds physically present and the number of beds actually available for a given patient. The consideration of home health care as an alternative to nursing home care will then be discussed. Chapter 3 will conclude with a review of a study on theim-pact of home care and an extended care facility.
Chapter 4 will examine the Roemer-Feldstein hypothesis, that the supply of beds creates demand. The question at hand is whether this concept applies. to nursing home beds. The thesis results will be summarized and policy recommendations offered in Chapter 5.
References
1. B. Cooper and N. Worthington, National Health Expendi-tures 1929-72, SSA, DHEW No. 73-11700, p. 1.
2. S. Levey et al., "Nursing Homes in Massachusetts", AJPH, Vol. 65 Nol 1, January 1975, p. 67.
3. Ibid.
4. Commonwealth of Massachusetts, Department of Public Health, Health Data Annual 1974, Vol. 1 No. 1, pp. 52
-69.
5. Levey et al., p. 67.
6. Health Data Annual 1974, p. 39.
7. Monthly Vital Statistics Reprot, 1973 Nursing Home Sur-vey - Provisional Data, DHEW (HRA) No. 75 - 1120, p. 3. 8. Ibid.
9. Lewin & Associates, Inc., Executive Summary Analysis of State and Regional Health Regulations, September 5, 1974, p. 32.
10. W.J. Curran, "A National Survey and Analysis of State C/N Laws for Health Facilities" in Regulating Health Facilities Construction, Havighurst, ed., pp. 85 - 111. 11. W. Shonick, "Understanding the Nature of the Random
Fluctuations of the Hospital Daily Census: An Impor-tant Planning Tool", Medical Care, Vol. X No. 2,
March-April 1972, p. 119.
12. D. Ardell, "Paper Planning or Serious Change Management: Seven Fundamental Choices Affecting CHP", Presented at 1972 ASPO Conference, pp. 4 - 5.
13. C. Roseman, "Problems and Prospects for CHP", AJPH, Vol. 62 No. 1, January 1972, pp. 16 - 19.
14. A. Schoor, "Planned Development: Vision or Fancy?", Explorations in Social Policy, Basic Books, Inc., New York, 1968, p. 207.
15.
Lewin & Associates, Inc., p. 32.
16.
J. Inglehart, "Regulatory Report 3/Goverment to
Impose Greater Health Industry Controls", National
Journal Reports, March 15, 1975, p. 385.
17.
Ibid.
18.
Ibid.
19.
C. Havighurst, "Regulation of Health Facilities and
Services by C/N", Virginia Law Review, Vol. 59 No. 7,
October 1973, pp. 1143 - 1231.Chapter 2:
Current Methodologies for
Determining Need
2.0
Introduction
As the adoption of C/N continues, the development of
approaches to determining need increases in importance. A
report to the U.S. Bureau of Health Services Research cites
the development of the definition and measurement of need as
essential.
12.1
Demand vs. Need
The question that arises is whether regulations and
standards should be based on demand or need. The demand,
which is the amount of care actually consumed, is influenced
by the patient's sex, age, educational background, income,"
race, ethnicity, and other such demographic characteristics.
2Demand is also a function of the physician's patter of
prac-tice,
payment arrangements, and availability of services.
3An alternative to planning for demand is to plan for
need, the amount of care professionals believe to be
neces-sary.
Demand may be less than need when individuals disagree
with expert opinion. Religious convictions may lower the
in-cidence of blood transfusions or abortions.
In the case of
nursing home care, the findings of one study show that
com-pared with non-married people, a higher percentage of married
people who "needed" nursing home care were not in nursing
homes.4
In other words the demand was less than the need.
Demand may also exceed need, as with well baby visits or annual check ups for healthy teenagers. The same nursing home study cited above also found that non-married people made up a higher proportion of inappropriately placed nursing
home patients than did married folks5 (The results of this study will be explored further in Chapter 3). That is, some patients needed less care than that demanded by an appro-priately placed nursing home patient.
Need can identify services demand overlooks. However, there may always be a gap between needed services and demanded services, even with insurance setting prices to zero.6 The low level of attention to need and its determination is re-flected by the present methodologies. "In spite of the eco-nomist's uneasiness about it, a considerable demand exists for the concept of need."7
2.2 Hill-Burton Methodology
Putting the theoretical discussions aside, let us now turn to some presently used methods of determining need for
facilities. Since Hill-Burton was the first government inter-vention that established standards for hospital bed require-ments, it is a widely used approach for both hospital and -nursing home bed determination. Originally Hill-Burton, in
1946, used a formula based on bed/population ratios as a func-tion of state density as found in Table 2.1.8
Table 2.1
Hill-Burton Bed/Population Ratios
Population Density of State Number of Beds/1000 Population (persons/square mile)
More than 12 2.5 - 4.5
6 - 12 3 - 5
Less than 6 3.5 - 5.5
Hill-Burton was amended in 1962, at which time the following formula for determining bed need was adopted:
TPD 1 EP
Beds Needed in 5 Years = - X - X
365 0.85 Pop.
TPD = Total Patient Days in region in current year Pop. = Population in region in current year
EP = Estimated Population in region in 5 years 0.85 = Proposed occupancy rate
The advantages of this new formula over the bed/population rations include the use of an efficiency standard and relating historic demand to future estimates. However, there are some drawbacks with this approach. One disadvantage is that patient days are used regardless of patient origin, thereby establish-ing a positive feedback loop for existestablish-ing institutions that are used due to the lack of other facilities. This formula
is static in that it does not reveal trends. With increasing
use the formula underestimates demand, with decreasing use
the demand is overstated. There is no differentiation
be-tween services such as pediatrics, obstetrics, medicine, or
surgery all of which have different occupancy rates.
It is
assumed that there will be no change in the pattern of use
or the methods of health care delivery. Such changes might
include the increasing use of HMOs or the instituting of
National Health Insurance. The current level of use is
assumed to be optimal. Geographic distributions of the
various institutions within the state as well as the
result-ing travel times are neglected.
In addition, there is no
consideration of any religious or ethnic affiliation with,
the institution or the quality of care offered. Finally, the
variability of admissions is not taken
into account.
9
' 10
Often overlooked is the size of the population being served.
As the population increases, variability decreases.
Through
centralization, fewer beds are required to match specified
probabilities of meeting demands, while the occupancy rates
will increase.
9' 10
Hence a tradeoff results between
in-creased efficiency or accessibility.
2.3
Massachusetts's C/N for Nursing Homes
Massachusetts takes a slightly different approach to
planning for nursing homes as shown by the standards
decided in March, 1974, that the number of beds in the state should be frozen. Unless the region from which a C/N pro-posal originates is below the state mandated average, the proposal is generally turned down. By limiting the construc-tion of more beds, one hopefully can control further utiliza-tion and costs. The idea behind this is that no more nursing home beds are necessary, and that it is the further develop-ment of alternative services such as home health services that
is lacking. Turning down nursing home C/N proposals might lead to the provision of alternative services. This strategy is in part based on the Roemer-Felstein hypothesis which
states that the supply of hospital beds creates demand. How-ever, it is not clear that this hypothesis applies to nursing
homes. (This will be explored further in Chapter 4.) By limiting the number of beds the utilization of facilities may be limited: however, the appropriate as well as the inappro-priate use of facilities may be limited. Therefore, there seems to be a need for controlling the appropriate usage through utilization review. This contention is discussed further in Chapter 3.
2.4 North Dakota's Modified Hill-Burton Formula
North Dakota has adopted the Hill-Burton formula with some modifications for nursing homes. It has been estimated that 90% of the aged population can live at home with suitable assistance.11 Therefore the total aged population potentially
institutionalized is calculated by taking 10% of the popu-lation 65 years of age and over. Nationally, there are 52 nursing home residents/1000 aged population.12 Taking this into account, the potentially institutionalized population is then multiplied by .53 to determine the population needing nursing care. A usage rate is then applied in arriving at the expected average daily census. The average daily census
is divided by an occupancy rate to calculate the long term bed need. In attempting to plan specifically for nursing homes, the North Dakota formula has inherited the same
prob-lems that plagued its progenitor, the Hill-Burton formula. 2.5 Decision Analysis
Recently the analytic tool for decision making under uncertainty, "decision analysis", has been applied to deter-mining the number of hospital beds needed,1 3' 14 but not yet applied to determining nursing home bed need. Decision ana-lysis makes use of utility theory in attempting to incor-porate into a single decision making criterion the benefits
and costs, or the utility, resulting from meeting, under-estimating, or overestimating the bed need.
In reviewing the few cases using decision analysis to date, it appears more development is necessary in measuring
.
13
the utility of the various outcomes. In the Grimes paper no utility is actually computed. The Kuskey work14 is
as a function of the future bed demand, approximated by a probability density function, and then optimizing the utility
function, measured by the relative importance of bed spr-pluses compared to deficits. As a tool useful in assessing
the effects of determining a specific bed level or need, decision analysis is a welcome addition to the methodologies used in determining need. However, more work on developing suitable utility functions is needed before the full value of decision analysis will be reached.
2.6 Summary
Current methods for determining the need for nursing home beds are far less sophisticated than those used for hos-pital beds; Massachusetts's standards being represented bye bed/population ratios. The use of decision Analysis has yet
to be applied to nursing home bed need and a suitable utility function expressing the effects of underestimating as well as overestimating the bed level has yet to be developed. All of the methods for determining need overlook the relationships between other types of facilities.
References
1. Macro Sustems, Inc., "The Certificate of Need Experi-ence: An Early Assessment", Volume 1: Summary Report, p. 26.
2. Bergwall et al., Introduction to Health Planning, Information Resources Press, 1973, p. 161.
3. J. Wennberg and A. Gittelsohn, "Small Variations in Health care Delivery"., Science, Volume 182, December 1973, pp. 1102 - 1108.
4. J. Davis and M. Gibbin, "An Areawide Examination of Nursing Home Use, Misuse, and Nonuse", AJPH, Vol. 61 No. 6, June 1971, pp. 1146 - 1155.
5. Ibid.
6. J. R. Jeffers et al., "On the Demand Versus Need for Medical Services and the Concept of Shortage", AJPH, Vol. 61 No. 1, January 1971, pp. 46 - 63.
7. K. E. Boulding, "The Concept of Need for Health Ser-vices" in Economic Aspects of Medical Care, edited by J. B. McKinlay, Prodist, N.Y. 1973, p. 3.
8. G. A. Popov, Principles of Health Planning in the U.S.S.R., WHO, Generva, 1971, p. 143.
9. W. Shonick, "Understanding the Nature of the Random Fluctuations of the Hospital Daily Census: An Impor-tant Planning Tool", Medical Care, Vol. X No. 2,
March-April 1972, pp. 118 - 136.
10. P. J. Phillip, "Some Considerations Involved in Deter-mining Optimum Size of Specialized Hospital Facilities",
Inquiry, Vol. 6 No. 4, December 1969, pp. 44 - 48.
11. R. Berg et al., "Assessing the Health Care Needs of the Aged", Health Services Research, Spring 1970, pp. 36-59. 12. National Center for Health Statistics, DHEW, Health
Resources Statistics 1974, p. 382.
13. R. Grimes et al., "Use of Decision Theory in Regional Planning", Health Services Research, Spring 1974, pp. 73 - 78.
14. K. P. Kuskey, "Philosophies, Methods, and Tools for Determining Regional Hospital Construction Policies", Working Memo #6, Engineering-Economic Systems Program
in Health Care Research, Stanford University, Palo Alto, California, July 11, 1974.
Chapter 3: Considerations in Determining Bed Need 3.0 Overview
An implicit goal of the health care system is to meet the needs of the individual patients. In Massachusetts, nursing homes offer three levels of care in an attempt to match a continuum of needs. This chapter begins by tracing the development of the different levels of nursing care in Massachusetts. The process the Massachusetts Rate Setting Commission uses in setting the nursing home rates and the role
it plays in establishing current utilization patterns and occupancy rates is then explored.
In determining the need for nursing home beds one assumption often made is that appropriate use will be made* of the beds. Methodologies reflecting past utilization rates reflect only the use of the beds and not the appropriateness of the usage. Nevertheless, the appropriate utilization of beds should be an important factor in determining need.
The medical care literature provides us with a few docu-mented studies of the misutilization of nursing homes. In reviewing these studies, one questions just how "appropriate" use is assessed. In the studies reviewed in this chapter, -the criteria for appropriate usage are based on medical or clinical need. It should be recognized that although a pa-tient's clinical need or appropriate level of care may call for a lower level of nursing, the lack of alternatives may
make one's placement systemically appropriate due to the con-straints of the system.
One result of the inappropriate usage of nursing homes is to make it more difficult for appropriate patients to get into nursing homes. The Massachusetts Department of Public Health (M.D.P.H.) has recently documented the days spent in a hospital by patients who were ready and waiting for place-ment in a nursing home. In this chapter, we will review this study and further examine the relationship between nursing homes and hospitals with the aid of a simple mathematical model of patient movement between a hospital and a nursing
home. This chapter follows with a discussion on the differ-ence between the number of beds physically present and the smaller number of beds effectively available to any given patient. The consideration of home health services as an alternative to nursing home care is then examined. Finally, the chapter concludes with a study of the impact one program of home health services and extended care had on hospital utilization.
3.1 The Development of Different Levels of Nursing Care in Massachusetts
Massachusetts's nursing homes currently operate within a system which offers three levels of nursing care. Progres-sive patient care is a means of reducing the costs of health care by providing a system using less costly facilities and
few skilled personnel in appropriate situations. The multi-ple levels of nursing care reflect this concept of
progres-sive patient care. However, a multi-level tier system did not always exist.
Levey et al.1 briefly reviewed the development of the nursing home industry in Massachusetts. In 1963, Massachu-setts's public assistance patients in nursing homes all had their nursing home stay paid at the same rate, which was $6.85 per diem. By paying different rates for more services or hours of nursing it was hoped that the quality of care would
improve. In 1964 a two-tier system was adopted, with institu-tions providing at least two hours of nursing per patient per day receiving a rate increase from $6.35 to $7.16. This dis-tinction was only temporary, as one year later.in 1965 there was a single fixed rate of $7.71. It had been found that with the 31 cent differential in rates, it often did not make sense financially for large institutions to incur the addi-tional expenses of qualifying for the higher rate.
Following the enactment of Medicare, a five level system was instituted in 1966, which was based on evidence of the quality of the care, records, and physical plant. With a
limited number of inspectors, more than 1 out of 7 nursing homes were operating with violations, some of which were
serious. In 1968 a cost-plus reimbursement scheme was adopted, following Medicare's promulgated method. By 1969
the idea of a classification system was abondoned. There were newspaper reports that the nursing homes were reaping
huge profits under the cost-plus reimbursement formula. At the same time the Massachusetts Federation of Nursing Homes claimed that the state owed the industry over $40 million in back payments.
With only one level of care and the same fee covering all patients, regardless of their condition or nursing care requirements, patients requiring extensive care became unde-sirable. Dr. David Kinloch, the Director of the Division of Medical Care for the Massachusetts Department of Public
Health between 1967 and 1971, proposed the idea for the pres-ent three level care system.2 The idea was to base reim-bursements on the patients' need for specific levels of care.
It was hoped that payment based upon need for care would pro-duce an incentive to admit patients in need of extensive
care.
At the public Health Council meeting discussing the proposal, the Massachusetts Federation of Nursing Homes strongly opposed it. They claimed such a system would in-crease the costs since many facilities would have to employ more qualified personnel and speicalized staff such as
therapists, social workers, and the like. The Department of Public Health replied that although some rates might rise, costs overall would decrease. It was estimated that no more
than 37% of the patients would be in the most costly skilled
nursing homes and 40% of the patients would appropriately
belong in the cheaper rest homes.2
In 1973, 27% of nursing
home patients were in skilled nursing homes, however only
15% of the patients were in rest homes.
3It is important to understand just how the three levels
of care differ. Skilled nursing homes, known as Level I for
Medicare reimbursement and Level II for Medicaid
reimburse-ment, provide skilled nursing care and related services and/
or rehabilitative therapy for those patients requiring such
care.
Intermediate nursing care homes, Level III homes,
provide health related care and services to patients who do
not require the degree of care and treatment which a hospital
or skilled nursing facility is designed to provide, but who
do require care and services above the level of room and
board. Resting homes, Level IV homes, provide residential
services to patients who do not routinely require nursing
care.
Skilled nursing homes are required to provide a
mini-mum of two hours of nursing care per patient per day.
How-ever, the Rate Setting Commission (RSC) will not cover the
costs of providing more than the maximum allowable 3.6 hours
of nursing care per patient per day. Level III homes are
re-quired to provide 1.5 hours of nursing care per patient per
day, but the RSC will disallow costs resulting from more than
provide room and board, only 4 hours per month of nursing
care per patient is allowable by RSC. The rates established
by the Rate Setting Commission apply only to Medicaid
pa-tients.
3.2
The Massachusetts Rate Setting Commission (RSC)
The Massachusetts RSC is empowered to set prospective
rates, but it has not yet done so, although this is currently
under discussion. An audit is annually conducted on every
nursing home in the state. On the results of this audit a
final per diem rate is arrived at for that past year.
An
interim rate is
used for the current year based on the prior
year's final rate plus a cost of living increase. For
example, the 1973 final per diem rate is used to calculate
the 1974 interim rate by multiplying by a cost of living
factor. When the 1974 audit is complete a final rate is
established and the differential between the interim and
final rates is then billed for.
To gain further insight into the rate setting process,
let us briefly examine how the final per diem rate is set.
4The Final Per Diem Rate Computation sheets used by the RSC
are exhibited in the Appendix. The final per diem rate is
the sum of the per
diem
cost of operations, administrative
planning allowance, and return on equity capital.
The cost of operations is the sum of total operating
costs minus adjustments or disallowable costs.
Excess nursing
costs and excess variable costs (room and board) are two
examples of adjustments made in the total operating costs.
Not only are minimum and maximum allowable nursing care hours
established, but maximum allowable nursing costs are also
calculated.
Nursing costs can be controlled through staffing
pat-terns and mixes of licensed (R.N.s and L.P.N.s) nurses and
aides.
Skilled nursing homes are allowed up to $12.40/
patient/day, intermediate care homes are allowed $6.75/
patient/day unless there are over 60 beds in which case the
Level III homes are allowed $7.55.
The rationale being that
with over 60 beds a Director of Nursing is required. The
rest homes under 16 beds are allowed $2.54/patient/day and*
$3.04 if there are 16 or more beds.
The variable costs or room and board expenditures also
have ceilings on allowable costs, which are higher for
multi-level facilities than for free standing or single multi-level
faci-lities. Table 3.1 summarizes the maximum allowable variable
costs.
Table 3.1
Maximum Allowable Variable Costs
Multi-Level
Free-Standing
Skilled Nursing Homes
$11.59
$11.34
Intermediate Nursing Homes
$
8.72
$
8.47
The net operating costs or the total operating costs less the adjustments are then divided by the patient days to give the per diem cost of operations. The patient days are calculated by multiplying the licensed bed capacity by 365 and multiplying this by the actual occupancy rate or the man-dated occupancy rate, now set at 90%, whichever occupancy rate is greater.
The administration/policy-planning allowance is a
function of the size of the facility. The larger the nursing home, the higher the allowable administrative salary and
allowance. This again is calculated on a per diem basis. Any equity capital invested is allowed a 9.2% return and the per diem return is calculated. The per diem costs of operation, administration, and return on equity are summed
to reach the final per diem rate.
In a study for the Massachusetts Department of Public Health by Beattie and Jordan,5 the authors claimed that the rate structure discourages nursing homes from admitting Medi-caid patients after reaching the mandated minimum occupancy rate. In fact, RSC is considering raising the minimum occu-pancy rate to 93% to encourage the further admittance of
Medicaid patients. However, a further analysis of this point raises some questions of the Beattie and Jordan statement. The per diem rate is figured on the basis of patient days without regard to the number of Medicaid patients or any
other type of patient. It is important to keep in mind that
a nursing home can charge a private patient more at any time,
regardless of the occupancy rate. As long as the maximum
allowable costs are not yet reached, the extra costs of one
more patient of any type at any time regardless of occupancy
rate (if costs do in fact increase) can be passed on as an
increase in the per diem rate. Under such conditions, there
does not seem to be any reason for differentiating between
the type of patient to be admitted as a function of occupancy
rate. If costs remain constant with one more patient, the
per diem rate will then decrease, bu then again the costs/
patient are decreasing. Finally, even if the additional
costs of one more patient cannot be passed on, having reached
the maximum allowable costs, the nursing home may still be
better off admitting the extra patient if the fixed cost loss
of an empty bed is greater than the loss from the additional
costs that cannot be passed on.
3.3
Nursing Home Misutilization as Found in the Literature
Despite the establishment of different rates for the
varying levels of care, there still remains the desire to
accept those patients that will require the least amount of
care. This section will review a few documented studies of
the misutilization of nursing homes.
6
Berg et al.
surveyed by sample, the needs of those 65
years of age and over in Monroe County, New York. The
appropriate placement was judged on the basis of the type and
amount of health care services required by the patient. The
findings point to the misplacement of many aged persons in
facilities providing a higher and more costly level of care
than required and the need
for more congregate living and home
care services in general.
Specifically, 19% of the aged patients in nursing homes
were inappropriately placed, while an additional 14% of those
in homes for the aged, 25% in the Monroe County Home, and 59%
in boarding homes and homes for adults were misplaced. The
appropriateness of the placement varied with the age group,
as those 65 - 69, 70 - 79, 80 - 89, and 90 and over, eachre-vealed an increasing percentage of appropriate placement.
Women receiving too high a level of care accounted for most
of the misplacement in nursing homes.
Social class varied
directly with appropriate placement. The higher the social
class, the higher the level of appropriate placement.
Characteristics associated with those unmet needs, or
that should be in a nursing home, are increasing age and
de-creasing social class. Men with unmet needs were mainly
lacking physical care while women were about equally divided
between needing physical care and supervision for mental
im-pairment. Berg et al. found that 90% of the aged population
can live at home with suitable assistance.
The bed need arrived at in Berg's study amounted to 30 beds/1000 aged population, nursing homes, and 59 beds/ 1000 aged population, in homes for the aged. The average bed/population ratio for the state of New York is 29.3 beds/ 1000 aged population for nursing care homes and 41.1 beds/ 1000 aged population for nursing care and related homes. These figures are below the United States averages of 44.6 beds/1000 aged population for nursing care homes and 58.4 beds/1000 aged population for nursing care and related homes. In Massachusetts, these figures are well above the United States average at 61.3 beds/1000 aged population, for nursing care homes, and 77.3 beds/1000 aged population, for nursing care and related homes.7
A study in the Netherlands suggested 153 beds/1000 aged population in homes for the elderly and 34 beds/1000 in
nursing care homes.8 A Nuffield Trust study in Great Britain concluded that 95% of the aged population can live at home with suitable assistance.9
Davis and Gibbon10 surveyed by sample the use, misuse, and non-use of nursing homes in six counties in western New York: 26.8% of those in nursing homes were found to be at a higher level of care than necessary. There was no differ-ence by sex in the levels of appropriate placement in nursing homes; however, appropriate placement did increase with ad-vancing age. A higher percentage of married people were
appropriately placed, as were people from rural environments.
Fourteen percent of those in hopitals or at hcme should have
been in a nursing hame.
There was a higher percentage of married
people than non-married people who should have been in nursing hames
and were not. The rural or urban location made no difference in terms
of the number of people with unmet nursing care need, however people
frcn rural areas tended to remain at home while those fran urban
areas tended to be
in
general hospitals.
These
results imply there is some choice or preference
expressed in seeking nursing home care or there is a lack of
available alternatives. Davis and Gibbon suggest
inappro-priately placed people seek companionship and.assistance
with routine daily maintenance, rather than the skilled
nursing care. They offer an environmental or sociological
explanation for the different utilization patterns of those
from rural and urban settings. The impersonal urban
en-vironment may provide fewer resources for the needs and
attention of elderly. This is in contrast with the closer
communai or familial ties associated with the rural setting.
Thus when someone from the rural location seeks nursing
home care, he is more likely to appropriately need that
level of care. There is an additional explanation for the
differences in nursing home usage by married and non-married
people. A larger number of non-married people in nursing
inappropriately placed. With a larger number of non-married people in nursing homes one might then expect to find a
smaller proportion of non-married people needing placement in a nursing home.
A recent article in the American Journal of Public
1
Health on the nursing home industry in Massachusetts, cites a patient care survey by the M.D.P.H. estimating that 1/3 of the patients in Massachusetts nursing homes require little
if any of the nursing home services. 3.4 Periodic Medical Review
The Division of Health Care Standards of the M.D.P.H. conducts a Periodic Medical Review of nursing home patients in Level II (Medicaid - skilled nursing) facilities, under, contract from the Massachusetts Department of Public Welfare. The results of the Periodic Medical Review (PMR) 11 are ex-pressed in terms of the number of patients recommended for transfer to a lower level of care. Between December, 1972 and December, 1974, it was found that 26% of the 3,291 patients reviewed in 119 Level II facilities were recom-mended for transfer to a lower level of care. Of the 399 patients reviewed in 11 Level II facilities in January, 1975,
25% were recommended for transfer to a lower level. In February, 1975, 343 patients were reviewed in 9 Level II facilities and 23% were recommended for transfer to a lower level of care.
Overall, 25.7% of the 4,033 patients in 139
facili-ties were recommended for transfer to a lower level of care.
It should be recognized that the 25.7% of the patients
recommended for transfer is not the number actually
trans-12
ferred. An estimated 1/3
of those recommended for
transfer were eventually transferred. The reason cited as
preventing most transfers is that of expected "transfer
shock" resulting from movement to another institution and
a new environment. This increases the value of multi-level
facilities, in which patients can be internally transferred
to lower levels of care with less risk of transfer shock.
3.5
Hospital Waiting Time Study
Beattie and Jordan5 of the M.D.P.H. recently conducted
a study examining the factors contributing to queues of
hos-pital patients medically ready for discharge and awaiting
placement in a nursing home. A one day survey was used to
collect data on the individual patients waiting for placement
in nursing homes and the number of nursing home beds
avail-able that day. A follow-up survey six weeks later was
con-ducted to provide further information on placement patterns.
There were 2,021 patients awaiting palcement on the day
of the survey and they accounted for 112,000 days of
hospi-talization during a four month period. The days spent
waiting are underestimated because some of the patients were
already waiting for placement prior to the survey and some
continued to wait for placement after the follow-up study.
During the six week follow-up period 41% of the patients
were placed, 45% remained waiting, and 14% died, went home,
or were no longer ready for nursing home placement. The
average waiting time for all patients was 55 days.
There
were many more patients (771) waiting for placement than
there were available beds (41) for Level I/II care.
Although
the number of beds exceeded the number of patients waiting
for placement in Level III and IV beds, it was estimated that
only 12%, 6% and 1% of the available beds would be filled
each day in Levels I/II, III, and Iv.
An inverse relationship
between the number of available beds and waiting time was
found. This is explored later in the chapter.
Medicaid was the source of payment for 48% of the
patients. For the patients in acute general hospitals, those
with Medicaid financing had a longer wait (36 days) than
non-Medicaid patients (22 days).
Medicare patients had the
shortest mean waiting time and the highest percentage of all
those placed, categorized by source of payment. The source
of payment and the level of care sought both had an effect
on the waiting time for placement in a nursing home.
3.6
A Simple Mathematical Model of Nursing Home Placement
Beattie and Jordan report in their findings that waiting
time appeared to be a function of the number of available
queuing theory. Willemain13 has devised a three state
nursing home Markov model that enables us to further
ex-plore the relationships between hospital discharge and
nursing home placement. The model assumes that the
popula-tion must be in one of three states:
(1) a nursing home;
(2) an acute general hospital receiving hospital care; or
(3) an acute general hospital waiting for placement in a
nursing home.
Musin H-omre
C(D
\
(receivit~
fate
The number of hospital beds is assumed to be infinite, thus
it is the number of nursing home beds that is the limiting
factor. The four variables in the model are:
(1) the number
of nursing home beds;
(2) the total patient population
(always assumed to be greater than the number of beds);
(3) the average length of stay in the nursing home; and
The results of this model confirm that as the number of nursing home beds increases, the number of patients medi-cally ready for discharge and waiting for placement in a nursing home decreases. The average number of days spent waiting in a hospital decreases too. In Figure 3-1, the
decreasing percentage of the hospital census medically ready for discharge is plotted against increasing nursing home beds. Figure 3-2 illustrates the decreasing number of hospital days spent awaiting nursing home placement plotted against in-creasing nursing home beds. As might be expected, with an increasing number of nursing home beds and therefore more nursing home patients in the system, the average daily cost/ patient in the system should decrease. The following cost
function: CH (1-S) + CNH(S) with S = probability of being in a nursing home, CH = daily hospital charges valued at $100, and CNH = daily nursing home charges valued at $20 is plotted in Figure 3-3. The model's results illustrated in
Figure 3-3, confirm that the average daily cost per patient in the system decreases with increasing nursing home beds. In each figure, the curves flatten out at 950 beds. This is because at this point the nursing home beds are no longer the limiting factor. There will always be some patients in the hospital regardless of the number of nursing home beds.
Therefore, there are no further savings resulting from lower average daily costs/patient if there are more than 950 beds
-10
L
4E
qO
30
N
+ -<7~t>I
49~
-~<717i<
1
+
.41~
* ~ .1...
1~~
9 ,. - --- .~'7
.>K
-I. -4P~*POpLIa+~OVI.-
1000
750'1W
-. 4. 97(yO
-7 5-Q010
qwj50
s
Hofne,
tes
-%
Hosp i4a)
Ce
sP
'C,
It .voP A o- -10096?
9510ir2~
4Eck
PA3
-<
A
ve-,P
b
~a::
rlc
DAN5peoF#
A~
Home~uwwrK,~
~
7
c2JTAv
ore
I ~. 1.1
5'
- + * 1-- I -~-3O c~) ~0 1^ -700750
cISC) iC 'IV * -4~ 0- - ~-1~ -I-- .-- - 4. - -.----.. - - - 4 . . --I ~~*1 -. --- I.. - -~~1 -~ - ---- 4.---.4..--~1
467so
j~L1O ~
C
2\
~3Q
-51-
K.ji-.7ii
I -, 4 . . . - I.I
~1
I...--. 4... -I.. -I . I.... .1... ~1 -~1.
1.... .4 ...~1
9p~. ,
-,Y
VL4
+ lO-
0a
700 750C1 T ,5-
3
HoM6 T J-5 sto~reHone,
bi3
2
&5
Cc's
4,-
+ V a4 ... I...
I 4