HAL Id: hal-01890850
https://hal.archives-ouvertes.fr/hal-01890850
Submitted on 9 Oct 2018
HAL is a multi-disciplinary open access
archive for the deposit and dissemination of
sci-entific research documents, whether they are
pub-lished or not. The documents may come from
teaching and research institutions in France or
abroad, or from public or private research centers.
L’archive ouverte pluridisciplinaire HAL, est
destinée au dépôt et à la diffusion de documents
scientifiques de niveau recherche, publiés ou non,
émanant des établissements d’enseignement et de
recherche français ou étrangers, des laboratoires
publics ou privés.
high-frequency acquisition of stream chemical data
Paul Floury, Jérôme Gaillardet, Eric Gayer, Julien Bouchez, Gaëlle Tallec,
Patrick Ansart, Frédéric Koch, Caroline Gorge, Arnaud Blanchouin,
Jean-Louis Roubaty
To cite this version:
Paul Floury, Jérôme Gaillardet, Eric Gayer, Julien Bouchez, Gaëlle Tallec, et al.. The potamochemical
symphony: new progress in the high-frequency acquisition of stream chemical data. Hydrology and
Earth System Sciences, European Geosciences Union, 2017, 21 (12), pp.6153-6165.
�10.5194/hess-21-6153-2017�. �hal-01890850�
https://doi.org/10.5194/hess-21-6153-2017 © Author(s) 2017. This work is distributed under the Creative Commons Attribution 3.0 License.
The potamochemical symphony: new progress in the high-frequency
acquisition of stream chemical data
Paul Floury1,2, Jérôme Gaillardet1, Eric Gayer1, Julien Bouchez1, Gaëlle Tallec2, Patrick Ansart2, Frédéric Koch3, Caroline Gorge1, Arnaud Blanchouin2, and Jean-Louis Roubaty1
1Institut de Physique du Globe de Paris (IPGP), CNRS and Université Sorbonne Paris-Cité, 1 rue Jussieu, 75238 Paris, France 2UR HBAN, Institut national de recherche en sciences et technologies pour l’environnement et l’agriculture,
Antony (IRSTEA), France
3Endress+Hauser SAS, Huningue, France
Correspondence to:Paul Floury ([email protected]) and Jérôme Gaillardet ([email protected]) Received: 10 January 2017 – Discussion started: 13 January 2017
Revised: 12 September 2017 – Accepted: 29 October 2017 – Published: 7 December 2017
Abstract. Our understanding of hydrological and chemical processes at the catchment scale is limited by our capacity to record the full breadth of the information carried by river chemistry, both in terms of sampling frequency and preci-sion. Here, we present a proof-of-concept study of a “lab in the field” called the “River Lab” (RL), based on the idea of permanently installing a suite of laboratory instruments in the field next to a river. Housed in a small shed, this set of instruments performs analyses at a frequency of one every 40 min for major dissolved species (Na+, K+, Mg2+, Ca2+, Cl−, SO2−
4 , NO −
3)through continuous sampling and filtra-tion of the river water using automated ion chromatographs. The RL was deployed in the Orgeval Critical Zone Observa-tory, France for over a year of continuous analyses. Results show that the RL is able to capture long-term fine chemical variations with no drift and a precision significantly better than conventionally achieved in the laboratory (up to ±0.5 % for all major species for over a day and up to 1.7 % over 2 months). The RL is able to capture the abrupt changes in dissolved species concentrations during a typical 6-day rain event, as well as daily oscillations during a hydrological low-flow period of summer drought. Using the measured sig-nals as a benchmark, we numerically assess the effects of a lower sampling frequency (typical of conventional field sam-pling campaigns) and of a lower precision (typically reached in the laboratory) on the hydrochemical signal. The high-resolution, high-precision measurements made possible by the RL open new perspectives for understanding critical zone hydro-bio-geochemical cycles. Finally, the RL also offers a
solution for management agencies to monitor water quality in quasi-real time.
1 Introduction
Rivers are messengers from the critical zone. The chemical composition of rivers offers a window into the multiple pro-cesses that operate among water, organic matter, primary and secondary minerals and living organisms at the Earth’s sur-face (Calmels et al., 2011; Feng et al., 2004; Kirchner et al., 2000, 2001; Neal et al., 2012, 2013). Understanding the pa-rameters that control the composition of river water is not only a scientific challenge but also one of the major chal-lenges for humanity to access and preserve drinkable water (Bain et al., 2012; Banna et al., 2014; Bartam and Ballance, 1996). A limit in our understanding of water geochemistry at the Earth’s surface is limited by the temporal resolution at which sampling can be operated (Whitehead et al., 2009). As summarized by J. Kirchner: “If we want to understand the full symphony of catchment hydrochemical behaviour, then we need to be able to hear every note.” (Kirchner et al., 2004, p. 1358). Yet, taking high-frequency sample sets back to the laboratory, filtering and analysing them for several el-ements is limited by the requirement of considerable human resources (Chapman et al., 1996; Danielsen et al., 2008; Hal-liday et al., 2015; Neal et al., 2013; Rozemeijer et al., 2014; Strobl and Robillard, 2008; Telci et al., 2009).
A significant number of studies have reported high-frequency chemical measurements in watersheds. Thus far, these data have been mostly acquired during limited periods of time such as single storm events or a day (Beck et al., 2009; Brick and Moore, 1996; Chapman et al., 1997; Gam-mons et al., 2007; Kurz et al., 2013; Liu et al., 2008; Morel et al., 2009; de Montety et al., 2011; Neal et al., 2002; Nim-ick et al., 2011, 2005; Takagi, 2015; Tercier-Weaber et al., 2009). Although these studies clearly highlighted the wealth of information provided by sampling rivers at sub-hourly fre-quency, they underestimate the legacy of past hydrological episodes (Kirchner, 2006; Jasechko et al., 2016; Rode et al., 2016) and are of limited use when mass budgets are to be calculated for a typical hydrological cycle.
To date, the best combination of high-frequency and long-term monitoring ever reported for river chemistry is a 7 h fre-quency sampling over 18 months (Neal et al., 2012). In this study, the authors demonstrate the “act of discovery” per-mitted by such sampling scheme, by showing that the high sampling frequency of river hydrochemistry over sufficiently long time spans reveals patterns related to hydrological and biological drivers that are imperceptible at lower sampling frequency. Automated approaches, developed using probes installed directly in the river (Rozemeijer et al., 2010a; Mac-intosh et al., 2011; Cassidy and Jordan 2011; Dåbakk et al., 1999; Glasgow et al., 2004; Zhu et al., 2010; Yang et al., 2008), or using online instrumental devices in which contin-uously pumped water is injected (Rozemeijer et al., 2010b; Zabiegala et al., 2010; Jordan and Cassidy, 2011), are alter-natives to sampling methods requiring human intervention. Several papers have been published over the last decade re-porting existing devices mostly focused on monitoring dis-solved N or P and organic matter (Clough et al., 2007; Kunz et al., 2012; Aubert et al., 2013b; Escoffier et al., 2016). A re-cent overview of the potential of available conductivity, dis-solved oxygen and carbon dioxide, nutrients, disdis-solved or-ganic matter and chlorophyll in situ probes is given by Rode et al. (2016). A new solution for high-frequency measure-ment of river chemistry is offered by bringing the labora-tory’s measuring devices to the field (the “lab in the field” concept). A Swiss group has recently developed such a sys-tem (von Freyberg et al., 2017) by installing ionic chro-matography devices in a hut next to a stream. In this paper, we present a parallel initiative named the River Lab (RL) and funded by the French programme CRITEX: “Innovative sen-sors for the temporal and spatial EXploration of the CRITi-cal Zone at the catchment sCRITi-cale” (https://www.critex.fr). This approach, like the previously published one, overcomes tra-ditional limitations on the number of samples and avoids sev-eral issues related to sample transport, filtration and storage. The RL is able to perform a complete chemical analysis of all inorganic major anionic and cationic species in the dissolved load of river water using ion chromatography (IC), with a frequency of up to one complete measurement every 40 min.
This article is a proof-of-concept paper that describes the analytical design of the RL and its performance by evaluating the precision, reproducibility and accuracy of concentration measurements. The first results from the RL reveal a signif-icant improvement in reproducibility compared to conven-tional sampling and analysis techniques. Leveraging these optimal analytical conditions, the RL is able to reveal tem-poral patterns of river chemistry, such as daily concentration variations. The RL opens thus new opportunities in the field of river chemistry research and environmental monitoring.
2 Monitoring site
The RL was installed in the Orgeval Critical Zone Obser-vatory, located 70 km eastward from Paris, France (https: //gisoracle.irstea.fr/), a temperate agricultural catchment, within the Seine River watershed, and part of the French Critical Zone Research Infrastructure OZCAR (“Observa-toires de la Zone Critique, Applications et Recherche”). The Orgeval catchment is one of the most instrumented and docu-mented river observatories in France, with 50 years of hydro-logical data (Garnier et al., 2014). Catchment hydrologic data are available on the ORACLE website (https://bdoh.irstea.fr/ ORACLE/).
The RL is installed at the outlet of the Avenelles River, a sub-catchment in the Orgeval watershed. The Avenelles River drains an area of 45 km2. The climate is temperate and oceanic, with cool winters (mean temperature 3◦C), warm summers (20◦C on average) and an annual precip-itation rate of ∼ 650 mm on average. The Avenelles sub-catchment sits within the sedimentary carbonate-dominated Paris Basin. The river is perennial, supplied by groundwa-ter from the Brie aquifer, with wagroundwa-ter chemistry dominated by Ca2+, SO2−4 , HCO2−3 and NO−3 ions. The water level at the Avenelles gauging station shows an average daily volumetric flow rate of 0.2 m3s−1(from 1962 to 2016), with low water period in summer (0.1 m3s−1) and flash flood events reach-ing 10.4 m3s−1in spring.
3 Design of the River Lab
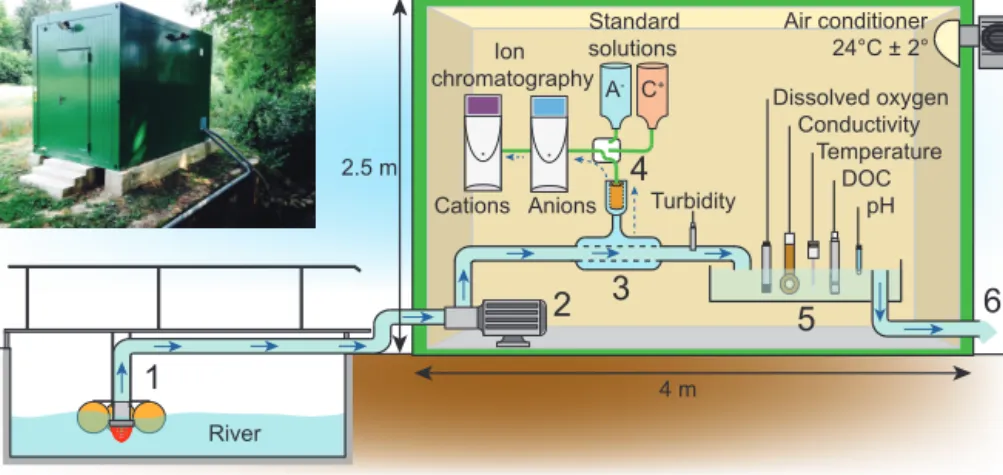
The concept of the RL is to pump river water and feed it to a set of physico-chemical probes and ion chromatography (IC) instruments for a complete analysis of major dissolved species continuously at high frequency (40 min is needed for a complete analysis). All the instruments of the RL fit into an isolated bungalow of 4 m length by 2.5 m width, kept at 24◦C ± 2◦C. The RL was designed by IPGP (Institut de Physique du Globe de Paris, France) and IRSTEA (Insti-tut National de Recherche en Sciences et Technologies pour l’Environnement et l’Agriculture, France) and assembled by Endress & Hauser (E+H®) (Fig. 1). A technical diagram is available in the Supplement (Fig. S1).
Cations Anions Turbidity Air conditioner 24°C ± 2° River Dissolved oxygen Conductivity Temperature DOC pH
1
2
3
4
5
6
Ion chromatography A- C+ Standard solutions 4 m 2.5 mFigure 1. Diagram of the Orgeval River Lab. Bold blue arrows indicate the primary circuit of unfiltered water. Dashed arrows indicate filtered water supplied to IC instruments. (1) The inlet of the primary circuit samples the river at a constant 20 cm depth maintained by buoys. Water is first filtered through a < 2 mm pore size strainer. The distance between the mouth and the pump is 6 m. The primary circuit assembly is almost entirely composed of polyvinyl chloride (PVC) pipes. (2) The electric pump runs continuously at a constant power, leading to a rate of 700 L per hour. (3) Almost all the river water just flows through the pipe and remains unfiltered. A fraction is filtered through a 2 µm tangential stainless steel filtration unit, then filtered through a 0.2 µm cellulose acetate frontal filter prior to being delivered to IC instruments at a flow rate of 1 L per hour. (4) A multiport valve before introduction to the IC instruments allows for switching between filtered river water and standard or blank solutions. (5) All probes are deployed in an overflow tank of 5 L of unfiltered river water. (6) The outlet of the primary circuit is downstream in the river.
The RL has been designed around a primary circuit, which pumps the river water at 700 L per hour. First, the unfiltered river water sampled in the middle of the stream (Fig. 1) con-tinuously supplies an overflow tank where six parameters are measured: pH, conductivity, dissolved O2, dissolved organic carbon (DOC), turbidity and temperature. The water is then released into the river downstream from the RL. The turnover time of water in this primary circuit is 2 min. The turbidity probe is installed upstream of the overflow tank in a pipe perpendicular to the flow to provide more accurate measure-ments. The turbidity and DOC probes benefit from an auto-matic self-cleaning every 5 min using compressed air. For all probes, the frequency of acquisition is one measurement per minute. The tank and each probe are hand-cleaned weekly. All probes are developed and provided by Endress & Hauser (E+H®).
Second, a fraction of water pumped through the primary circuit feeds another circuit directed toward two IC instru-ments for the measurement of major dissolved species con-centrations. A filtration system is deployed between the pri-mary circuit and the IC instruments, consisting of a tangen-tial filter with a 2 µm pore size, followed by a 0.2 µm frontal filtration system through cellulose acetate filters (Fig. 1), crucial for the IC instruments. Cation and anion chro-matographs, connected in series, are fed simultaneously ev-ery 40 min from the filtered water circuit through a injection valve. Between two injections, the water in the filtered cir-cuit is constantly renewed (1 L per hour). Our tests show that the frequency for a complete and uncontaminated analysis of
cation and anion is actually limited by the filtration device (see Sect. 4.3).
The IC analysis is performed using two Dionex® ICS-2100 (Thermo Fisher Scientific®) instruments using eluent produced with concentrated eluent cartridges and ultra-pure water (Fig. 1). The cationic species measured are Na+, K+, Mg2+ and Ca2+, and anionic species are Cl−, NO−3 and SO2−4 . The chosen analysis time is 30 min (40 min if Sr2+ concentration measurements are included; see details in Sup-plement “Ion Chromatographs characteristics”). The multi-port valve installed upstream of the ICs allows us to check the drift of the instruments and the background signal by regular introduction of calibration solutions and pure distilled water (see Sect. 4). Pure distilled water is regularly (every 2 weeks) introduced to check the residual noise. Both cationic and anionic chromatographs are calibrated every 2 months us-ing synthetic solutions mimickus-ing the river chemistry, made from 1000 ppm mono-elemental standard solutions. Two sets of calibration solutions are prepared, one for anions and the second for cations. The first solution (called “River ×1”) is prepared based on concentrations of the river water during summer, i.e. with the highest measured concentrations for most species. In the second solution, these concentrations are doubled (called “River ×2”). Further solutions are produced out of River ×1 and ×2 through dilution by up to tenfold to achieve lower concentrations (“River ×0.5; ×0.25; ×0.1”). The resulting five calibration solutions cover the entire range of possible natural variability of each species observed for the Orgeval River, including flood events.
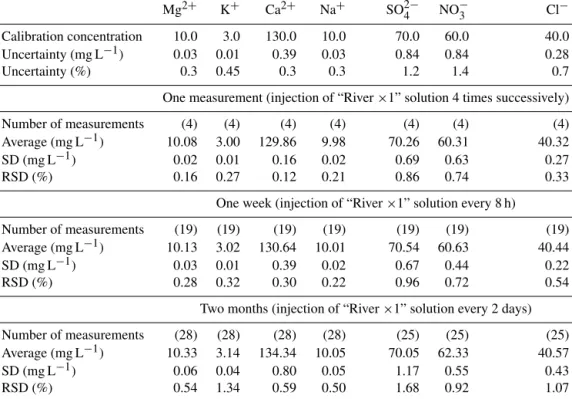
Table 1. Assessment of the RL accuracy and instrumental drift based on concentration measurements made after several injections of the standard solution “River ×1”. The uncertainty on the calibration solution is the quadratic sum of the uncertainty on the standard solutions (provided by the manufacturer) and the overall uncertainty for weighing during solution preparation. Measurement errors over 1 week and over 2 months are expressed as the relative standard deviation (RSD) calculated for repeated injections of the solution “River ×1” directly into the IC instruments via the multiport valve (see Fig. 1).
Mg2+ K+ Ca2+ Na+ SO2−4 NO−3 Cl− Calibration concentration 10.0 3.0 130.0 10.0 70.0 60.0 40.0 Uncertainty (mg L−1) 0.03 0.01 0.39 0.03 0.84 0.84 0.28 Uncertainty (%) 0.3 0.45 0.3 0.3 1.2 1.4 0.7 One measurement (injection of “River ×1” solution 4 times successively) Number of measurements (4) (4) (4) (4) (4) (4) (4) Average (mg L−1) 10.08 3.00 129.86 9.98 70.26 60.31 40.32 SD (mg L−1) 0.02 0.01 0.16 0.02 0.69 0.63 0.27 RSD (%) 0.16 0.27 0.12 0.21 0.86 0.74 0.33
One week (injection of “River ×1” solution every 8 h)
Number of measurements (19) (19) (19) (19) (19) (19) (19) Average (mg L−1) 10.13 3.02 130.64 10.01 70.54 60.63 40.44 SD (mg L−1) 0.03 0.01 0.39 0.02 0.67 0.44 0.22 RSD (%) 0.28 0.32 0.30 0.22 0.96 0.72 0.54
Two months (injection of “River ×1” solution every 2 days) Number of measurements (28) (28) (28) (28) (25) (25) (25) Average (mg L−1) 10.33 3.14 134.34 10.05 70.05 62.33 40.57 SD (mg L−1) 0.06 0.04 0.80 0.05 1.17 0.55 0.43 RSD (%) 0.54 1.34 0.59 0.50 1.68 0.92 1.07
Data from probes and ICs are collected, merged and up-dated in a single database in real time. Data from the gaug-ing station (flow discharge and precipitation level) are auto-matically added to the database. Several parameters of the RL can be remotely monitored such as pump activity, pres-sure, flow and temperature in the primary circuit; activation of the tangential filtration cleaning system; instrument con-nection; and temperature in the bungalow. A set of alarms and sensors controls each key point of the system. An email is automatically sent in case of dysfunction. Under normal operating conditions, the RL needs human intervention only once a week.
4 Analytical performances of the River Lab
RL data acquisition started on 12 June 2015. The reliability of the system was assessed through five different tests involv-ing IC measurements and the samplinvolv-ing procedure (accuracy, drift, precision of the whole system, cross-contamination and reproducibility). We refer to the third edition of JCGM 200-2012 (Joint Committee for Guides in Metrology) (JCGM, 2012) for the terminology used in assessing the performance criteria.
4.1 Accuracy and instrumental drift
The aim of the RL is to achieve very high-frequency mea-surements of river chemistry over long periods of time (pluri-annual). To compensate for any long-term drift in the IC calibration, instruments are calibrated with a new set of so-lutions every 2 months or after each maintenance opera-tion on the IC instruments. However, calibraopera-tion drift can occur over timescales shorter than 2 months, resulting in systematic and/or random errors in concentration measure-ments. We evaluated this effect using a set of injections of the “River ×1” solutions, over 1 week and over 2 months (Table 1). For all species measured, no systematic variation was observed in the measured concentration of the solution “River ×1”, showing that at the two timescales, instrumen-tal drift does not induce any systematic bias on concentra-tion measurements, and that most of the error is of random nature. Therefore, the standard deviation of the concentra-tion measurements of a given soluconcentra-tion can be used as a re-liable measure of the error due to instrumental drift. The measurement error over 1 week is calculated as the standard deviation of concentration measurements over 19 injections of solution “River ×1” performed every 8 h during 1 week (from 5 to 12 November 2015). The measurement error over 2 months is calculated as the standard deviation of
concen-Table 2. Precision on concentration measurements of the whole RL system calculated as the relative standard deviation (RSD) of concentra-tion measurements made over three 24 h closed-loop experiments, during which the inlet and the outlet of the primary circuit are connected through a 300 L tank of river water.
Date Number of Mg2+ K+ Ca2+ Na+ SO2−4 NO−3 Cl− measurements RSD (%)
20 July 2015 (22) 0.17 0.90 0.21 0.22 0.39 0.47 0.24 28 August 2015 (20) 0.32 0.63 0.31 0.36 0.20 0.25 0.19 17 April 2016 (35) 0.38 1.20 0.17 0.31 0.31 0.38 0.30
tration measurements over a series of injections performed every 2 days during 2 months (from 28 December 2015 to 26 February 2016). These error estimates are lower than 1 % over 1 week and lower than 1.7 % over 2 months (Table 1). The agreement between the calculated concentrations of the “River ×1” solution and the RL measurements also demon-strates the accuracy of the prototype (Table 1).
4.2 Precision of the whole system
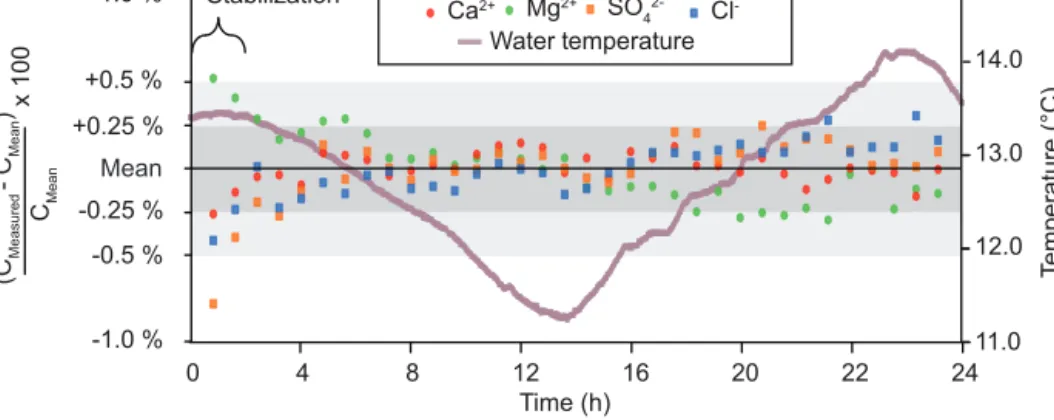
In order to estimate the precision of the whole system (IC in-struments combined with the sampling device including the primary circuit, the pump and the filtration units), we per-formed a “closed-loop experiment” over the course of 1 day by connecting the inlet and the outlet of the primary circuit to a 300 L tank containing river water. The test was performed 3 times over two different seasons (on 20 July 2015, 28 Au-gust 2015 and 17 April 2016). The conductivity probe (one measurement every minute) was used to check the stability of the water chemistry during the course of the experiment (Fig. S2). Our results show that a lapse of 2 h at least is neces-sary for the system to stabilize, corresponding to the homog-enization time of the water within the closed loop (Fig. 2). After 2 h, major anion and cation concentrations show a re-markable stability, indicating the absence of drift over of 24 h time lapse despite the temperature variations in the river wa-ter, and allowing us to estimate the precision of the whole system over 1 day using the standard deviation of the mea-surements performed during the test. The results of the test are presented in Table 2. The precision reached is better than 0.5 % for all species except for potassium, for which it is bet-ter than 1.2 %.
4.3 Cross-contamination
The ability of the RL to detect rapid variations in river chem-istry (typically expected during storm events) depends on (1) the response time of the RL to a perturbation in the river and (2) the potential cross-contamination from one sample to the next one. We assessed these two effects by a tracer injection experiment. After establishing a closed-loop exper-iment (on 29 August 2015) and allowing for the period of stabilization, we introduced a known amount of NaCl (200 g previously dissolved in a small amount of river water) into
the 300 L tank of river water in order to simulate a “spike” in the river chemistry. The monitoring of conductivity in the pri-mary circuit allowed us to follow the propagation of the spike injection into the primary circuit while Cl− concentrations measured by the IC every 40 min allowed us to follow its propagation through the filtration devices and IC instruments (Fig. 3). The conductivity probe shows that the salinity spike is detected very quickly and stabilized after 5 min. This indi-cates that the water in the primary circuit is quickly homog-enized (in agreement with the high flow rate of the primary circuit: 700 L h−1). Conversely, the Cl−and Na+ concentra-tions only reach the expected concentration at the second IC measurement, i.e. after 80 min.
The first IC measurement following the spike injection in-dicates that only 93 % of the final steady-state concentration is reached, revealing a contamination of the (n)th sample by 7 % of the (n − 1)th sample. In practice, such a contamina-tion will only be significant if the instantaneous derivative of river concentration with time is important. In the case of the Orgeval River, where the RL is deployed, the relative derivative of the concentration with respect to time is lower than 1 % per hour for 90 % of the time for all species. In this case, the cross-contamination induces an error of 0.07 % compared to the true concentration, which means that the ef-fect of cross-contamination is negligible compared to the pre-cision of the RL (see Sect. 4.2). However, in the case of flood events, when the stream flow increases quickly, the derivative of concentration can change by more than 10 % per hour. In such cases, cross-contamination will induce an error of 1 % or more. The injection test shows that the time resolution of the RL is limited by the transfer time of the water between sampling and injection into the IC instruments. This transfer time of the water in the RL is mainly due to the design of the filtration system, which may be improved in the future. 4.4 Reproducibility: RL vs. laboratory
As a final test for assessing the ability of the RL to record fine natural variations of river chemistry in comparison to conventional techniques of filtration and analyses in the lab-oratory, we focused on 2 days in the summer of 2015 follow-ing long periods without rain (21 July 2015 for cations and 19 April 2016 for anions), which showed very high resolu-tion diurnal variaresolu-tions (< 5 % relative) in chemical
compo--1.0 % -0.5 % +0.5 % +1.0 % Stabilization 12.0 13.0 14.0 Temperature (°C) 0 4 8 12 16 20 22 24 Time (h) Mg2+ Ca2+ SO 42- Cl -Water temperature 11.0 +0.25 % -0.25 % (CMeasured - C Mean ) CMean x 100 Mean
Figure 2. Assessment of the precision (in deviation from the mean for four dissolved species) of the whole RL system including the primary circuit, filtration systems and IC instruments (17 April 2016). A closed system is established on the primary circuit of the RL by connecting the inlet and the outlet through a 300 L tank of river water. The system is then run for a period of 24 h. The time between two IC analyses is 40 min. The purple curve represents data of temperature of the water in the tank. We do not consider the first 2 h (three first measurements), corresponding to the homogenization of water in the circuit and tank (see conductivity measurements in Fig. S2) for the calculation of precision. Cl concentration -0 % 20 % 60 % 100 % 09:30 12:00 02:30 17:00 32 ± 1 ppm 432 ± 1 ppm 675 ± 5 μS/cm 2069 ± 5 μS/cm Conductivity
Relative conductivity and
C l co nc en tr at io n
-normalized to initial and final values
Salt injection
Time 80 %
40 %
Figure 3. Cross-contamination assessment and response time of the RL system after a spike injection of 200 g of NaCl. A closed sys-tem is established on the primary circuit of the RL by connecting the inlet and outlet through a 300 L tank of river water prior to the injection. The conductivity measurement frequency is 1 per minute, whereas the time between two measurements of chloride concen-tration is 40 min. Error bars for conductivity and Cl−concentration measurements are within symbols’ size. Results are normalized to the difference between the minimum value, before the tracer injec-tion (0 %), and the maximum value, at the end of the experiment (100 %).
sition of the Orgeval River. In addition to the analyses made by the RL every 40 min, we conducted hourly sampling of the river by collecting 5 L of water and filtering it immedi-ately using a Teflon®frontal filtration unit (Sartorius®) with 0.2 µm porosity polysulfonether filters. Bottles of acidified (at pH = 2) and unacidified river water were transported to the laboratory at IPGP for measurement of major cations and anions, respectively, using IC devices similar to those in-stalled in the RL (Thermo Fisher®ICS-2100). In the labora-tory, measurements were performed using a Thermo Fisher® ICS-5000 for cation measurements and a Dionex®120 from
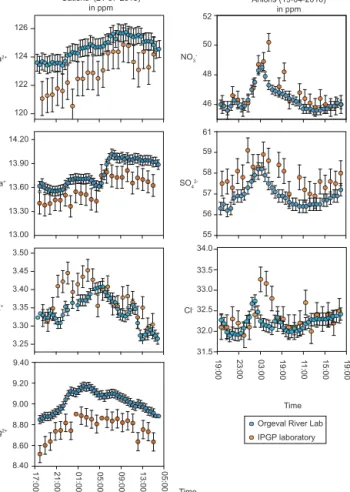
Thermo Fisher® for anion measurements. The calibration procedure in both laboratory and RL is the same, using the same set of calibration solutions. The error measurement reached in the laboratory is estimated at 1 % through repeated injections of the standard solution “River ×1” (every five samples). Comparison between the RL and the laboratory for the seven measured species are shown in Fig. 4. First, the measurements made by the RL are more precise than those performed in the laboratory, a feature that can be primarily attributed to the greater stability of the continuously work-ing injection system of the RL. Second, the fine variations measured by the RL are reproduced in the laboratory, vali-dating the observed diurnal variations and supporting the re-liability of the RL to detect changes of the order of a per-cent within a day. The third observation is that small yet systematic offsets between the two sets of data exist, up to 3 % for Mg. One possible explanation for this difference is that the filtration procedures differed between the RL and the manual sampling, which may have led to a discrepancy in the concentration measurements related to the potential for some elements to be hosted in the colloidal phase (Dupré et al., 1999). In addition, the most accurate measurements were obtained with the RL rather than with the laboratory equip-ment because the RL is continuously processing solutions with a similar matrix, thereby minimizing memory effects and cross-contamination that can compromise measurements if widely differing samples are run successively on the same instrument. These features of the measurement protocol, rep-resentative of most laboratory workflows for hydrochemical measurements, are likely to lead to inaccuracies. Regardless of the observed discrepancy between the two sets of measure-ments, we note that variations in concentration recorded by the RL and measured at the IPGP laboratory have the same amplitudes and are synchronous.
55 56 57 58 59 13.00 13.30 13.60 13.90 14.20 8.40 8.60 8.80 9.00 9.20 46 48 50 61 52 9.40 Time
Orgeval River Lab IPGP laboratory 120 122 124 126 3.25 3.30 3.35 3.40 3.45 3.50 32.0 33.0 34.0 33.5 31.5 32.5 Cations (21-07-2015) in ppm Anions (19-04-2016)in ppm 17:00 21:00 01:00 05:00 09:00 13:00 05:00 Time 19:00 23: 00 03:00 19:00 11 :00 15:00 19:00 Ca2+ Na+ K+ Mg2+ NO3 -SO4 2-Cl
-Figure 4. Reproducibility assessment of IC measurements made by the RL every 40 min (blue), compared with concentration mea-surements made in the laboratory after conventional hourly river sampling (orange). Tests were performed on 21 July 2015 and 19 April 2016 for the cationic and ionic species respectively. For measurements performed in the laboratory, the error measurement is 1 % (except for K+at 2 %), calculated as the standard deviation over repeated injection of the standard solutions “River ×1”. For RL measurements the error is given in Table 2.
5 Discussion
5.1 What are the benefits of bringing the lab into the field?
The RL presented above allows us to record continuously, at a high frequency and over long spans of time, the con-centration of seven major dissolved species in a river sys-tem. Although this is beyond the scope of the present paper, the RL presented here opens new possibilities for the explo-ration of the fine structure of hydrochemical evolution at the catchment scale and for improved understanding of the asso-ciated hydrological, geochemical and biological processes. From a technical point of view, our study shows that deploy-ing the conventional laboratory measurement techniques in the field adds significant value. The tests performed and
re-ported above clearly demonstrate an improvement in preci-sion compared to the analysis of bottled samples taken back to the lab. We see three main reasons for this improvement.
1. In a given river, dissolved concentrations typically vary by less than 1 order of magnitude when water discharge changes by several orders of magnitude (Godsey et al., 2009). This constancy allows us to select a relatively narrow range of concentration for establishing specific calibration curves of the IC instruments, a condition which is rarely possible in the laboratory, where differ-ent kinds of samples are analysed.
2. While in the laboratory samples are injected discretely, in the RL river water samples are injected as a continu-ous flow. Thus, the primary circuit and the filtration sys-tem operate continuously at a constant pressure, which supports stable and accurate analyses.
3. The third factor is the experimental conditions in the bungalow. The temperature is maintained at 24◦C ± 2◦ (in addition to the 40◦C thermostatically controlled temperature in the column, precolumn and detection de-vice of the ICs) allowing for better stability of the IC measurements. Moreover, the RL IC instruments are never stopped, which favours stability.
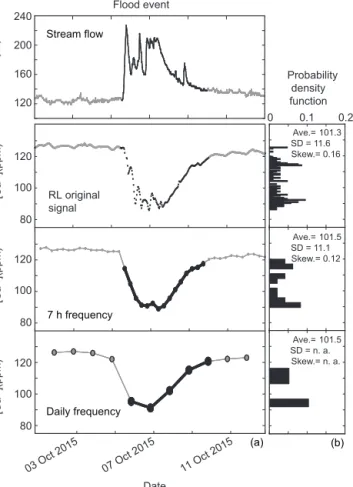
5.2 What is revealed by a higher sampling frequency? To our knowledge, the high frequency of measurements (one measurement every 40 min) reached by the RL installed on the Orgeval River is the highest ever reported for stream chemistry over several months. To highlight the correspond-ing improvement in the recorded concentration signal, we tested the effect of sampling frequency on the concentra-tion signal. First, we artificially subsampled the RL original signal at two lower sampling frequencies: every 7 h (start-ing 5 October 2015 at 10 pm) and every 24 h. The 7 h fre-quency was chosen to reproduce the sampling frefre-quency of Neal et al. (2012) made in the Plynlimon watershed, Wales. The daily sampling frequency is typically what is achievable on the long term by “human grab-sampling” in the field. Sec-ond, we calculated the probability density function (PDF) of concentration measurements over a given time interval. The use of PDFs allows us to explore the structure of concentra-tion signals beyond the mean concentraconcentra-tion, which consti-tutes an important metric for river solute budget, but lacks any insight into the variations in concentrations that can be used to retrieve information on catchment processes. We de-scribe the PDF by three statistical parameters: mean, stan-dard deviation and skewness. Skewness indicates the distri-bution asymmetry, both in magnitude and direction (a pos-itive skewness means that most values are higher than the mean). Altogether, the three parameters account, at first or-der, for the structure of a concentration signal. We compared these three parameters for the computed PDFs to quantify the signal degradation induced by artificial subsampling.
6160 P. Floury et al.: The potamochemical symphony
34
Figure 5. (a) Calcium concentration and stream flow in the Orgeval River during a rain event (from 1 to 25 October 2015), sampled ev-ery 40 min (RL original signal at 40 min frequency) and artificially subsampled every 7 h and every day at 10:00. Black dots represent data during the rain event strictly (from 5 to 10 October 2015 at 10:00), over which probability density functions (PDFs) of concen-tration are calculated and represented as histograms (b). For each PDF, the following statistical parameters are calculated: average (Ave.), standard deviation (SD), and skewness (Skew.). Grey dots represent concentration values outside of the rain event and are not considered in the corresponding PDF. The two statistical parameters standard deviation (SD) and skewness (Skew.) are not calculated for the daily subsampling because of the too small number of points.
We applied this statistical approach to two representative periods of the hydrological cycle of the Orgeval Critical Zone Observatory: a typical 6-day rain event caused by the arrival of a wet, Atlantic meteorological front (in October 2015) and a dry summer low water stage period (July 2015), where the stream is essentially sustained by groundwater, during an ap-parently steady hydrological period. We first present the be-haviour of calcium and sulfate concentrations as an example during the two considered periods (Figs. 5 and 6), before gen-eralizing to all measured species (Supplement and Figs. S3, S5 and S6).
– Rain event. The Ca concentration time series recorded at a 40 min frequency shows that minimum Ca con-centrations are recorded at maximum water discharge, but this relationship is invisible at lower sampling fre-quency (Fig. 5). Narrow peaks during the maximum of the stream flow are unresolved at a daily or 7 h fre-quency. The comparison of the calculated PDFs shows that a bimodal character is captured at all frequencies. The average and standard deviation are not significantly affected by the sampling frequency, with a relative dif-ference of less than 2 % for the values of these pa-rameters between the three distributions. However, the skewness values vary among the different records. From the 40 min frequency to the daily frequency signals, the skewness is weaker, which means that even if the over-all concentration variability is well captured at the lower sampling frequencies, the concentration signal is clearly degraded. This degradation is particularly intense dur-ing the middle of the rain event, where the concentration signal evolves quickly.
– Summer event. Despite the absence of rain events dur-ing the 2015 summer, the River Lab recorded high-frequency variations revealing a diurnal structure with 7 % relative variations between day and night. Each ele-ment exhibits its own type of daily variation in terms of amplitude and regularity. Figure 6 shows that the structure of this signal is altered when the sampling fre-quency decreases. While these daily variations are still captured when sampling occurs every 7 h, their ampli-tude is somewhat altered (5 %) compared to the 40 min sampling frequency (8 %). The daily variability of the signal is absent on the daily sampling frequency. While the mean remains the same over the range of sam-pling frequency, the variability quantified by the relative standard deviation decreases with lower sampling fre-quency, by up to 50 % for the daily frequency compared to the 40 min frequency signal, indicating a significant loss of information. The skewness of the concentration distribution recorded at a subsampled daily frequency has a value that is opposite in sign compared to the other two frequencies, indicating that there is an inversion of the measured asymmetry of the PDF at lower sampling frequencies. Therefore, too coarse a sampling frequency can yield a strongly altered signal compared to higher frequencies, resulting in a biased shape of the distribu-tion of the concentradistribu-tions.
– Generalization. The resampling approach applied above is generalized and expanded to other elements for both the summer and rain events. The generalization to all species measured is presented in the Supplement. In Figs. 5 and 6, we arbitrarily chose the hour of sam-pling (10:00 and 14:00 for Figs. 5 and 6, respectively). In Figs. S3, S5 and S6, the subsampling is performed
Figure 6. (a) Sulfate concentration in the Orgeval River during a summer event (from 7 to 19 July 2015) sampled every 40 min (RL original signal) and artificially subsampled every 7 h, and every day at 14:00. Probability density functions (PDFs) of concentration are represented as histograms (b). For each PDF, the following statistical parameters are calculated: average (Ave.), standard deviation (SD), and skewness (Skew.).
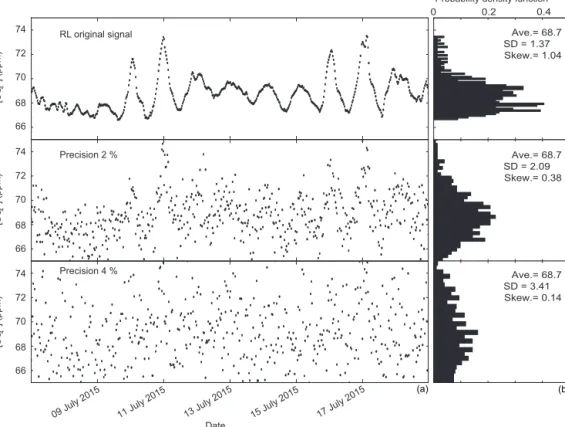
at each of the possible sampling hours. This statisti-cal analysis quantitatively demonstrates that such high-frequency measurements are able to capture the day– night chemical cycles of the Orgeval River. Given the amplitude and duration of typical rain events in the catchment, the alteration of the signal by lowering the sampling frequency is less critical but still significant during these periods (Supplement; Figs. S3, S5 and S6). 5.3 What is revealed by better analytical precision? As shown above, the Orgeval RL not only achieves high-frequency measurements but also results in improved preci-sion compared to conventional lab analysis following manual sampling. Therefore, any sampling procedure, even at a high frequency, involving conventional lab analysis induces a loss of precision. We demonstrate this effect through a numer-ically generated artificial degradation of the precision. Us-ing the original RL concentration signal as a reference, we artificially degraded the signals by adding a normally dis-tributed noise onto the concentration signals recorded by the RL. Noise levels of 4 and 2 % were tested; they are represen-tative of the “standard” analytical precision reported for most laboratory IC devices. The same representative periods as in
the previous section (summer and rain events) were utilized for these tests. In this section we present the example of one element for each characteristic period (Ca2+for rain event Fig. 7 and SO2+4 for summer event Fig. 8. The generalization for all elements is detailed in the Supplement (see Figs. S4, S7 and S8).
– Rain event. Figure 7 illustrates the concentration PDF obtained after degradation of the analytical precision for the Ca concentration. The narrow peaks recorded during the maximum of the stream flow are virtually invisible in the signal at a 4 % precision, and strongly smoothed in the signal at a 2 % precision. The original bimodal characteristic of the PDF is still visible in the 2 % pre-cision signal but no longer in the 4 % prepre-cision signal. The mean and standard deviation appear to be insensi-tive to these changes in analytical precision, while the skewness is strongly impacted, reflecting significant al-teration of the concentration PDF at lower precision. – Summer event. Figure 8 shows how the sulfate
con-centration signal is affected when the precision is de-graded. Day–night variations are only visible in the original RL signal because of its high analytical pre-cision. The effect of degraded precision on the PDFs is
Figure 7. (a) Calcium concentration and stream flow in the Orgeval River during a rain event (from 1 to 25 October 2015), as recorded by RL and for two artificially degraded signals using a normally distributed noise with standard deviation of 2 and 4 %, to reflect the effect of decreased analytical precision. Black dots represent data during the rain event strictly from 5 (12:00) to 10 October 2015. The probability density functions (PDFs) of concentration are calculated and represented as histograms (b). For each PDF, the following sta-tistical parameters are calculated: average (Ave.), standard devia-tion (SD) and skewness (Skew.). Grey dots represent concentradevia-tion values outside of the rain event, which are not considered for the analysis presented in (b).
more important than for the rain event (Fig. 7). While the mean value is robust, the standard deviation is al-tered (+150 % from the RL signal to the 4 % precision signal). The skewness decreases (but keeps the same sign) by up to 90 % for the signal at 4 % precision compared to the original signal and 74 % for the nal at 2 % precision, indicating that the original RL sig-nal asymmetry is lost as precision is worsened. These changes in the parameters of the concentration PDF show that the structure of the concentration signal in the Orgeval River would be significantly altered if the mea-surements were made with analytical precision lower than that of the RL prototype.
– Generalization. This approach has been expanded to other elements for both the summer and rain events, as shown in the Supplement, confirming that concentration PDFs are strongly sensitive to the analytical precision for all species (Figs. S4, S7 and S8).
6 Conclusions
This paper demonstrates the feasibility of deploying conven-tional laboratory instruments in the field to measure the con-centration of major dissolved anions and cations in rivers (Na+, K+, Mg2+, Ca2+, Cl−, SO2−4 , NO−3)at a high fre-quency (one measurement every 40 min) and at a high ana-lytical precision (better than 1 %) over several months. The River Lab prototype was installed in the Avenelles stream at the Orgeval Critical Zone Observatory, France. The RL features physico-chemical probes, an online 0.2 µm pore size filtration system, and two ionic chromatographic devices, all installed in a closed, air-conditioned bungalow. The RL is autonomous, remotely operable, and data can be transmitted automatically. Human intervention is required only once a week. Therefore, the RL allows for an efficient attribution of human resources, as well as considerable saving of consum-ables.
A suite of tests performed on the RL to assess quality mea-surement and to compare with more conventional “grab sam-pling” followed by laboratory measurements revealed only a minor drift in the instrument calibration, leading to improved precision. This precision is not easily achieved in the labora-tory under standard analysis conditions, showing the benefit of transporting the laboratory devices to the field. The analyt-ical capabilities of the RL for major dissolved elements could theoretically be extended to other elements separable by ion chromatography. Preliminary tests demonstrate that species present in trace amounts in river water (down to ppb, such as strontium or lithium) could be measured with the same gain in precision.
For this particular prototype, the measurement frequency (every 40 min) appears to be limited by the turnover time of water in the filtered water circuit, which is itself imposed by the filtration unit. However, the high frequency and high pre-cision of the RL enabled precise and accurate observations on the fine structure in hydrochemical time series. Their inter-pretation is beyond the scope of the present proof-of-concept paper but the RL is able to capture the abrupt changes in dissolved species concentrations during a typical 6-day rain event, as well as daily oscillations during a hydrological steady period of summer drought.
Using the high-frequency RL signal as a benchmark, it is possible to artificially alter the sample frequency and the an-alytical precision and study the resulting effect on the hy-drochemical distribution obtained for characteristic hydro-logical events. This analysis shows that in order to retrieve the fine structure of the hydrochemical signal, high sampling
74 66 68 72 70 74 66 68 72 70 74 66 68 72 70 0.2 0.4 0
09 July 2015 11 July 2015 13 July 2015 15 July 2015 17 July 2015
Summer event Probability density function
Date Ave.= 68.7 SD = 2.09 Skew.= 0.38 Precision 2 % Ave.= 68.7 SD = 1.37 Skew.= 1.04 RL original signal Ave.= 68.7 SD = 3.41 Skew.= 0.14 Precision 4 % [SO 4 2-] (ppm) [SO 4 2-] (ppm) [SO 4 2-] (ppm) (a) (b)
Figure 8. (a) Sulfate concentration in the Orgeval River recorded by the RL during 2 weeks in summer (7 to 19 July 2015), and for two artificially degraded signals, using a normally distributed noise with a standard deviation of 2 and 4 %, to reflect the effect of degraded analytical precision. The probability density functions (PDFs) of concentration are calculated and represented as histograms (b). The average (Ave.), standard deviation (SD), and skewness (Skew.) are calculated for each PDF.
frequency and improved analytical precision are both neces-sary conditions. To paraphrase James Kirchner’s quote: “If we want to understand the full symphony of catchment hy-drochemical behaviour, then we need to be able to hear every note” (Kirchner et al., 2004). The improvements made pos-sible by the RL here or concomitantly by von Freyberg et al. (2017) allow us to consider hearing the full potamologi-cal symphony.
Future work will explore the relationships between the desired measurement frequency and the timescales charac-terizing the complex interactions between primary and sec-ondary minerals, biotic processes and hydrological processes in catchments. Recording such fine stream hydrochemical variations has the potential to offer a new perspective in crit-ical zone science development.
Data availability. Data will be available in a dedicated database website after a contract accepted on behalf of all institutes.
The Supplement related to this article is available online at https://doi.org/10.5194/hess-21-6153-2017-supplement.
Competing interests. The authors declare that they have no conflict of interest.
Acknowledgements. This work was supported by the EQUIPEX CRITEX programme (grant no. ANR-11-EQPX-0011, PIs J. Gail-lardet and L. Longuevergne) and funding from IRSTEA (In-stitut national de Recherche en Sciences et Technologies pour l’Environnement et l’Agriculture). We thank Magadalena Niska for administrative help.
We would like to thank Jérôme Laurent, Xu Zhang, Quentin Charbonnier, Damien Calmels, Pascale Louvat, James Kirchner, Jenny Druhan, Susan Brantley, Bill McDowell and Jon Chorover for their help in the field and helpful comments. Alain Guerin (IRSTEA), Sylvain Losa (Thermo Fisher), Cedric Fagot, Patrick Reignier and Matthieu Bauer from Endress+Hauser (colleagues of Frédéric Koch) are thanked for technical assistance. Paul Floury benefited from a doctorate grant from MESR, France. The Orgeval CZO River basin belongs to the French National Infrastructure OZCAR (Observatoires de la Zone Critique, Applications et Recherche).
Edited by: Laurent Pfister
References
Aubert, A. H., Gascuel-Odoux, C., and Merot, P.: Annual hysteresis of water quality: A method to analyse the effect of intra- and inter-annual climatic conditions, J. Hydrol., 478, 29–39, 2013. Bain, R., Gundry, S., Wright, J., Yang, H., Pedleyc, S., and
Bar-tramd, J.: Accounting for water quality in monitoring access to safe drinking-water as part of the Millennium Development Goals: lessons from five countries, Bull. World Health Organ., 90, 228–235, 2012.
Banna, M., Imran, S., Francisque, A., Najjaran, H., Sadiq, R., Ro-driguez, M., and Hoorfar, M.: Online Drinking Water Quality Monitoring: Review on Available and Emerging Technologies, Environ. Sci. Technol., 44, 1370–1421, 2014.
Bartram, J. and Ballance, R.: Water Quality Monitoring. A prac-tical guide to the design and implementation of freshwater qual-ity studies and monitoring programmes, United Nations Environ-ment Programme, 400 pp., 1996.
Beck, A. J., Janssen, F., Polerecky, L., Herlory, O., and De Beer, D.: Phototrophic Biofilm Activity and Dynamics of Diurnal Cd Cy-cling in a Freshwater Stream, Environ. Sci. Technol., 43, 7245– 7251, 2009.
Brick, C. M. and Moore, J. N.: Diel variation of trace metals in the upper Clark Fork River, Montana, Environ. Sci. Technol., 30, 1953–1960, 1996.
Calmels, D., Galy, A., Hovius, N., Bickle, M., West, A., Chen, M., and Chapman, H.: Contribution of deep groundwater to the weathering budget in a rapidly eroding mountain belt, Taiwan, Earth Planet. Sc. Lett., 303, 48–58, 2011.
Cassidy, R. and Jordan, P.: Limitations of instantaneous water qual-ity sampling in surface-water catchments: Comparison with near-continuous phosphorus time-series data, J. Hydrol., 405, 182– 193, 2011.
Chapman, D.: Water Quality Assessments – A Guide to Use of Biota, Sediments and Water in Environmental Monitoring, 2nd Edn., United Nations Environment Programme, 651 pp., 1996. Chapman, P. J., Reynolds, B., and Wheater, H. S.: Sources
and controls of calcium and magnesium in storm runoff: the role of groundwater and ion exchange reactions along water flowpaths, Hydrol. Earth Syst. Sci., 1, 671–685, https://doi.org/10.5194/hess-1-671-1997, 1997.
Clough, T., Buckthought, L., Kelliher, F., and Sherlock, R.: Diur-nal fluctuations of dissolved nitrous oxide (N2O) concentrations and estimates of N2O emissions from a spring-fed river:
impli-cations for IPCC methodology, Glob. Change Biol., 13, 1016– 1027, 2007.
Dåbakk, E., Nilsson, M., Geladi, P., Wold, S., and Renberg, I.: Sam-pling reproducibility and error estimation in near infrared cali-bration of lake sediments for water quality monitoring, J. Near Infrared Spec., 7, 241–250, 1999.
Danielsen, F., Burgess, N. D., Balmford, A., Donald, P. F., Fun-der, M., Jones, J. P. G., Alviola, P., Balete, D. S., Blomley, T., Brashares, J., Child, B., Enghoff, M., Fjeldså, J., Holt, S., Hübertz, H., Jensen, A. E., Jensen, P. M., Massao, J., Mendoza, M. M., Ngaga, Y., Poulsen, M. K., Rueda, R., Sam, M., Skiel-boe, T., Stuart-Hill, G., Topp-Jørgensen, E., and Yonten, D.: Lo-cal Participation in Natural Resource Monitoring: a Characteri-zation of Approaches, Conserv. Biol., 23, 31–42, 2008.
de Montety, V., Martin, J. B., Cohen, M. J., Foster, C., and Kurz, M. J.: Influence of diel biogeochemical cycles on carbonate equilib-rium in a karst river, Chem. Geol., 283, 31–43, 2011.
Dupré, B., Viers, J., Dandurand, J. L., Polve, M., Bénézeth, P., Vervier, P., and Braun, J. J.: Major and trace elements associ-ated with colloids in organic-rich river waters: ultrafiltration of natural and spiked solutions, Chem. Geol., 160, 63–80, 1999. Escoffier, N., Bensoussan, N., Vilmin, L., Flipo, N., Rocher, V.,
David, A., and Groleau, A.: Estimating ecosystem metabolism from continuous multi-sensor measurements in the Seine River, Environ. Sci. Pollut. R., 23, 1–17, 2016.
Feng, X. H., Kirchner, J. W., and Neal, C.: Measuring catchment-scale chemical retardation using spectral analysis of reactive and passive chemical tracer time series, J. Hydrol., 292, 296–307, 2004.
Gammons, C. H., Grant, T. M., Nimick, D. A., Parker, S. R., and De-Grandpre, M. D.: Diel changes in water chemistry in an arsenic-rich stream and treatment-pond system, Sci. Total Environt., 384, 433–451, 2007.
Garnier, J., Billen, G., Vilain, G., Benoit, M., Passy, P., Tallec, G., Tournebize, J., Anglade, J., Billy, C., Mercier, B., Ansart, P., Azougui, A., Sebilo, M., and Kao, C.: Curative vs. preventive management of nitrogen transfers in rural areas: Lessons from the case of the Orgeval watershed (Seine River basin, France), J. Environ. Manage., 144, 125–134, 2014.
Glasgow, H., Burkholder, J., Reed, R., Lewitus, A., and Kleinman, J.: Real-time remote monitoring of water quality: a review of current applications, and advancements in sensor, telemetry, and computing technologies, J. Exp. Mar. Biol. Ecol., 300, 409–448, 2004.
Godsey, S. E., Kirchner, J. W., and Clow, D. W.: Concentration-discharge relationships reflect chemostatic characteristics of US catchments, Hydrol. Process., 23, 1844–1864, doi:10.1002/hyp, 2009.
Halliday, S., Skeffington, R., Wade, A., Bowes, M., Gozzard, E., Newman, J., Loewenthal, M., Palmer-Felgate, E., and Jarvie, H.: High-frequency water quality monitoring in an urban catchment: hydrochemical dynamics, primary production and implications for the Water Framework Directive, Hydrol. Process., 29, 3388– 3407, 2015.
Jasechko, S., Kirchner, J. W., Welker, J. M., and McDonnell, J. J.: Substantial proportion of global streamflow less than three months old, Nat. Geosci., 9, 126–130, 2016.
JCGM 200: International vocabulary of metrology – Basic and gen-eral concepts and associated terms (VIM), 2012.
Jordan, P. and Cassidy, R.: Technical Note: Assessing a 24/7 solution for monitoring water quality loads in small river catchments, Hydrol. Earth Syst. Sci., 15, 3093–3100, https://doi.org/10.5194/hess-15-3093-2011, 2011.
Kirchner, J. W., Feng, X., Neal, C., and Robson, A. J.: The fine structure of water-quality dynamics: the (high-frequency) wave of the future, Hydrol. Process., 18, 1353–1359, 2004.
Kirchner, J. W.: Getting the right answers for the right reasons: Linking measurements, analyses, and models to advance the sci-ence of hydrology, Water Resour. Res., 42, 1–5, 2006.
Kirchner, J. W., Feng, X., and Neal, C.: Fractal stream chemistry and its implications for contaminant transport in catchments, Na-ture, 403, 524–527, 2000.
Kirchner, J. W., Feng, X., and Neal, C.: Catchment-scale advection and dispersion as a mechanism for fractal scaling in stream tracer concentrations, J. Hydrol., 254, 81–100, 2001.
Kunz, A., Steinmetz, R., Damasceno, S., and Coldebela, A.: Nitro-gen removal from swine wastewater by combining treated efflu-ent with raw manure, Sci. Agric., 69, 352–356, 2012.
Kurz, M. J., de Montety, V., Martin, J. B., Cohen, M. J., and Foster, C. R.: Controls on diel metal cycles in a biologically productive carbonate-dominated river, Chem. Geol., 358, 61–74, 2013. Liu, Z., Liu, X., and Liao, C.: Daytime deposition and nighttime
dis-solution of calcium carbonate controlled by submerged plants in a karst spring-fed pool: insights from high time-resolution mon-itoring of physico-chemistry of water, Environ. Geol., 55, 1159– 1168, 2008.
Macintosh, K., Jordan, P., Cassidy, R., Arnscheidt, J., and Ward, C.: Low flow water quality in rivers, septic tank systems and high-resolution phosphorus signals, Sci. Total Environ., 412, 58–65, 2011.
Morel, B., Durand, P., Jaffrezic, A., Gruau, G., and Molenat, J.: Sources of dissolved organic carbon during storm flow in a head-water agricultural catchment, Hydrol. Process., 23, 2888–2901, 2009.
Neal, C., Watts, C., Williams, R. J., Neal, M., Hill, L., and Wick-ham, H.: Diurnal and longer term patterns in carbon dioxide and calcite saturation for the River Kennet, south-eastern England, Sci. Total Environ., 282, 205–231, 2002.
Neal, C., Reynolds, B., Rowland, P., Norris, D., Kirchner, J. W., Neal, M., Sleep, D., Lawlor, A., Woods, C., Thacker, S., Guyatt, H., Vincent, C., Hockenhull, K., Wickham, H., Harman, S., and Armstrong, L.: High-frequency water quality time series in pre-cipitation and streamflow: From fragmentary signals to scientific challenge, Sci. Total Environ., 434, 3–12, 2012.
Neal, C., Reynolds, B., Kirchner, J. W.., Rowland, P., Norris, D., Sleep, D., Lawlor, A., Woods, C., Thacker, S., Guyatt, H., Vin-cent, C., Lehto, K., Grant, S., Williams, J., Neal, M., Wickham, H., Harman, S., and Armstrong, L.: High- frequency precipita-tion and stream water quality time series from Plynlimon, Wales: an openly accessible data resource spanning the periodic table, Hydrol. Process., 27, 2531–2539, 2013.
Nimick, D. A., Cleasby, T. E., and McCleskey, R. B.: Seasonality of diel cycles of dissolved trace metal concentrations in a Rocky Mountain stream, Environ. Geol., 47, 603–614, 2005.
Nimick, D. A., Gammons, C. H., and Parker, S. R.: Diel biogeo-chemical processes and their effect on the aqueous chemistry of streams: A review, Chem. Geol., 283, 3–17, 2011.
Rode, M., Wade, A. J., Cohen, M. J., Hensley, R. T., Bowes, M. J., Kirchner, J. W., Arhonditsis, G. B., Jordan, P., Kronvang, B., Halliday, S. J., Ske, R. A., Rozemeijer, J. C., Aubert, A. H., and Rinke, K.: Sensors in the Stream?: The High-Frequency Wave of the Present, Environ. Sci. Technol., 50, 10297–10307, 2016.
Rozemeijer, J., van der Velde, Y., van Geer, F., Bierkens, M., and Broers, H.: Direct measurements of the tile drain and groundwa-ter flow route contributions to surface wagroundwa-ter contamination: From field-scale concentration patterns in groundwater to catchment-scale surface water quality, Environ. Pollut., 158, 3571–3579, 2010a.
Rozemeijer, J., van der Velde, Y., de Jonge, H., van Geer, F., Broers, H., Bierkens, M.: Application and Evaluation of a New Pas-sive Sampler for Measuring Average Solute Concentrations in a Catchment Scale Water Quality Monitoring Study, Environ. Sci. Technol., 44, 1353–1359, 2010b.
Rozemeijer, J., Klein, J., Broers, H., van Tol-Leenders, T., and van der Grift, B.: Water quality status and trends in agriculture-dominated headwaters, a national monitoring network for assess-ing the effectiveness of national and European manure legislation in The Netherlands, Environ. Monit. Assess., 186, 8981–8995, 2014.
Strobl, R. and Robillard, P.: Network design for water quality moni-toring of surface freshwaters: A review, J. Environ. Manage., 87, 639–648, 2008.
Takagi, M.: Water chemistry of headwater streams under storm flow conditions in catchments covered by evergreen broadleaved for-est and by coniferous plantation, Landscape Ecol. Eng., 11, 293– 302, 2015.
Telci, I., Nam, K., Guan, J., and Aral, M.: Optimal water quality monitoring network design for river systems, J. Environ. Man-age., 90, 2987–2998, 2009.
Tercier-Waeber, M., Hezard, T., Masson, M., and Schäfer, J.: In Situ Monitoring of the Diurnal Cycling of Dynamic Metal Species in a Stream under Contrasting Photobenthic Biofilm Activity and Hydrological Conditions, Environ. Sci. Technol., 43, 7237–7244, 2009.
von Freyberg, J., Studer, B., and Kirchner, J. W.: A lab in the field: high-frequency analysis of water quality and stable isotopes in stream water and precipitation, Hydrol. Earth Syst. Sci., 21, 1721–1739, https://doi.org/10.5194/hess-21-1721-2017, 2017. Whitehead, P., Wilby, R., Battarbee, R., Kerman, M., and Wade, A.:
A review of the potential impacts of climate change on surface water quality, Hydrolog. Sci. J., 54, 101–121, 2009.
Yang, W., Nan, J., and Sun, D.: An online water quality monitoring and management system developed for the Liming River basin in Daqing, China, J. Environ. Manage., 88, 318–325, 2008. Zabiegała, B., Kot-Wasik, A., Urbanowicz, M., and Namiesinik, J.:
Passive sampling as a tool for obtaining reliable analytical in-formation in environmental quality monitoring, Anal. Bioanal. Chem., 396, 273–296, 2010.
Zhu, X., Li, D., He, D., Wang, J., Ma, D., and Li, F.: A remote wireless system for water quality online monitoring in intensive fish culture, Comput. Electron. Agr., 71, 3–9, 2010.