DETERMINATION OF SHEAR WAVE VELOCITY AND ATTENUATION
FROM WAVEFORMS IN LOW VELOCITY FORMATIONS
by
M. Nafi Toksi5z, R.H. Wilkens and C.H. Cheng Earth Resources Laboratory
Department ofEarth,Atmospheric, and Planetary Sciences Massachusetts Institute of Technology
Cambridge, llA 02139
ABSTRACT
In boreholes where formation shear velocity is lower than borehole tluid velocity neither refracted shear waves nor pseudo-Rayleigh waves can propagate. When frequency response of the sonde does not extend to low frequencies (e.g. 2 kHz) Stoneley waves are not excited efficiently. In such cases refracted P, leaking modes (PL) and tluid waves become dominant phases on a full waveform acoustic log. The P wave velocity can be determined from the first arrivals. Then, using synthetic microseismograms and a waveform matching technique, formation shear wave velocity and attenuation can be determined. This method· is demonstrated using data from a well in the Baltimore Canyon Trough area of the Atlantic margin.
INTRODUCTION
The determination of shear wave velocity in "soft" formations where shear wave velocities are less than the fluid velocity in the. borehole is an important application of full waveform acoustic logs. The usual approach for low velocity formations has been to derive the shear velocity from the Stoneley wave phase velocities (Cheng and Toksi:iz, 1983; Barton et at., this report). Stoneley waves are efficiently excited by low-frequency sources. In a typical borehole with a diameter of eight inches, most commonly used logging tools do not excite Stone ley waves when the shear wave velocity is below the fluid velocity. Mathematically this can be demonstrated in terms of the eigenfunctions of the borehole-formation system (see Figure 3, Toksi:iz et at., 1983). Physically, as the formation shear wave velocity decreases, the phase velocity of the Stone ley wave, and hence its wavelength, decreases also. This implies that the amplitUde of the Stoneley wave falls off more rapidly away from the borehole boundary. As a result, a source at the center of the borehole cannot excite the Stone ley waves as efficiently as its wavelength decreases.
In this paper we demonstrate an approach with which both shear velocity and attenuation values may be obtained from the detailed analysis of the P wave train. We apply these to full waveform acoustic logging data obtained from a drill hole in the Baltimore Canyon region of the Atlantic Ocean.
194 TokBiiz etal.
FULL WAVEFORII LOGS IN LOW VELOCITY SEDIMENTS
(
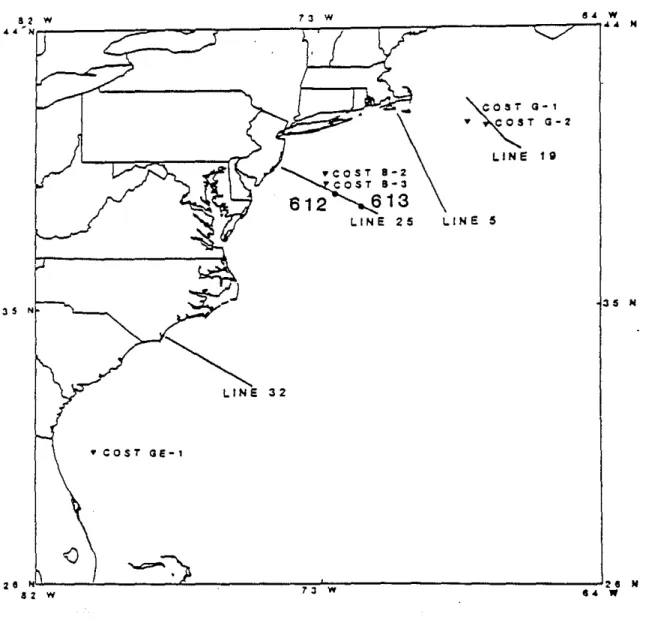
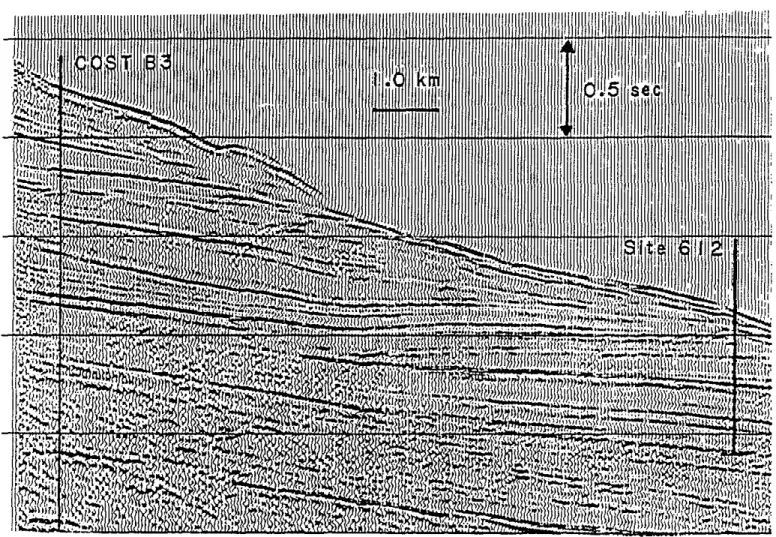
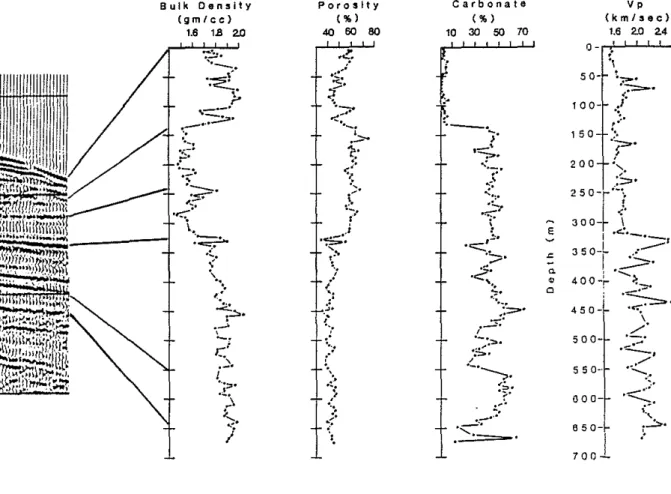
The data used in this study are from the Baltimore Canyon Trough, DSDP drilling Site 612 (Figure 1). The seismic section and the well location are shown in Figure 2. In addition to the logs, approximately 600 m of sediments were recovered at this site using the hydraulic piston corer (HPC) in the softer, unlithified sediments, and the extended core barrel (XCB) in the lower, more indurated sections. The stratigraphic column consists of an upper section of muds and glauconitic sands (135 m) overlying, on an erosional contact, a section of siliceous nannofossil oozes and chalks. At a very distinct level the biogenic silica in the sediments vanishes and is replaced by amorphous silica cement, creating a distinctive chalk-porcellanite unit. There is an excellent correlation between lithological units and the seismic retl.ectors (Figure 3).
At this time we have only a limited data set. The data was collected with the Schlumberger SLS-TA sonde. The Schlumberger logging tool has two sources and two receivers. The separation between the sources and between the receivers is 0.61 m (2
It),
with a distance of 2.44 m (8It)
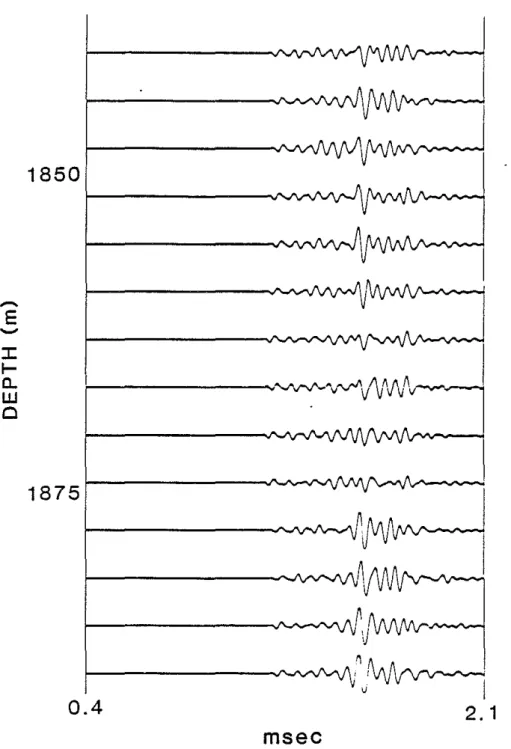
between the source and receiver arrays. Figure 4 shows typical full waveform acoustic logs. These sample traces are selected from actual data recorded at 60 em depth intervals, with source-receiver separation of 2.44 m (8It).
In this section of semiconsolidated oceanic sediments the P wave velocity is generally near 2.0km/sec or less. The shear wave velocities measured on recovered cores are generally about 1.0 km/sec, much less than water velocity. In such cases there are no refracted shear waves, nor pseudo-Rayleigh waves.
The full waveform logs show a clear beginning of P waves followed by a long train that indicates the presence of a number of phases. In this case the borehole wavegUide can propagate refracted P waves, leaky modes, tl.uid waves, and Stoneley waves.
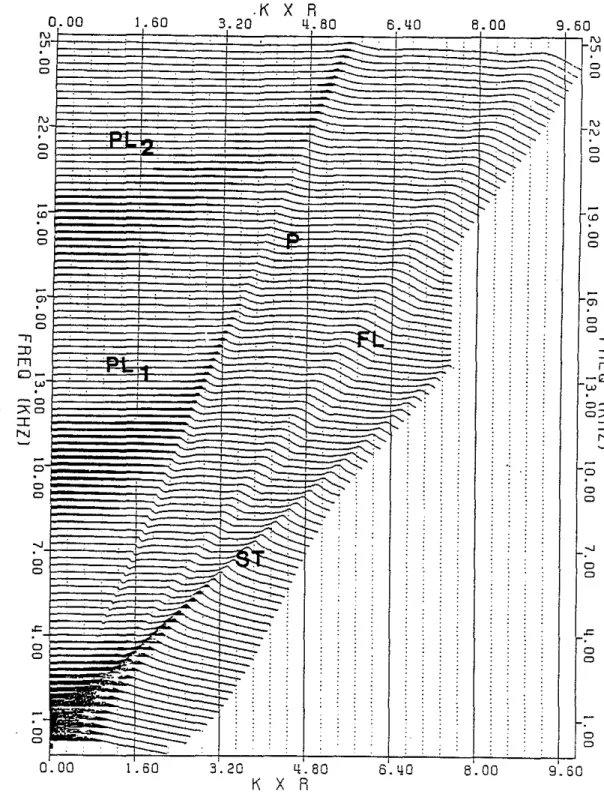
The Schlumberger logging tool used at this site has a peak frequency response between 10 kHz and 15kHz. In this frequency range the PL (Leaking p) modes are efficiently excited while Stoneley waves are not. The dispersions of these waves are best illustrated by the frequency wavenumber response of the borehole shown in Figure 5. This figure shows the refractedP wave (P), the tl.rst and second leaking PL modes (PLI ,PL2 ), borehole "tl.uid" mode (FL) and Stone ley wave (ST). With the peak frequency response of the logging tool between 10 kHz and 15 kHz we expect to see primarily the P, PL. and FL modes.
A synthetic microselsmogram calculated using formation velocities (Vp
=
2.0 km/ sec andV.
=
1.0 km/ sec) and logging tool properties similar tothose used in Site 612 is shown in Figure 6. P. PL and FL phases are indicated. The ST (Stone ley) phase is outside the time window because of its slow velocity
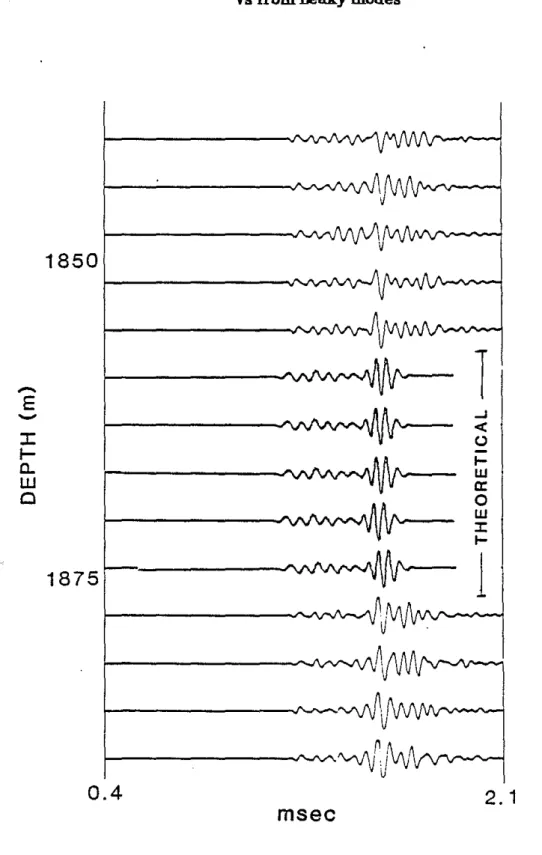
(VST'" 0.7 km/sec). The theoretical log is sirrular to the traces shown in Figure 1. This is demonstrated more clearly in Figure 7 where synthetic microscismograms are plotted with the observed data.
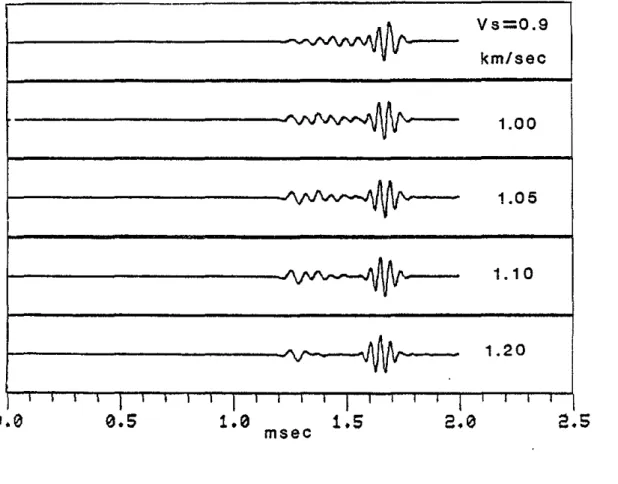
The amplitUdes of P and PL modes strongiy depend on the shear velocities of the formation. This is illustrated in Figure 8, where V. is varied systematically while all other parameters are held constant. Note that for lower formation shear wave velocity the PL mode becomes longer and more
( ( ( ( ( ( (
dominant. Even for very small changes in shear wave velocity, the change in wave train is obvious. Zhang and Cheng (1984), using contour integrals to generate synthetic P waves and PL modes, have found that the amplitude of the P wave packet depends strongly on the Poisson's ratio of the formation. This is due to the conversion of the P head wave into shear wave energy at the borehole boundary, as evidenced by the "snapshots," generated by the finite difference technique, of the propagating waves In the formation (Stephen and Pardo-Casas, 1984).
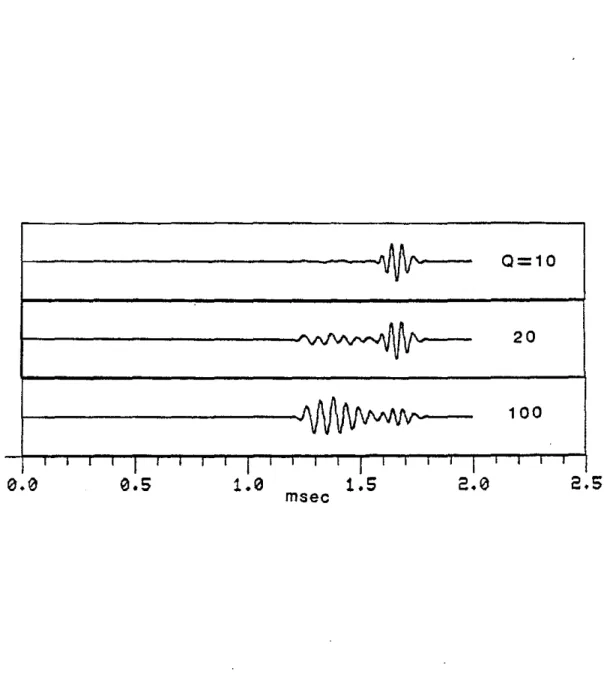
In Figure 9 we show the effects of the attenuation properties of the formation (Q", Q.) on the waveforms. Increasing formation attenuation decreases the amplitudes of P and PL waves, but does not affect the fiuid waves. The duration of the wave train is not affected. Based on these calculations, the parameters that best fit the observed data shown In Figure 4 are Vp =2.0 kml sec,
Yo
= 1.0 kml sec, Qp = Q. =20 for formation andQ/luw = 100 for borehole fluid.
DISCUSSION
This short paper is a simple demonstration of how to determine formation shear wave velocity and attenuation using waveform matching in a low shear velocity formation in the absence of Stoneley waves. Since only a limited amount of logging data are available at this time, no systematic Inversion was carried out. For routine applications a formal inver~ionalgorithm needs to be developed.
An unusual character of these logs not normally seen in typical data is the presence of a prominent fiuid arrival. This phase is generally attenuated by the drilling mud in typical cases where Q/ '" 15. However, when mud attenuation is low relative to formation attenuation, and when there are no Stone ley or pseudo-Rayleigh waves to mask it, a fluid arrival can be seen if the frequency response of the tool is high, The fiuid arrival can be an important phase for calibrating the relative amplitudes and determining the formation Q.
ACKNOWLEDGEMENT
This research was partially supported by the full waveform acoustic logging consortium. Roy Wilkens was supported by the Deep Sea Drilling Project during the cruise.
196 Toksoz etaL
REFERENCES
(
(
Barton, C.A.. Cheng C.H. and Toksiiz M.N., Determination of formation properties in a "slow" formation by the use of Stoneley Waves: in this volume.
Cheng, C.H. and M.N. Toksiiz, 1983, Determination of shear wave velocities in "slow" formations: Trans. SPWLA 24th Ann. Lagging symp., Paper V.
Stephen, R.A. and Pardo-Casas, F., 1984, Applications of finite difference synthetic acoustic logs: inthis volume.
Toksoz, M.N., Cheng C.H. and Willis M.E., 1983, Seismic waves in a borehole - a review: M.JT. Pull Waveform Acoustic Lagging Consortium Annual Report,
Paper 1.
Zhang, Jinzhong and Cheng, C.H., 1984, Numerical studies of body wave amplitudes in full waveform acoustic logs: in this volume.
( ( ( ( ( ( (
35 N
,.;:.
==-_"""~7""----..:,'r3:..,..:w7-,-_;:;;:r---,:::::_/,...·...,
..
~~
H~~~: G~
1 • ~T 13-2 ~INE 1~ ~INE 5 35 N~
LINE 32 .. COST GE-l , . NILl.-_ _...!- ~_ _ _ , . - - - -...~=_---...J,.•
42W 7:JW .~"Figure 1: Locations of DSDP Sites 612 and 613. The sites are located along the U.S.G.S. multichannel seismic line 25 and downslope from the COST B-2 and B-3 wells.
198 Toksilz etaL
USGS
Line
25
r,
Figure 2: A portion of U.S.G.S. line 25 indicatmg the location of the COST B-3 well and DSDP Site 612. Vertical scale is 2-way travel time.
(
(
Bulk Density (gm/ce) 1.6 t8 2.0 Porosity ( ") 40 60 80 Carbonate (
..
) 10 30 50 70 Vp (km/see) 1.6 2.0 2.4 550-' 000- 650-7001
s0- ~ .~."
100-'.
.l ,,~.
1 50- :~. j 200 ';.250/f'
300+ \ I·c:.;·-·_r 350-L..,--I
,...
.;>. 400-r- ::"~.~.
450-).
500- ' -..<.:::-,
...
/ ';~,.-'"
---:-,.
,.,
.~..'
E <>•
"
!.
'' . - .
"
.-;.
<.- ..
' ,-'.~.~
.-
,
,~. ."'=..~~.
'"
~~~.
/~. •.
~-:""-::O'. " .,
'-'---.". " .~. ?'..
, '.
.
~.;-...
Figure 3: A preliminary correlation between reflectors at Site 612 and physical properties measured onboard the Glomar Challenger. Depths are below seafloor.
200 Toksoz etal. (
...
E
J:f-a.
w
o
1850
( ( ( ( ( ,0.4
msec
~Vrwvvv-~..-1
,~.~
vI
2.1
(Figure .;,: Full waveform acoustic log traces (microseismograms) from Site 612. Source receiver separation is 2.44 m (8tt). Depth is below sea level.
0.00 f\) U1 o o f\) f\) o o <D o o o o
.,
:0 f"Tl 0 -U> - 0 ;>;0 :c N o o o o o 1.60 3.20 ll.80 4.80K X R
6.ll0 6.40 8.00 8.00 9.60 f\) U1::::-:>
S2 ~:-'-f\) f\) o o <D 0 0 f-;;; 0 0.,
:0 f"Tl 0 U> 0 -0;>; :c N 0 0 0 f-:--' 0 0 o o 9'.60Figure 5: Frequency wavenumber response of waves in a borehole drilled in low shear wave velocity (V.
<
Vf'uid) formation, K=
wavenumber, R=
borehole radius (10 cm), P=
refracted P waves, PLl , PL2=
leaking PL modes, FL =202 TokBoz etat
---p~_.
-( ( ( (0.5
msec
1.5
2.5
( (Figure 6: Theoretical full waveform acoustic log calculated using the method described in Toksoz et al. (1983). Parameters used
Ip
= 2km/sec,V.=1.0km/see,p=2.0g/ems, R
=
12.5 em, LIZ=
2.44 m (8 fl),1850
1
--
E
--
...J<
:::c
(,) l-I-e.
W UJa:
Cl 0 W J:I-1
1875
~---.I'-J'_~'
V
~----....J'.JV'\~.i~
u0.4
msec
2.1
Figure 7: Fuil waveform acoustic logs from Site 612 and their comparison with theoretical logs calculated using parameters given in Figure 6. Depth below se a level.
204 Toksoz etaL _ A _ •
-
Vs=0.9 vv'v km/sec~
1.00.
A.AI.
1.05 ·v'V IV
AIV'.A
1.10'V IV
-
.~
\ A 1.20 v'IV
IV 1 1 1 1I
' I II
I I I ,I
I I II
I I I I ( ( ( (0.0
0.5
1.0
msec1.5
2.0
(Figure B: Variation of full waveform acoustic logs with change in formation shear wave velocity. All other parameters are held constant, same as those in Flgure 6.
Q=10 20 100 I
0.0
0.5
1.0
msec1.5
2.13
2.5
Figure 9: Effects of formation attenuation parameters on full waveform logs. Ail parameters except formalin Q are the same as those in Figure 6. Q
206 ( ( ( ( ( ( (