Academic and Research Staff
M. E. Austin
A. B. Baggeroer
Prof. H. L. Van Trees Prof. D. L. Snyder Graduate Students L. D. Collins T. J. Cruise
R. R. Kurth
A. P. Tripp, Jr.
A. NONLINEAR MAP INTERVAL ESTIMATION
We shall consider two problems related to the equations specifying the nonlinear interval estimator. In the first part, we shall discuss a method for solving these equa-tions which involves the optimum nonlinear realizable filter. In the second part, we
shall present a technique for determining the optimum nonlinear realizable filter from the equations specifying the nonlinear interval estimator.
We shall assume that the following equations describe the system of interest:
dx(t)
dt -f(x(t),t) + g(x(t),t) u(t) nonlinear state equation
E[u(t)u (T)] = Q6(t-T)
E [x(T) ] = xO -0 initial condition assumption
E[(x(T -
-(T)
)T] =r(t) = s(x(t), t) + w(t)
E[w(t)wT(T)] = R6(t-T) For this system,vector x(t) are
dx(t)
= f(x(t), t) dt dp (t) afT x dt ax-wherenonlinear observation equation
T0 < t, T< Tf
the equations1,2 describing the MAP interval estimate of the state'
+ g(x(t), t) Qg (x(t), t) p(t) (7)
S p(t) + C~(t),t) R-1(r(t)-s(^(t),t)), (8) =
(t)-*This work was supported by the Joint Services Electronics Programs (U. S. Army,
U. S. Navy, and U. S. Air Force) under Contract DA 36-039-AMC-03200(E)).
(XIX. DETECTION AND ESTIMATION THEORY)
S(x(t), t)
s (x(t), t)
ax(t)
There is also a two-point boundary-value restriction on the equations. The boundary conditions are required to satisfy
-(To) - I = Pop(T ) (10)
p(Tf) = 0. (11)
The difficulty in solving these equations is the two-point boundary condition asso-ciated with the problem. We note that if we could obtain the value x(Tf), that is, the state estimate at the end point of the interval, we would have a complete set of boundary conditions at this time. We could then solve these equations backwards in time from this end point as if it were an initial or, more precisely, final-value problem. The estimate at the end point of the interval, however, is identical to the realizable filter estimate, since it involves only an operation upon past data, that is, the data before the end point time, T f. Therefore, one method that we propose for solving the nonlinear smoothing problem may be outlined as follows:
a. Determine a complete set of boundary conditions at the end point of the interval by obtaining the realizable filter estimate.
b. Solve the MAP interval estimation equations backwards in time from the end point of the observation interval, using this set of boundary conditions.
This method is not the only algorithm for solving the MAP estimation equations. Another technique is the method of quasi-linearization. With this technique, the
esti-mation equations are linearized around some a priori estimate of the solution. Then these linear equations are solved exactly, by use of the transition matrix associated with this system. This new solution provides the next estimate around which the nonlinear equations are linearized. This technique is repeated until a satisfactory con-vergence criterion has been satisfied.
The equivalence of the two methods has not been shown. It is suspected that in the high signal-to-noise case they produce identical estimates. In the low signal-to-noise
case, however, the quasi-linearization procedure is probably better. This is because the realizable filter estimate that we obtain is an approximate estimate. Probably, the best procedure is some combination of the two techniques.
We shall now present a derivation of the optimum nonlinear realizable filter by the use of the technique of invariant imbedding. Our derivation is a modified version of that given by Detchmendy and Shridar.3, 4
A fundamental difference between the interval estimator and the realizable filter is the time variable involved. In the interval estimator the important time variable is the time within the fixed observation interval, whereas in the realizable filter the important
time variable is the end-point time of the observation interval, which is not fixed but increases continually as the data are accumulated. For the realizable filter we want the estimate at the end point of the observation interval as a function of the length of the interval.
Let us now consider a more general class of solutions to the MAP equations. Instead of imposing the condition of Eq. 11, let us consider the class of solutions for the bound-ary condition
p(Tf) = T1. (12)
In general, the solution to Eq. 7 at the end point of the observation interval is now a function of the end-point time of the interval and the parameter r. Let us denote the solution to Eq. 7 at the end point of the interval by _(Tf, ), where we emphasize the dependence noted above. We also note that
j(Tf' ,1) = x(Tf) (13)
We now state that it can be shown that the function satisfies the following partial dif-ferential equation:4 aa(Tf, ) aa(Tf o)
T
+a
(, , Tf) = (, T , ), (14)8T f
8
f
where (, , Tf) = f( , T) g(, T )Tf)Qg+
(15)a fT
R-1 1T(,,Tf) -af (x, Tf) ' C (~,Tf) R-1 (r(Tf)-s(, Tf)). (16)For convenience of notation, let us define the term
K(x, r(T f), Tf) = C T(x, T f) R-1 (r(T f)-s(x, T )). (17)
We now try a solution to Eq. 14 of the form
_(Tf, 1) = ^(Tf) + P(Tf) _, (18)
where _(Tf) and P(Tf) are functions that are to be chosen appropriately. As indicated by the notation, the function is the desired estimate. We now substitute this trial solu-tion in the invariant imbedding equasolu-tion. Since we are interested in the solution when 1_ is small, we expand the functions around x(Tf). We want to consider terms to order
(XIX. DETECTION AND ESTIMATION THEORY)
r(_, _, Tf) =
afax
af
), T ) +
(x, T
(x, Tf) Ax=x(Tf)
f)
P (T f) x=x(T f) 8K - (x , r, T f) -i + g(x(Tf), Tf)x=x(T )
I
P(Tf) 'nIg(x(Tf), Tf)
(19)
A -K(x(Tf),r(Tf),
Tf).(20)
Substituting (19) and (20) in (14) yields
dx(T
dx(T f - f (f)
2 (Tf), Tf) + P(T) K((Tf),r(Tf), T dT fff
f f f) f' d)SdP(Tf)
af dT ax (x, T )f -
x=x(Tf)
aK - P(T ) x (x, r(T f), Tf)x=x(T f)
8f
P(T ) - P(T ) - (x, T ) f f ax f P(Tf) + g(x(Tf), Tf) QgT ((Tf), T f) +We require that the functions x(T f) and P(T f) be so chosen that the terms within the first and second braces of Eq. 21 vanish identically.
invariant imbedding equation to O(IT12 ). The term
This specifies the solution to the within the first brace specifies the
estimation equation.
This is given by
dx(Tf)
d
f((T ), T )- P(Tf) C T ^ (x(T ), T ) R - (r(T )-s(x(T ), T). (22)dTf
f
f
f
f
f
f
f
f
The term within the second brace specifies part of the dynamics of the estimation
equa-tion. This is given by
dP(T f) dT f
af
S(x, Tf) ax f x=x(T f)aK
-P(Tf) --a
T
af P (Tf) + P(Tf) (x, Tf) - x=x(Tf)x=x(T f)
ST(,A TP(T ) + g(x(T ), T ) Qg (x(T ), T ),
(23)
where (see Eq. 17)
K(x:r, Tf)
=C T(x, Tf) R-
(Tf)-S(x, T)).
The initial conditions to these differential equations are found by setting Tf equal to T
oand using Eq. 10.
This gives
x=x(Tf)
2
O(ri
)
=0.
(21) 0(_, , Tf) ~ f(x(T (x, r, (Tf), Tf)Ax(T = (24)
o
-o
P(To) = P . (25)
Equations 22 and 23 are identical to those derived by Snyder by approximating the 5
solution to the Fokker-Planck equation describing the a posteriori density. We note that we obtain the same result - that the optimum nonlinear realizable filter may not be equivalent to successively linearizing the system under consideration and then applying the Kalman-Bucy filtering equations.6 We also note that our solution is an approximate
one because we only approximated the solution to the invariant imbedding equation. A. B. Baggeroer
References
1. A. E. Bryson and M. Frazier, "Smoothing for Linear and Non-Linear Dynamic
Sys-tems," Proc. Optimum Synthesis Conference, Wright-Patterson Air Force Base, Ohio, September 1962.
2. A. Baggeroer, "Maximum a posteriori Interval Estimation," WESCON/66 Technical Papers, Paper 7/3, August 23-26, 1966.
3. R. Bellman, Invariant Imbedding (Academic Press, New York, 1964).
4. D. Detchmendy and R. Shridar, "Sequential Estimation of States and Parameters in Noisy Nonlinear Dynamical Systems," ASME J. Basic Engineering, Vol. 88, pp. 362-368, June 1966.
5. D. Snyder, "A Theory of Continuous Nonlinear Recursive-Filtering with Application to Optimum Analog Demodulation," WESCON/66 Technical Papers, Paper 7/2, August 23-26, 1966.
6. R. E. Kalman and R. Bucy, "New Results in Linear Filtering and Prediction Theory," ASME J. Basic Engineering, Vol. 83, pp. 95-108, March 1961.
B. PERFORMANCE BOUNDS FOR OPTIMUM DETECTION FOR GAUSSIAN SIGNALS
In this report, we shall apply the technique of tilted probability distributions to the problem of evaluating the performance of optimum detector for Gaussian signals received in additive Gaussian noise.
Stated in mathematical terms, we shall consider the following binary detection prob-lem.
H1: r(t) = sr (t) + m(t) + ml (t)
0 < t T (1)
H2: r(t) = r (t) + m2(t) +w(t)
(XIX. DETECTION AND ESTIMATION THEORY)
processes with known covariance functions Ki (t, T) and K2(t, T), respectively; m l (t) and
m2(t) are known waveforms, w(t), in a sample function of white Gaussian noise of
spec-N
o
tral density 20
Since the optimum detector for such problems is well known, - 3
we shall not dwell upon it here. It suffices to indicate that for a large class of performance criteria, the
detector bases its decision on the likelihood ratio, or some monotone function of the likelihood ratio. This is the class of detectors with which we shall be concerned.
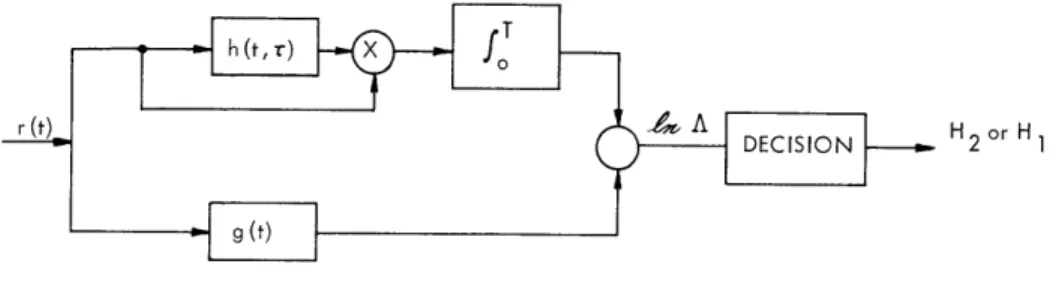
One structure for the optimum detector is shown in Fig. XIX-1. A direct evaluation
r (0
X fo A DECISION H2 or H1Fig. XIX-1. Optimum receiver structure.
of the error probabilities is conceptually possible, but practically it is extremely dif-ficult, for we are faced with the problem of computing the probability distribution at the
output of a time-variant nonlinear filter. It is this motivation that has led us to consider alternative methods of performance evaluation.
One alternative which is widely used is the output signal-to-noise ratio,4
which is valid in the so-called low-energy coherence, or threshold, case. One can show by a simple example that this performance measure can give incorrect results in some prob-lems of interest, and therefore it must be applied with caution.
In an attempt to overcome the computational difficulties associated with an exact computation of error probabilities, while at the same time having a performance mea-sure that is of wider applicability than the output signal-to-noise ratio, we have been investigating bounds on error probabilities, and, in particular, we have been seeking bounds that become asymptotically exact as the transmitted signal energy becomes large.
1. Tilted Probability Distribution
The technique that we employ is usually called "tilting" of probability distributions. It was introduced into information and coding theory by Shannon,5'
6 and has been employed with great success. Earlier applications in the field of mathematical stat-istics are due to Chernoff7
here, before proceeding to our specific problem.
All of our results center around the semi-invariant moment-generating function v(s),
which is merely the logarithm of the conditional characteristic function MIH1
(S)
S(s)
In
MI H1(S)
s
1-s
=
In
prH
2(R) pr H
1(R) dR,
(2)
where pr Hi(R) denotes the probability density for the received vector
r,
conditioned
on the hypothesis
Hi,
i
=
1,
2.
It can be readily shown that
S'(s) =
prs(R) k(R) dR
(3)
p"(s)=
p
rs(R)
k
2(R) dR -
['(s)]
2 ,(4)
which are the mean and variance of e(r) with respect to the probability density
1-s
s
A
Pr:
I
H
1(R)
pr IH
2(R)
pr
(R)
=S
S
S
prH (R') prIH2')d
l-s
s
=
exp[-±(s)] Pr[H
1(R) Pr H
2(R).
(5)
We shall refer to Pr
(R)
as the "tilted" density. The amount of "tilting" depends on the
value of the parameter s.
It follows from our definition that
pr IH
1(R) = prs(R) exp[p(s)-sk(R)]
(6)
pr H
2(R)
= pr
s(R) exp[p.(s)+(1-s)f(R)].
(7)
Hence the error probabilities may be expressed in terms of u(s) and the tilted density
prs(R)
Pr [QH
1]=
5
prHI(R
)dR
(R: (R)
>
y)
=
p(L) exp[u(s)-sL] dL
(8)
(XIX. DETECTION AND ESTIMATION THEORY)
Pr ['H 2] prIH 2(R) dR
(R:
(R)
<
y)
=
Pp (L)
exp[±(s)+(l-s)L] dL,
(9)
--o0 S
where y denotes the threshold level, and pp (L) is the tilted probability density for the
log-likelihood ratio corresponding to the nonlinear transformation
2
s=
L(rs).
A simple, well-known upper bound that follows immediately from Eqs. 8 and 9 is
the Chernoff bound. For example, if in (7) we bound
e
- s Lby
e
- s,
then bound
Spf
(L) dL by unity, we obtain the following upper bounds:
Pr [ jH
1]
<
exp[ (s)-sy]
(10)
Pr
[e
H
2]
<
exp[p.(s)+(l-s)y].
(11)
Then we can minimize the bound by proper choice of the parameter s. This choice
is the solution to
p'(s)
= y. (12)A solution exists and is unique, provided the threshold y lies between the means of the
conditional densities p JH1(L) and
pIH
(L).
This condition is usually satisfied in the
applications. An important step in our work consists in finding tighter bounds than
Eqs. 10 and 11.
After all, the arguments leading to these bounds were rather crude,
and while the exponential behavior exhibited in Eqs. 10 and 11 is adequate for many
applications, particularly in information and coding theory, we would like to retain the
algebraic dependence for our applications to radar, sonar, and uncoded communication
systems. A bound of a particularly attractive form is
exp[ (s)-sj'(s)]
Pr [JH
1]
r
(13)
exp[ (s)+(l-s)'(s)](1 Pr [ H2] < (14) 2w(l-s)2 1"(s) where '(s) = y.For large values of transmitted energy, this bound is considerably tighter than the
Chernoff bound, although at the other extreme the Chernoff bound is tighter. Clearly,
the bound that should be used in a given situation is the one that is the tightest.
generality to take care of all problems of interest to us. In the sequel, when we discuss
the application of these bounding techniques to the Gaussian problem, we shall discuss
some preliminary results in this direction.
2.
Application to the Gauss-in-Gauss Problem
We shall specialize the bounding techniques to the case in which the received vectors
have Gaussian conditional probability densities with statistically independent components.
Then, by interpreting the components of these vectors as coordinates in a
Karhunen-Lobve expansion, we shall generalize our results to the case in which the received
sig-nals are sample functions from random processes: that is, they are infinite
dimen-sional.
The present problem is the evaluation of 4(s). We assume that on hypothesis
H.,
j
=
1, 2, r is an N component Gaussian vector with
J E[ri] = mij (15)
N
V [ri]
=ij
+zo
(16)
E[rirk] = mijmkj,
k
*
i
fori,k=
1,2,...,N
j
=1,2
(17)
Substituting the N-dimensional Gaussian densities in the definition of u(s), we find
s In 1
+
+ (1-s) In + i2) - In (sXil+(l-s)ki2)+ 1t(s) =
T
(m
il
m i
2i= 1
N
N
il
+2
i2
+ 2
l-s
s
0
< s
<1.
(18)
Equation 18 is now in a very convenient form to let N
--
co.
This limiting operation is
frequently used in detection and estimation theory, so we need not worry about its
jus-tification here.
Furthermore, the infinite series which results is convergent in all cases
of interest to us. It then remains to interpret the various terms as closed-form
expres-sions involving the (conditional) mean and covariance functions of the random process
r(t), for (17) is not at all convenient from a computational point of view for the case
N -
oo.
To illustrate the manner in which we find a closed-form expression for Eq. 18,
(XIX. DETECTION AND ESTIMATION THEORY)
consider the first term in the series,
-
in 1 + 2.il
i= 1Now, for the moment, we wish to focus on a related problem; namely that of
esti-mating the zero-mean Gaussian random process s r(t) when observed in additive white
Gaussian noise of spectral height N /2.
A O
Let s rl(t) denote the minimum mean-square-error point estimate of s rl(t). The
resulting mean-square error is
1(t:
-
=E
r(t)
-s (t) )2],
(19)
where we have explicitly included the noise level as a parameter. Furthermore, we
explicitly indicate the dependence of the Karhunen-Lobve eigenvalues and eigenfunctions
on the length of the interval:
il(T) i (t:T) = Kl(t, T) di(T) dT. (20)
Then,
00In
1( +Nl
2XIn
+i=
1
o
= dt IIn 1 + 0/
0 i= I oo=
dt
N il(t)
(t:t).
(21)
i= 1
+
i l(t)
In Eq. 21, we have used the result of Huang and Johnson
9axil (t)
Skil)
(t:t).(22)
i= 1
s=
s
-
(
1:
-) dt.
(23)
2 N o 2
Similar results hold for the other terms in Eq. 18. The final closed-form expres-sion for
4(s)
is T NT
(s) =
-2-
i +
2:
-,
dt
o
0
2
s(l-s)CT
T
-2
ml(t)
- m2 (t) - hl+2(t, T:s)[ml(T)-m 2(T)] h1 dt (24)The terms in Eq. 24 that have not been previously defined are the following. 1+2
t:
2, s) is the minimum mean-square point estimation error for estimating the fictitious random process sl+2(t), which is defined bys l+ (t) = ssrl(t) + (1-s) sr (t)
0 < s < 1.
(25)
It is easy to see that this fictitious random process plays the same role as the tilted random vector r in the finite-dimensional case. hl+2(t, T:s) denotes the minimum
-s
+
mean-square point estimator of s1+2(t). The important computational advantage of
Eq. 24, as compared with Eq. 18, stems from the availability of techniques for effi-ciently solving linear estimation problems. In particular, the Kalman-Bucy formula-tion1 0 of the estimation problem provides us with a direct approach for calculating the pertinent estimation errors. Furthermore, this approach to the problem is readily implemented on a digital computer, which is an important practical advantage.
We have briefly mentioned the need for a bound that would be tighter than the Chernoff bound. We shall now indicate some results in this direction, when we make use of our Gaussian assumption.
A straightforward substitution of the appropriate Gaussian densities in Eq. 5 shows that the tilted density prs(R) is also a Gaussian probability density. Therefore, the tilted random variable fs is a "generalized Chi-square" random variable, that is, it is the sum of the square of Gaussian random variables which have nonzero means and unequal variances.
(XIX. DETECTION AND ESTIMATION THEORY)
In the special case for which all variances are the same, the means are all zero, and the number of components, N, is finite, ks has a Chi-squared distribution, and we
have an analytic expression for the probability density p, (L). This enables us to
rig-s
orously derive the following bounds by using a very simple argument.
Pr[
< (2s
2p"(s)
-
-/2
exp[ L(s)-sp'(s)]
(26)
p
[
2-1/2
rP[ IH2] < (2r(1-s)2p"(s) 1
--
)) exp[Il(s)+(1-s)pl'(s)] for N > 2 (27)Observe that these are in the form of (12) and (13) and, in fact, for moderate values of -1/2
N the factor ( - 1.
Another special case of more interest to us occurs when the variances of the various components are all distinct, but occur in pairs, as is always the case for a signal trans-mitted at RF through some physical channel. In this case, we can obtain an expression for the probability density p, (L). We have shown that this density has only one
max-s
imum. Furthermore, in each of a large number of cases treated numerically, the maximum value was not found to differ appreciably from that for a Gaussian density having the same variance, namely (2
1T"(s))- 1/2 Furthermore, various methods of asymptotically approximating the integrals in Eqs. 8 and 9 lead to this same dependence for the dominant behavior as i"(s) becomes large.
Therefore, we feel confident that for the Gaussian detection problem that we have been discussing, the expressions in Eqs. 13 and 14 provide good approximations for the error probabilities.
3. Examples
We shall give a few simple examples illustrating the application of the techniques just discussed. We shall choose one example from each of the three levels of detection
problems: known signal, signal with a finite number of random parameters, and ran-dom signal.
EXAMPLE 1: Known Signal HI: r(t) = m l (t) + nc(t) + w(t)
0
~< t < T (28)H2: r(t) = m2(t) + nc(t) + w(t)
Here the random "signal" components nc(t) are identical and represent the colored com-ponent of the noise. Substituting in Eq. 24 (or 18), we find
s(l-s) 2
where
(E (kI H1)-E( I Ho)) 2
N/Var (-I H1) Var (jH 0o)
=
m
l(t) - m
2(t) -
l+2(t,
0
L
01+2Here, hl+2(t, T) is independent of s, since
sl+2 (t) = srl(t) = r (t) = nc(t).
And, as a matter of fact,
2
T) [MlI(T) -M2 (T) ] dT (30)
(31)
(32) 6(t-T) - h1+2(t, T) = h (t, T),
which is a realizable whitening filter for this problem. 1 3 Thus Eq. 30 is equivalent to the more familiar form
62 ST 0
T
[ml(t)-m 2(t)]Qn(t,
T)[ml(T)-m 2(T)] dtdT (33 00p'(s)
= d2 (s1)=
Y.Z/ Y
(34)
Hence we can solve explicitly for s in this case, and we obtain the bounds
Pr [S H
11
2 exp
-
+
Pr [oIH ] 1
~
1 2exp[
(1
d2)].2rd27)
These are exactly the same results that we would obtain
boundx0
x
1
e-y
2/2 dT
NJeTIdT<using
(35)
(36)
the familiar
1
ex
2/2
(37)
4
x
in the exact error expression for this problem.
(XIX. DETECTION AND ESTIMATION THEORY)
EXAMPLE 2: Slow Rayleigh Fading with Diversity
This is another case in which analytical results are available for comparison
pur-11
poses.
One of two orthogonal signals, s (t) or s2 (t), is received in additive white Gaussian
noise after transmission through a fading channel in which the signal undergoes a ran-dom attenuation and phase shift. The attenuation is a Rayleigh ranran-dom variable, and the phase shift is uniform 0 < 0 < 2w. We assume that there are N such channels operating in space, time, or frequency diversity. We also assume that the average received energy is the same in each channel on either hypothesis. Substitution in (17) yields
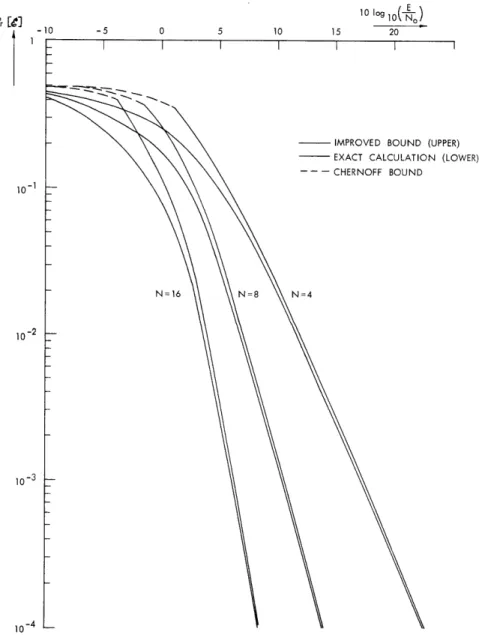
1 0 10-1 10- 2 10 log o O) -5 0 5 10 15 20 N=16
- IMPROVED BOUND (UPPER) - EXACT CALCULATION (LOWER) -- - CHERNOFF BOUND
N=4
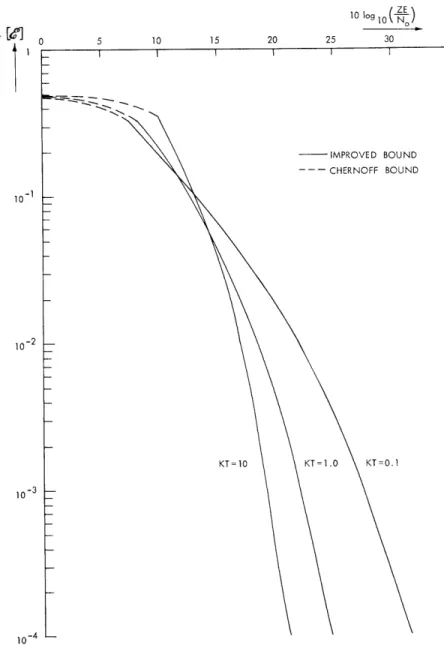
5 10 15 20 25 30 I I I I I - IMPROVED BOUND --- CHERNOFF BOUND KT=10 KT=O0.I 10-4 1
Fig. XIX-3. Upper bounds on error probability for single-pole Rayleigh fading.
Pr
[
(XIX. DETECTION AND ESTIMATION THEORY)
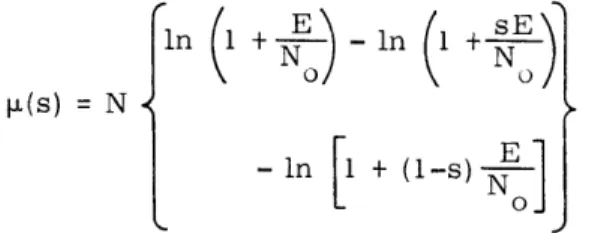
in 1 +-o - In (I + sE
t =(s) =
{
N (38)where E is the average received signal energy in each diversity channel. Figure XIX-2 shows the bound
Pr [e] 1 exp p ,) (39)
as well as the exact results for several values of N.
EXAMPLE 3: Rayleigh Fading, Single-Pole Spectrum
This simple example illustrates the application of our results to a problem for which it would be extremely difficult to obtain error probabilities in any other manner. The model is the same as that of the previous case, except that, now the channel attenua-tion is a sample funcattenua-tion from a random process.
For purposes of illustration, we assume only one Rayleigh channel (that is, no explicit diversity) and a single-pole spectrum for the fading.
The upper bound on the probability of error is shown in Fig. XIX-3. To our knowl-edge, no other calculations are available for comparison. It is interesting to observe that this optimum receiver does not exhibit the irreducible error probability of one sub-optimum receiver that has been analyzed. 1 2
4. Summary
We have discussed the application of tilted probability distributions to the evaluation of the performance of optimum detectors for Gaussian signals in Gaussian noise. Two main points were covered: (i) obtaining bounds that are tighter than the Chernoff bound and ones that are asymptotically exact; (ii) obtaining closed-form expressions for i±(s) in terms of minimum mean-square estimation errors, which may be readily computed by using Kalman-Bucy filtering techniques. We concluded with three simple examples.
L. D. Collins References
1. C. W. Helstrom, Statistical Theory of Signal Detection (Macmillan Company, New York, 1960).
2. H. L. Van Trees, Detection and Estimation Theory (John Wiley and Sons, Inc., New York, 1967).
3. R. Price, "Optimum Detection of Random Signals in Noise with Application to Scatter-Multipath Communication, I," IRE Trans. , Vol. IT-2, pp. 125-135 (December 1956).
4. R. Price, "Output to-Noise Ratio as a Criterion in Spread-Channel Signal-ling," Technical Report 388, Lincoln Laboratory, M.I.T., May 13, 1965.
5. C. E. Shannon, "Notes for Seminar on Information Theory at M. I. T. ," 1956 (unpub-lished).
6. R. Fano, Transmission of Information (The M. I. T. Press, Cambridge, Mass., 1961).
7. H. Chernoff, "A Measure of Asymptotic Efficiency for Tests of a Hypothesis Based on a Sum of Observations," Ann. Math. Stat. 23, 493-509 (1952).
8. F. Esscher, "On the Probability Function in the Collective Theory of Risk," Skan-dinavisk Akluarietidskrift, Vol. 15, pp. 175-195, 1932.
9. R. Y. Huang and R. A. Johnson, "Information Transmission with Time-Continuous Random Processes," IEEE Transactions, Vol. IT-9, No. 2, pp. 84-95, April, 1963. 10. R. E. Kalman and R. S. Bucy, "New Results in Linear Filtering and Prediction
Theory," Trans. ASME, Journal of Basic Engineering, pp. 95-108, March, 1961.
11. J. N. Pierce, "Theoretical Diversity Improvement in Frequency-Shift Keying," Proc. IRE 46, 903-910 (1958).
12. P. A. Bello and B. Nelin, "The Influence of Fading Spectrum on the Binary Error Probabilities of Noncoherent and Coherent Matched Filter Receivers," IRE Trans., Vol. CS-1, No. 1, pp. 160-168, June, 1962.
13. L. D. Collins, "Realizable Whitening Filters," Internal Memorandum IM-LDC-5, Research Laboratory of Electronics, M. I. T. , April 1, 1966 (unpublished).