HAL Id: hal-03150446
https://hal.inria.fr/hal-03150446
Preprint submitted on 23 Feb 2021
HAL is a multi-disciplinary open access
archive for the deposit and dissemination of
sci-entific research documents, whether they are
pub-lished or not. The documents may come from
L’archive ouverte pluridisciplinaire HAL, est
destinée au dépôt et à la diffusion de documents
scientifiques de niveau recherche, publiés ou non,
émanant des établissements d’enseignement et de
Are Search Engines Biased? Detecting and Reducing
Bias using Meta Search Engines
Patrick Maillé, Gwen Maudet, Mathieu Simon, Bruno Tuffin
To cite this version:
Patrick Maillé, Gwen Maudet, Mathieu Simon, Bruno Tuffin. Are Search Engines Biased? Detecting
and Reducing Bias using Meta Search Engines. 2021. �hal-03150446�
Are Search Engines Biased? Detecting and
Reducing Bias using Meta Search Engines
Patrick Maill´
e, Gwen Maudet
IMT Atlantique, IRISA, UBL
F-35576 Rennes,France
Mathieu Simon, Bruno Tuffin
Inria, Univ Rennes, CNRS, IRISA
Rennes, France
February 23, 2021
Abstract
The search neutrality debate stems from content or service providers complaining about being discriminated and therefore losing market shares due to an unfairly low ranking given by search engines. Those questions stress the need for methodologies and tools to verify bias in search engine rankings and analyze their potential impact. We develop in this paper a simple yet effective framework comparing the results of existing search en-gines. We present statistical tests based on outlier detection pointing out potential biases, and introduce two meta engines aiming at reducing bias. All this is implemented in a publicly-available tool from which extensive comparisons and bias investigations are carried out.
1
Introduction
When we want to reach some content, information or tool on our smartphone, tablet or laptop, and do not know exactly what to look for and where to get it, we usually use a search engine (SE), that responds to typed-in keywords with a ranked list of links to the supposed most relevant corresponding places. Google is the most used SE worldwide, but many others exist such as Bing, Yahoo, Duck-duckgo, Qwant, or Startpage. For a more comprehensive list, see for example https://en.wikipedia.org/wiki/List_of_search_engines. Search engines propositions have a huge influence on our daily life, since users have a tendency to click on one of the first proposed links, and search engines are extensively used: Google alone registers in a year about 2 trillions searches all over the world1.
1
https://searchengineland.com/google\%2Dnow\%2Dhandles\%2D2\%2D999\ %2Dtrillion\%2Dsearches\%2Dper\%2Dyear\%2D250247
But SEs are accused of voluntarily lowering some links in their rankings, hence reducing the visibility, access, and revenue of the corresponding actors, or of boosting other links the SEs are closely or financially related to2. While SEs are making money thanks to sponsored links, that are displayed links clearly pre-sented as advertisements corresponding to the search keywords and sold through auctions [20, 22], we are talking here about organic links, representing the con-sidered most relevant responses to the dialed keywords. This issue of biasing the results was brought in 2009 by Adam Raff, co-founder of the price-comparison company Foundem, saying that Google was voluntarily penalizing his company in rankings with respect to Google’s own services. Any SE could indeed in theory choose which company to promote or to demote with financial motiva-tions; such an optimal strategy was computed in [16], as a trade-off between short-term and long-term revenues; other models can be found in [30].
This has led to the so-called and still vivid search neutrality debate, asking whether SEs should be neutral in their organic rankings–i.e., base their rankings on relevance only–and if so, how that can be monitored [12,19,23,28]. The issue is related to the sensitive Net neutrality debate [6,17,21,26,37], active for almost 20 years, asking whether Internet Service Providers (ISPs) should be allowed to differentiate service at the packet level within the network to get some return on their infrastructure investment. A higher quality of service would be paid by content providers, but this raised concerns regarding the impact on innovation, freedom of speech (if some content can be blocked), etc. The basic definition of Net neutrality, even if it depends on countries, is that ISPs should treat equally all content flowing through their networks, regardless of its kind, source, or destination. But if the key issue is access and impact on innovation, shouldn’t SEs be part of the equation? Indeed, similarly to ISPs, search engines have a gatekeeper position and can significantly distort the competition among actors on the Internet.
There is reluctance to accept the search neutrality debate in the same way as the Net neutrality debate. First, the nature of an SE is often argued to allow to make various and sometimes new/surprising propositions to open-minded users; but why helping some quality-demanding applications should correspondingly be forbidden by ISPs? Second, it is often advocated that if you are not happy with an SE, switching to another is just “one click away”. But it might not be easy to detect biases and switch SEs when unfairness is just for a limited num-ber of keywords, and the SE market is not as competitive as it seems, with as of June 20203Google concentrating 91.75% of worldwide searches, the followers
being Bing (2.75%), Yahoo (1.7%), Baidu (1.02%), Yandex (0.92%), and Duck-DuckGo (0.49%). Finally, it is often thought that defining a neutral behavior is simple for an ISP but not for an SE. But defining packet-level neutrality as “equal treatment at nodes of the network” does not encompass differences at the flow level, which could for example come from different round-trip times when using TCP (dependent on distance), a possible discrimination, and does not deal
2See for example https://www.technologyreview.com/s/610275/meet\%2Dthe\%2Dwoman\%2Dwho\ %2Dsearches\%2Dout\%2Dsearch\%2Dengines\%2Dbias\%2Dagainst\%2Dwomen\%2Dand\%2Dminorities/
with activities such as content delivery networks [21]. For SEs, addressing the neutrality debate also means introducing a definition of a neutral behavior in a clear and objective manner. A fair way would be to rank according to relevance to keywords, but the notion of relevance is difficult to define, subjective, since potentially very user-dependent. Personalization of SE ranking, using location or cookies, refines but also complicates the notion. A “solution” could be to ask SEs to be transparent about the used algorithms to check whether voluntary discrimination is implemented, an approach more and more pushed by (Euro-pean) regulators4, but which induces secret/copyright issues and is out of the
scope of the present paper.
Defining relevance is a very sensitive and complicated issue, the considered definition being revealed by SEs or not. The PageRank method [27] developed by Google is an example of such an algorithmic definition, basically ranking pages based on their incoming links (backlinks), but is computationally de-manding. We will take a simpler alternative here, by making use of already ex-isting ranking systems by SEs (hence no computationally-demanding algorithm to add): we will define the relevance of a page/link as the average visibility of its positions among SEs. Given some visibility values of the different positions (e.g., estimated from measurements on the click behavior of users), that metric is simple to compute, and smooths potential irregularities by SEs. The issue of fairness in rankings has also been addressed in [5, 11] but not with the notion of visibility and click-through-rates which specifically concerns search results.
There exist many works on search non-neutrality, with sometimes different conclusions. Mowshowitz and Kawaguchi [25] use an own-defined measure of similarity between SE results, and show that there are significant differences, particularly sensitive to the subject domain but not the search terms in a given domain. The same authors claim similarly to us that “A family of comparable search engines can be used to approximate the ideal or fair distribution of items retrieved for a set of queries” [24], but they do not provide statistical tests to detect bias, and instead use a notion of dissimilarity not involving any interpre-tation in terms of visibility. A comparison and illustration of differences among SEs is discussed in [33], trying to determine the possible causes. Another nice reference on ranked list comparison is [35], particularly interesting when com-paring truncated lists with partly different elements; see also [29]. [36] analyses how own content by Bing or Google is ranked first more than on competing engines to highlight a general bias. Our work can also be linked with the study of political bias and the role of search engines in elections [15, 32], but the latter involves different measures related to personalization. Evaluating the perfor-mance of SEs (information retrieval) is another related topic [18], the score we define being original in this respect, as it requires no human but is based on the assumption that SEs point out to the right links on average.
The purpose of this paper is multifold. Our contributions, and the differences with respect to the literature can be decomposed as follows.
1. We formalize a definition of visibility which will be used to rank pages
(links). The score of a page will be the average displayed interest/visibility of the positions obtained by that page at SEs. In this sense the score is applying a weighted Borda rule [7, 38]. As a consequence, we are also able to compute a score for each SE, by summing the scores of the presented pages/links weighted by their positions. We can then easily compare SEs for a given keyword and for a population of keywords.
2. We develop a statistical methodology to identify potential bias based on Dixon’s Q test. The proposed tests are more precisely: i) Looking at scores of SEs for a keyword, an excessively low score being suspect since it indicates a ranking very different from other SEs. ii) Investigating whether the highest-ranked link of a SE is ranked as high by others. iii) Looking at the rankings of the most consensual link and checking whether that link is ranked abnormally low by some SEs. We are not aware of any other work using a similar statistical testing procedure to detect search engine bias.
3. We propose two meta-engines. The first one, called consensus SE, ranks links according to the weighted Borda scores (average visibility among SEs) obtained above. The second one is following the majority judgment rule defined in [2] for votes and adapted to our context. Voters are SEs voting for pages as candidates. Pages are ranked according to the median of votes, that is the rank for which 50% or more of the SEs give at least this rank. This ranking is expected to erase bias more than the consen-sus SE and we provide a theoretical framework to illustrate it through simulations. Aggregating search results to get a meta-engine is not new (see [11]), but our two aggregation techniques (weighted Borda or majority judgment) have not been implemented so far to our knowledge.
4. We present a publicly-available platform/web page https://snide.irisa. fr/ on which a keyword can be composed, the results of 15 engines plus the two meta engines are displayed, and potential bias are pointed out, if detected by statistical tests.
5. We provide results of bias on searches through statistics of failed tests for each SE, and give illustrative examples.
6. We compare the meta-engines in terms of average scores, highlight how they smooth bias, and provide statistics on their performance.
7. Thanks to extensive studies on campaigns of most dialed keywords, we compare the results of all SEs (not only our meta-engines, but also the “regular” ones). We are able to compute and compare expected scores over searches, but also their distributions, in order to see similarities, highlight if they use close algorithms, and compute the frequencies of potential bias to emphasize how often they can be trusted. Again, comparing ranking algorithms has already been done in the literature, see [4, 11, 25, 35], with methods mostly coming from models related to voting systems. An ex-ample is to use the Kendall distance, looking at the pairwise ordering
disagreement between lists. But those methods do not take into account the weights associated to CTRs of positions and their economic impact, nor do they compute distributions of scores and bias.
The paper is an extension of a conference paper where preliminary results were presented [14]. While the principle of using visibility as a page score and the consensus search engine were already introduced, the additional results are: i) the statistical tests of bias, the main purpose of this activity; ii) an analysis of outlier detection on scores for an extensive list of representative keywords; iii) the introduction of the second meta-engine based on majority judgment theory and believed to further reduce bias with respect to the consensus one; iv) a comparison of all SE outputs as well as our two meta-engines; v) the use of a more complete list of 15 SEs, while “only” 9 were considered in [14]; vi) the introduction of a publicly available tool to compare SEs and perform bias detection tests.
The rest of the paper is organized as follows. Section 2 presents our model, more precisely how we compute scores of links and SEs for given keywords based on average visibility. Section 3 introduces the statistical tests for potential bias, each of them based on Dixon’s Q test for outlier detection. Given the several SEs available, Section 4 proposes the two meta-engines aiming at reducing bias. The whole methodology is implemented on a publicly available web site to detect and reduce bias (thanks to our meta engines) as described in Section 5. Extensive tests are conducted and analyzed in Section 6, on detected bias but also to compare all the search engine outputs. Finally we conclude and describe our next research directions in Section 7.
2
Model/scoring system
This section recalls and expands the discussion in [14].
2.1
Score/relevance: visibility among SEs
The ranking of an SE is supposed to correspond to a list of links ordered by their relevance with respect to the composed keyword. Defining the notion of relevance is a complicated issue which can be considered subjective. Our goal is not to discuss how relevance should be defined, and it seems good to ob-serve several different notions implemented to leave the choice to (informed) users; this problem is also often related to the notion of transparency of algo-rithms but is out of the scope of the present paper (for more, see [21]). SEs use computationally-demanding algorithms to set their relevance score, such as PageRank for Google [27]. Bing5 as another main SE defines relevance as
“how closely the content on the landing page matches the intent behind the search query. This includes matching terms directly on the page as well as terms used in links referring to the page. Bing
also considers semantic equivalents, including synonyms or abbrevi-ations, which may not be exact matches of the query terms but are understood to have the same meaning.”
But Bing also uses other parameters for its ranking, such as the quality/reputation of the page, the fact that users already clicked on this link, the user location, the page load time, etc. The algorithm is therefore complex and resource and experience demanding.
We choose to make use of the outputs from the (already existing) complex algorithms of SEs rather than defining our own (which could be seen at least as arbitrary as any SE). For a given keyword, our definition of a score (or relevance) of a page will be its average visibility over SEs, the visibility for an SE depending on the page’s position in the ranking [20]. That choice presents several advantages:
• The method is computationally simple, taking benefit of the complex al-gorithms implemented by SEs; we just need to launch a search on all SEs and associate visibility values to the different positions6.
• What typically counts for content providers is to be clicked, the complaint in the search neutrality debate coming from the lack of reachability. It therefore makes sense to focus on visibility and quantify the differences with respect to that notion.
• Averaging over SEs reduces potential biases in relevance expressions and/or considers all dimensions of relevance considered by SEs, even if neglected by others.
2.2
Formalization
We formalize the model in this subsection, recalling and extending the notions in [14].
We consider n SEs, a set K of keywords (possibly infinite), and a finite set L of pages/links corresponding to all the results displayed for the whole set of searches. For any keyword k ∈ K, let pk be its probability to be dialed during
a search, such that P
k∈Kpk = 1; pk is therefore related to the frequency of
keyword k.
Even if SEs can display several pages of results for a given search we will limit ourselves to the first displayed result page for each SE, and assume for simplicity that it shows a number a > 0 of results, even if it can be easily generalized to the heterogeneous case.
As explained above, we will define the score of a page/link as its average visibility among SEs, a notion easier to consider than the subjective and many-parameters-dependent notion of relevance. Visibility can be estimated through
6Those visibility values (at least relative values, which is sufficient for us) can be estimated
from the click-through-rate (CTR) values on the links displayed in different positions; we keep that estimation out of the scope of this paper and assume the visibility values are given.
the click-through-rate (CTR) of a page at a given position, measuring the rate, or probability, at which it is clicked, denoted by ci,` for a Page i at position
` [20]. That value is typically SE-, position- and link- dependent, but we assume here for convenience, and as commonly adopted in the literature, a separability property [20] formalized as
ci,`= q0iq`,
i.e., the CTR is the product of a link-specific factor qi0 (some links are more attractive by nature) and a position-specific factor q` for position `. We will
interpret that expression in terms of probabilities, with the CTR ci,`
(proba-bility of being clicked) being the product of a proba(proba-bility of being seen q` (that
depends on the link position) and a probability of being clicked when seen qi0 (that depends on the link’s relevance to the request). We will therefore identify the visibility that a SE gives to a link/page shown in position ` with the term q`.
In general those terms can also be SE-dependent, but we will here consider the same values across SEs, since estimating them would require data obtained from extensive experiments–which is out of the scope of this paper–or directly from SEs. Nevertheless, that aspect is generalizable in our model without technical difficulty. Finally, note that we typically have q1≥ q2≥ · · · ≥ qa, meaning that
the better ranked, the more visible.
The visibility values q`we will use in our numerical studies come from CTR
values obtained through measurements in [9] and displayed in Table 1, with a = 10. Note that only the relative values of (q`) are needed, multiplying all
of them by a positive constant does not change anything in the model or the results. The underlying assumption for obtaining those values from statistics on click numbers is that the link-specific terms will tend to average out over a large number of searches, so that the click probabilities on each position will be proportional to the position-specific terms (q`). Note also that it is easy to
Table 1: CTR values used in the paper, taken from [9]
q1 q2 q3 q4 q5 q6 q7 q8 q9 q10
0.364 0.125 0.095 0.079 0.061 0.041 0.038 0.035 0.03 0.022
change those values, considering for example the ones obtained more recently and available at https://www.sistrix.com/blog/why-almost-everything-you-knew-about-google-ctr-is-no-longer-valid/.
Having introduced all the required notations, we can define the score of a page for a given keyword from outputs provided by SEs.
Definition 1. The score Ri,k of a page i ∈ L for a keyword k ∈ K is defined as
the average visibility of that page over the rankings from all considered SEs for that keyword: Ri,k:= 1 n n X j=1 qπj(i,k) (1)
where πj(i, k) denotes the position of page i on SE j for keyword k. If a page is
not displayed by an SE, the visibility is taken as 0 (equivalently, we can define a position a + 1 for non-displayed pages, with qa+1= 0).
With that score definition, any bias from an SE is smoothed (reduced) due to the averaging procedure, so that we expect page scores to be closely linked to the actual relevance of pages with respect to keywords.
2.3
Search engine score
Even if it is not the initial purpose of the work, defining a score for pages allows to define a corresponding score for SEs, for a given keyword but also for the whole set of searches. It quantifies how “consensual” with respect to the other SEs a given SE is.
Definition 2. The score Sj,k of an SE j for a given keyword k is defined as
the total “page score visibility” of its results for that keyword:
Sj,k:=
X
page i∈L
qπj(i,k)Ri,k,
where again qp= 0 if a page is ranked at position p ≥ a + 1 (i.e., not shown).
Note that equivalently, the score can be reformulated by summing over the displayed pages, Sj,k= a X p=1 qpRπ˜j(p,k),k
where ˜πj(p, k) is the page ranked at the pthposition by SE j for keyword k, i.e.,
˜
πj(·, k) is the inverse permutation of πj(·, k).
To interpret that score, the higher an SE ranks highly exposed pages, the higher its score, meaning that the score measures the visibility that the SE gives to pages that are well-exposed on average by SEs. Another way to interpret it is to see the page scores as approximations of the actual page relevances, so the SE score somehow measures the relevance seen by users on that SE.
From the SE scores per keyword, we can also define an overall score of SE j over the whole set of keywords:
Definition 3.
Sj := EK[Sj,k] =
X
k∈K
pkSj,k, (2)
where EK[·] is for the expected value of probability distribution (pk)k∈K over K.
This definition takes into account the frequency/probability pk of each
key-word k ∈ K, so that Sj represents the expected score that SE j would obtain
3
Statistical tests of bias
Our main goal is to develop a tool to detect potential biases in SEs’ outputs, based on the lists of results from all SEs. This is typically the goal of outlier detection [1, 13]. We want to use a non-heuristic statistical test designed for a small to moderate sample size (the size being the number of SEs): the natural candidate is then Dixon’s Q test [8, 10].
3.1
Dixon’s Q test
Dixon’s Q test [8, 10] is designed to quickly identify outliers in datasets that only contain a small number of observations.
Assume a data set of n (independent and identically distributed) values normally distributed and sorted in increasing order x1≤ x2≤ · · · ≤ xn.
To see if the largest value is an outlier, define the statistics
Q := Q10= xn−xn−1 xn−x1 if 3 ≤ n ≤ 7 Q11= xn−xn−1 xn−x2 if 8 ≤ n ≤ 10 Q21= xn−xn−2 xn−x2 if 11 ≤ n ≤ 13 Q22= xn−xn−2 xn−x3 if 14 ≤ n ≤ 25. (3)
Values qα,n are tabulated (see [10]) such that xn is considered an outlier at
confidence level 1 − α (or risk α) if Q > qα,n.
Similarly, if we rather want to investigate whether the smallest value x1 is
an outlier, we will consider the statistics
Q := Q10= xx2n−x−x11 if 3 ≤ n ≤ 7 Q11= xx2−x1 n−1−x1 if 8 ≤ n ≤ 10 Q21= xxn−13−x−x11 if 11 ≤ n ≤ 13 Q22= xx3−x1 n−2−x1 if 14 ≤ n ≤ 25. (4)
The Gaussian assumption is often violated, which may be a problem for a small data set, and it is also often advised to use Dixon’s Q test to only detect outliers and not to remove them7, but it is the existing tool that corresponds
best to our purpose, namely statistically detect potential bias/outlier. We will consider n = 15 SEs, that is, we will use the statistics Q = Q22.
The three next subsections describe the three implementations of Dixon’s Q test we will consider in practice.
3.2
Abnormal SE score for a given keyword
The first test we will consider aims to determine whether, for a given keyword, an SE score as of Definition 2 is abnormally low with respect to the others.
For a keyword k ∈ K, the values used for the test are therefore xj = S(j),k,
the SE scores, sorted in increasing order. We consider the statistics Q defined in
(4), and will say that the SE with the smallest score is an outlier and potentially biased at risk α if Q > qα,n.
By that test, we identify SEs with outputs significantly different from com-petitors. An uncommon behavior with respect to competitors means a low score.
3.3
Investigating SEs disregarding the most visible link
Consider the page/link ranked as the most visible for a given keyword k (i.e., the page with the largest score R·,k). Our aim is to determine if an SE is
ranking and making abnormally less visible this page considered relevant by the consensus.
If `∗ is the page in L with the highest score, the values xi for 1 ≤ i ≤ n are
the ordered scores/visibilities among the n SEs, that is, xi= qπi(`∗,k), 1 ≤ i ≤ n.
We again consider the statistics Q defined in (4), and will say that the SE with the smallest score is an outlier and abnormally “hides” the most relevant page (as per the consensus ranking) at risk α if Q > qα,n.
3.4
Investigating if the top-ranked page of each SE is also
visible at other SEs
The third test is to investigate whether an SE abusively gives the top spot to a link (as we did in our simulations in Subsection 4.2.2) to create an abnormal advantage.
To do that for any keyword k ∈ K, consider for each SE j the top-ranked page `0(j), and then take (x
i)1≤i≤n as the ordered visibilities (qπi(`0(j),k))1≤i≤n
of that page among SEs.
We end up with n tests for 1 ≤ j ≤ n suggesting that at risk α the visibility of the top-ranked page at SE j (necessarily the largest visibility q1) is abusively
high with respect to the visibility of that page at other SEs if the statistics Q defined in (3) verifies Q > qα,n.
3.5
Investigating if an SE ranks first a page not considered
relevant by others
The last test looks at the visibilities of the pages ranked first by SEs. If one of these top-ranked pages has a visibility (a score R·,k) abnormally low with
respect to the others, it may mean that this page is biased upward by the SE. Formally, for a keyword k ∈ K, the values used for the test are therefore xj = Rπe(j)(1,k),k, 1 ≤ j ≤ n, the ordered n scores of the SE top-ranked pages.
We consider the statistics Q defined in (4), and will say that the SE whose top-ranked page has the smallest score is an outlier and potentially biased at risk α if Q > qα,n.
4
Meta search engines
Defining page scores and looking for an SE without bias leads naturally to the definition of meta SEs with bias reduction. In Section 4.1, we redefine the SE first introduced in [14], and in Section 4.2 we introduce another meta SE, based on the majority judgment rule and expected to limit the potential biases even further.
4.1
Consensus SE
Using the score definition of pages in the previous section, it seems natural to define a consensus SE as the one showing the pages with the highest scores, i.e., maximizing the SE score for each keyword.
Definition 4. For a given keyword k, the consensus SE is a meta-SE that shows at position p the page π(k)(p), where the permutation π(k)(·) is chosen such that
π(k)(·) ∈ arg max π(·) a X p=1 qpRπ(p),k.
In other terms, pages are displayed in decreasing order of their computed score (their “estimated relevance”) R·,k for that keyword k.
We will also be able to compute the total score of the consensus SE, maximal among all SE scores by definition, which will allow us to compare how close to “optimal” the other SEs are.
4.2
Majority judgment SE
4.2.1 Definition
Another meta SE we propose here is based on the so-called majority judgment considered for voting systems and presenting nice properties [2, 3]. We adapt it to our context to build a ranking procedure expected to further reduce biases induced by SEs with respect to the consensus SE.
Consider a keyword k ∈ K. In the majority judgment, “voters” give an evaluation to each candidate. In our context, voters are SEs, and candidates are pages to be displayed. The evaluations are the visibility values (or equivalently the positions) associated to each page, ri,k,j:= qπj(i,k)for page i on SE j: pages
ranked first have the highest scores/evaluations.
Definition 5. The majority judgment ranking for a keyword k works as follows:
• For each page i, compute its majority judgment ri,k as the best (highest)
evaluation among (ri,k,j)1≤j≤n for which 50% or more SE give at least
that value. In case of an odd number n of SEs, it is the middle value (median) of the ordered values, but for an even number, it is the lowest value of the two in the middle interval (so that more than 50% of the SEs
give at least this value). Formally, if ri,k,(1)≥ ri,k,(2) ≥ · · · ≥ ri,k,(n) are
the ordered values,
ri,k= ri,k,(d(n+1)/2e)
In summary, it is the best score accepted by a majority of SEs.
• The final majority judgment ranking is the ranking according to the values ri,k, from the largest to the smallest.
In case of equality in a given subset, a vote equal to ri,k is removed for all
competitors i, and the algorithm repeated with this excluded value (for this subset of competitors) by computing the new majority judgment values. This is repeated up to a differentiation is made, which happens except if some candidates have exactly the same set of rankings.
Remark that while the consensus ranking allowed naturally to give a score to SEs and make comparisons (computing through the score how far from the consensus a given SE is), it is not that obvious with the majority judgment; that open question is left to future research.
4.2.2 Sensitivity to bias/outliers: Majority Judgment versus Con-sensus
If an SE is biased and associates to a page a visibility value that is uncorrelated with its relevance, the value itself does not influence the majority judgment ranking (only its position with respect to the median can have an impact); that should smooth biases even more than the consensus ranking.
To illustrate this, we build an artificial model made of 15 SEs, and 20 po-tential pages to be displayed. When we simulate a search, each page has an intrinsic relevance, that we draw from a uniform distribution over the interval [0, 1]. SEs on the other hand may only be able to imperfectly estimate that rel-evance: to model that we add for each SE and for each page a Gaussian random variable with mean 0 and variance σ2 (all those 15 × 20 “noise” variables being independent). If unbiased, SEs then rank pages according to that estimation, so that the larger σ2 the more differences between SEs, and all SEs give exactly the same ranking when σ = 0.
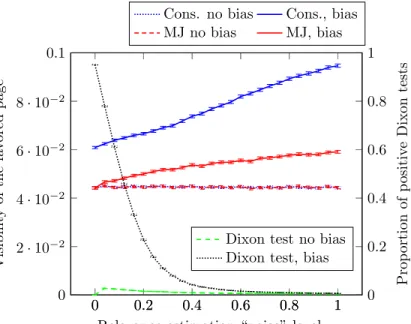
We aim to investigate the impact on meta-SE rankings of one SE biasing in favor of one page, displaying it first whatever its relevance estimation. (We assume that the SE still ranks all the other pages by estimated relevance, and all the other SEs also rank with respect to their estimated relevances.) We plot in Figure 1, when the “estimation imperfection” σ varies, the average visibility (along with the corresponding 95% confidence interval) of the favored page when repeating 105 independent experiments for the simulated and estimated
relevances. We use the visibility values (q`) given in Table 1.
We can readily check that average visibilities for the two meta SEs are simi-lar in value when not biasing, and not sensitive to the noise level σ in relevance evaluation by SEs. On the other hand, there are significant differences in the visibility of biased pages for our meta SEs: i) the bias (i.e., the difference of
0 0.2 0.4 0.6 0.8 1 0 2 · 10−2 4 · 10−2 6 · 10−2 8 · 10−2 0.1
Relevance estimation “noise” level σ
Visibilit y of the fa v ore d page
Cons. no bias Cons., bias MJ no bias MJ, bias 0 0.2 0.4 0.6 0.8 1 0 0.2 0.4 0.6 0.8 1 Prop ortion of p ositiv e Dix o n tests
Dixon test no bias Dixon test, bias
Figure 1: Visibility with the two meta-SEs, with and without bias introduced by the first SE, and corresponding results of the Dixon test for that SE (Dixon test on the SE score being abnormally low). 95% confidence intervals are also displayed.
visibility with respect to the un-biased case) is significantly lower when using majority judgment with respect to consensus; ii) in both cases, the more vari-ability in relevance estimation, the larger the bias; this is due to less consensu-ally defined positions (and scores) when variability is high, hence less consensus among non-biased SEs which leaves more room to affect meta-SEs; iii) the bias increase with σ is significantly lower for the majority judgment, even close to marginal, as expected. On the same figure, we superimpose the frequency of rejection of the null hypothesis “the score of SE1 (the one with a potential bias) is not abnormally low with respect to the other SEs”, with the Dixon test at risk level 1% (described in Section 3.2). Notice that when that SE does not bias the results, it almost never is labeled as an outlier, i.e., false positives are rare. When implemented, bias is frequently detected for low noise values σ: in those cases there is a clear consensus among all the other SEs and the bias is easily detectable. For large noise values, SEs have difficulty agreeing on what pages to display, which benefits the biasing SE in two ways: it has a larger impact on the visibility that its target page gets with the meta-engines, but the bias introduced is harder to detect.
5
A publicly available platform: SNIDE
We have designed a tool/website to implement the theory developed in previous sections. The tool, available at
https://snide.irisa.fr/
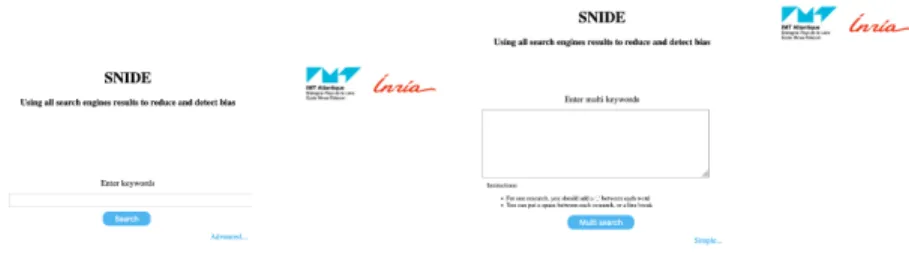
is both designed for single (general audience) and multiple (research) search purposes8. Figure 2 (left) displays the home page for single searches (e.g., for a user wishing to use our meta-engines or just compare SEs visually), and (right) the page after clicking on the “advanced” button, designed to run the tool for multiple searches (e.g., to carry out larger-scale analyses on the differences among SEs).
For both single or multiple searches, the tool is a web crawler written in Python. The code to get page URLs is adapted to each SE, because they display the results differently. It gives the results from 13 search engines9 selected
among the most used worldwide. Note that we excluded SEs such as Baidu due to language issues. The 13 SEs are:
• AllTheInternet • AOL • Ask • Bing • DirectHit • Duckduckgo • Ecosia • Google • Lilo • Lycos • Teoma • Yahoo • Yippy
8We continuously update the website to follow the changes implemented by SEs when
collecting results; as a result, the website may experience some small issues. When we carried out the analysis presented in this paper, we checked that the result collection was working properly.
9Our initial web crawler [14] was limited to 9 SEs and was not available as a public web
Figure 2: Home page of the website https://snide.irisa.fr/ (left), and for multiple searches (right) when clicking on “advanced”
Figure 3: Example of results for a simple search
Let us focus on the “simple” search first. The web site provides various data when composing keywords, as illustrated in Figure 3. The list of SEs appears on the left, and their scores for this search are displayed. The tool also highlights in color and indicates below the list of SEs whether one SE has a score abnormally low according to the test described in Section 3.2. To go more into details, the user can get the list of the 10 first results of each SE (together with the scores of those pages) by a click on the “down” arrow near each SE. On the right-hand side of the page, the tool gives by default the results of the bias tests described in Sections 3.3 and 3.4, and the rankings of our two meta SEs can be obtained by clicking on the “consensus ranking” or “majority judgment” buttons. That is useful to make comparisons between SEs, but may also be of interest for users interested in engines smoothing possible biases.
With the “advanced” option of multiple searches, designed more for research purposes, the user can download two files: one with the full output (the top 10 results by each SE for each search), and the other including the analysis (scores and test results). Two format options are possible: text to immediately visualize the results, or JSON for a use with databases.
list a few:
• A priori different URLs can lead to the same page. It is for example the case of http://www.maps.com/FunFacts.aspx, http://www.maps. com/FunFacts.aspx?nav=FF, http://www.maps.com/FunFacts, etc. It can be checked that they actually lead to the same webpage output when accessing the links proposed by the SEs. Sometimes pages are indifferently http or https. We have tried to handle these cases as much as possible.
• For some specific keywords such as Facebook, some SEs do not provide a list of corresponding responses, but rather redirect immediately to the facebook.com webpage. That is typically what AllTheInternet is doing. This is treated in our stats as the SE providing a single response, ranked first. (An alternative approach would have been to assume a different q1
for those cases–meaning a very high visibility for that page–but this would have altered the meaning of the tests we perform.)
• Sending too many requests over a short period results in our tool being banned by SEs like Google or Startpage; this is typically what happened after our campaign of tests presented in next section. We are working on preventing that behavior; a solution could be for the tool to run locally (on the user’s machine) instead of on our central server, which will reduce the searches per day from a given host; another way could be to have regulators intervene to legally prevent blocking when SEs are used for research purposes, as suggested in Europe. These propositions are left for future research.
• Sometimes, SEs update their platforms so that our parser may not get the relevant information to recover the top 10 results. We need to frequently update our tool to avoid those issues.
6
Comparisons on a large campaign of keywords
We now aim to analyze the results obtained from a campaign of searches. We chose to use 767 keywords among the most searched from
https://www.mondovo.com/keywords/most-searched-words-on-google/,
and for which we also have the search volume, so that we can compute pk for
any keyword k ∈ K, and the related expected values (of scores, of positive tests...). Note that we ran our tool on the 1000 most-searched terms accord-ing to the mentioned website, but we encountered some data collection issues for 233 of them. The list of searched terms, as well as their search frequen-cies and the top 10 result we collected from each SE are publicly available10. 10All the data we use in this paper can be accessed in the folder https://partage.imt.fr/
100 101 102 103 107
108
Search term index (when ranked by popularity)
Searc
h
v
olume
Figure 4: Search volumes of the 767 search terms used in the study
Interestingly, the search terms with data collection issues are not spread inde-pendently of their search volume: out of the 19 most-searched terms, 15 led to data collection issues, and they represent 39% of the total search volume from the 1000 most-searched terms. However, we believe this does not affect the analysis we make in this paper, because those specific terms are generally typed in a search engine merely to access the service with that name, not to ob-tain information regarding the search term. For example the top-searched term “facebook” is mostly searched by people using the SE almost as a DNS service: they just want to access their Facebook page. The other 14 terms with issues among the top 19 are of the same type: “youtube”, “google”, “gmail”, “xxnx”, “xvideos”, “facebook+login”, “pornos”, “xxx”, “google+translate”, “yahoo”, “ebay”, “google+maps”, “yahoomail”, and “instagram”. Excluding those 15 search terms from the total search volume, the results we managed to collect represent 91.7% of the (remaining) search volume.
We plot in Figure 4 the volumes of searches for the 767 search terms in the study, as given by the aforementioned webpage. When plotted in double-logarithmic scale, the curve is close to a straight line, in accordance with the Zipf distribution, a distribution often observed in natural language, content or webpage popularity, and many other domains [31].
For the analysis in this section, we consider the 13 SEs given in the previous section, and the visibility/CTR values of Table 2.
6.1
Search engines scores
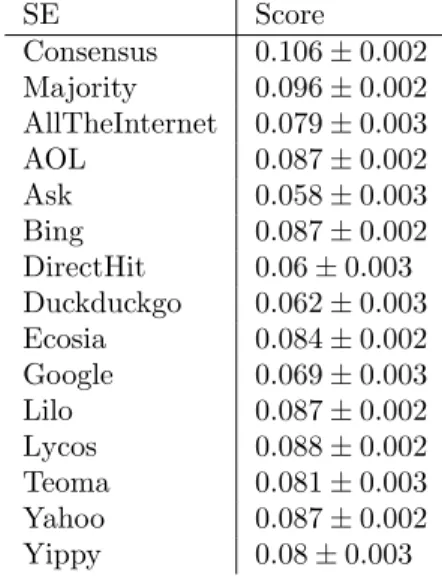
Table 2 gives the average (weighted) scores of the 13 search engines, plus the 2 meta engines. We also include the 95% confidence intervals that would be
obtained (abusively) assuming requests are independently drawn from a distri-bution on all possible requests. One can check the score of her/his favorite SE.
SE Score Consensus 0.106 ± 0.002 Majority 0.096 ± 0.002 AllTheInternet 0.079 ± 0.003 AOL 0.087 ± 0.002 Ask 0.058 ± 0.003 Bing 0.087 ± 0.002 DirectHit 0.06 ± 0.003 Duckduckgo 0.062 ± 0.003 Ecosia 0.084 ± 0.002 Google 0.069 ± 0.003 Lilo 0.087 ± 0.002 Lycos 0.088 ± 0.002 Teoma 0.081 ± 0.003 Yahoo 0.087 ± 0.002 Yippy 0.08 ± 0.003
Table 2: SE average scores, and 95% confidence intervals half-widths.
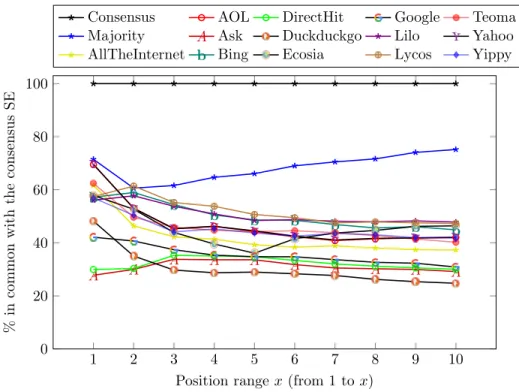
To see how close an SE is with the consensus SE, Figure 5 displays by SE the percentage of common results with the consensus SE for each position range. More specifically, for each SE we plot the proportion of links among the top x positions that are also in the top x positions of the consensus ranking.
Finally here, we draw in Figure 6 the distribution of the SE scores over searches (relatively to the consensus score), with on the x-axis the searches ordered (for each SE) by increasing relative scores. That representation allows to see how far each SE tends to be from the consensus ranking. It is not too surprising that the highest curve be the one from our other meta-SE (Majority Judgment), although it is at some points slightly below the curves for Yippy, Lycos, Lilo or Bing. Among SEs, one can also notice some distributions that look very close, like those from Ask and DirectHit, or those from Yahoo and AOL that almost coincide, or Lilo and Bing. Those apparent similarities need to be taken with care though, since for each SE the search terms are reordered by increasing values of the relative score, so having similar distributions does not imply that the SEs return the same results.
To investigate further that question of similarities between SEs, we compute an average (weighted) distance between each pair of SEs. The distance metric that we use is inspired by the Wasserstein distance used in optimal transport problems [34]: considering that a ranking gives some visibility weight to some
1 2 3 4 5 6 7 8 9 10 0 20 40 60 80 100 A A A A A A A A A A b b b b b b b b b b
Position range x (from 1 to x)
% in common with the consensus SE
Consensus AOL DirectHit Google Teoma Majority A Ask Duckduckgo Lilo Yahoo AllTheInternet b Bing Ecosia Lycos Yippy
0
0.1
0.2
0.3
0.4
0.5
0.6
0.7
0.8
0.9
1
0
0.2
0.4
0.6
0.8
1
Query ordered by relative score
Relativ
e
score
AllTheInternet
AOL
Ask
Bing
DirectHit
Duckduckgo
Ecosia
Lilo
Lycos
Teoma
Yahoo
Yippy
Majority Judgment
Figure 6: Distribution of scores relative to the consensus, from smallest to largest
Ma jorit y AllTheIn ternet A OL
Ask Bing DirectHit Duc
kduc
kgo
Ecosia Go
ogle
Lilo Lycos Teoma Yaho
o Yipp y Consensus 0.3 0.55 0.49 0.7 0.49 0.69 0.67 0.52 0.64 0.49 0.49 0.52 0.49 0.54 Majority 0.56 0.46 0.77 0.5 0.75 0.69 0.55 0.67 0.48 0.49 0.53 0.46 0.54 AllTheInternet 0.63 0.85 0.81 0.5 0.7 0.81 0.8 0.81 0.81 0.44 0.63 0.67 AOL 0.9 0.72 0.8 0.73 0.75 0.87 0.71 0.7 0.69 0.03 0.38 Ask 0.8 0.44 0.9 0.8 0.56 0.8 0.8 0.76 0.9 0.9 Bing 0.9 0.84 0.42 0.66 0.28 0.32 0.75 0.72 0.76 DirectHit 0.84 0.89 0.87 0.9 0.89 0.65 0.8 0.81 Duckduckgo 0.86 0.85 0.85 0.83 0.7 0.73 0.77 Ecosia 0.71 0.34 0.44 0.75 0.75 0.76 Google 0.67 0.68 0.67 0.87 0.88 Lilo 0.34 0.76 0.71 0.73 Lycos 0.74 0.68 0.72 Teoma 0.69 0.73 Yahoo 0.38
Table 3: Average Wasserstein distances between SEs (darker cells indicate a higher similarity). The average distance value is 0.67, the median 0.71, and the standard deviation 0.17.
webpages, we compute the minimum effort to move “visibility mass” (from some pages to others) to obtain the visibilities given by a second ranking. Since there is no clear distance defined between two webpages, we consider that any two different webpages are at the same distance (say, 1), so that the total effort to convert one ranking into another is just the amount of visibility to displace. That amount will then be considered as the distance between the two rankings. Mathematically, the distance (for a given search) between rankings π and ˜π (with π(i) the position of page i in ranking π, and similarly for ˜π) is therefore expressed as
D(π, ˜π) =X
i∈L
[qπi− q˜πi]+,
where x+ = max(0, x). Those pairwise distances are given in Table 3. This
metric allows to see which SEs tend to give similar results. In particular, the distance between AOL and Yahoo is very small, which is consistent with our observations of Figure 6. Other SEs with relatively small distances are the triplet Bing, Lilo, Lycos (with pairwise distances below 0.35). On the other hand, some other pairs like Ask/DirectHit appear less similar than what could be seen in Figure 6, although their distance remains more than one standard deviation below the average value among SE pairs. Finally, we notice that our
two meta-SEs, the Consensus and Majority Judgment rankings, even if quite close when compared to other measured distances, are yielding clearly different results, with an average distance over our search terms of 0.3 (i.e., on average one has to “move” 30% of the “visibility points” to get from one meta-ranking to the other).
6.2
Identifying potential biases
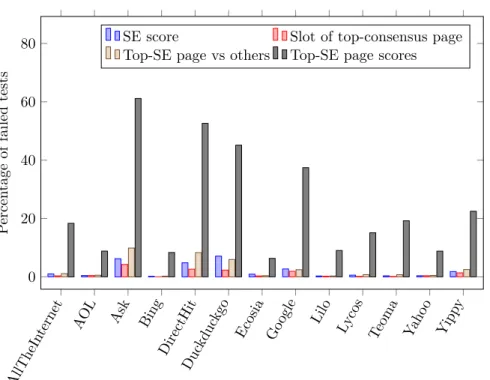
We now see how SEs perform with respect to the tests defined in Section 3, for our set of search terms. Figure 7 presents the proportions of keywords (weighted by their frequency) for which each SE was rejected by our various tests (based on the Dixon outlier detection test) with risk 1%:
• for having a low score (test “SE score”, with tested hypothesis “the score of that SE is not an outlier ”),
• for not showing high enough the most consensual page (test “Slot of top-consensus page”, with tested hypothesis “the visibility given by that SE to the top-consensus page is not an outlier ”),
• for displaying in their top slot a page that is not deemed relevant by the other SEs (test “Top-SE page vs others”, with tested hypothesis “the visibility given by that SE to its top-ranked page is not an outlier (among all visibilities given by SEs for that page)”),
• for displaying in their top slot a page much less relevant than the others (test “Top-SE page scores”, with tested hypothesis “the score of that SE’s top-ranked page is not an outlier (among all SE top-ranked-page scores)”).
We note that Ask is the SE performing worst in all 4 test categories, followed closely by DirectHit and Duckduckgo, with Google a bit behind.
Looking at those 4 metrics, the best-performing SEs appear to be AOL, Bing, Lilo and Yahoo. However, note that this is likely to be a consequence of those SEs returning quite similar results, as shown before in Table 3: since the tests are based on outlier detection, a biased behavior will not be detected if implemented by enough SEs. Hence again, those results do not show that AOL, Bing, Lilo and Yahoo are better than the other SEs, but rather that their behavior do not individually stand out when compared to the 12 others. The fourth test experiences more detections, probably false positives, that test being more sensitive to the unsatisfied Gaussian assumption, comparing the (relatively much higher) CTR of the first position with potentially other CTR values if the page is not ranked first by other SEs.
To correlate with what we did in [14], we re-identify in Table 4 for each SE the (ordered) 10 queries with lowest relative score with respect to the consensus SE. The table seems to show less sensitive terms than what we had observed in [14], suggesting either that the discrepancies among SEs are not economically motivated or that such biases are not detected since implemented by several SEs. One can nevertheless notice the search term “chrome”, in the list of the terms for
AllTheIn ternet A OL Ask Bing DirectHit Duc kduc kgo Ecosia Go ogle Lilo
Lycos Teoma Yaho o Yipp y 0 20 40 60 80 P ercen tage of failed tests
SE score Slot of top-consensus page Top-SE page vs others Top-SE page scores
Figure 7: Proportion of failed tests (Dixon tests presented in Section 3) at risk level 1% for each SE (results for risk levels 5% and 10% are very similar).
AllTheInternet comuniazo make+my+trip quot bidmate bee+bee otto film+streaming camera+360 mail+online bookers AOL focus paris allegro gossip united+airlines eme quot gaps bonprix fifa+16 Ask aright+move sears 9+gag verizon+wireless live+cricket+score arsenal rotten+tomatoes free+mobile lowes national+hockey+league Bing coco zing cars+game camera leos michael captain+america+civil+war skies happy+birthday fitbit DirectHit ebay+kleinanzeigen bbc+football american+online+inc sears 9+gag verizon+wireless live+cricket+score arsenal rotten+tomatoes free+mobile Duckduckgo ynet rambler goggle+news att man+united a+bola citi+bank lowes gamestop fandango Ecosia mac movistar chromecast lazada car+game zing tetris cheap+flights odnoklassniki chatro Google frozen restaurant+near+me chrome tesla fitbit currency+converter united+airlines pizza mega happy+wheels Lilo car+g fahrenheit otto american+online+inc emoji fitbit fifa+15 chatro movistar happy+wheels Lycos video+one anime+goog east coco mail+online camera zing happy+birthday fitbit applock Teoma restaurant+near+me pizza tests enterprise western+union traductor+de+google avianca lego app+lock cars+game Yahoo focus paris allegro gossip united+airlines mp3+music+downloading eme quot gaps bonprix Yippy music focus internet cinepolis email east gossip video+one apps nissan
which Google’s score is the lowest relative to the consensus. For that term, one can expect that Google tends to refer more to its Chrome web browser rather than to the metal plating when compared with the other SEs; that specific search term is analyzed further below.
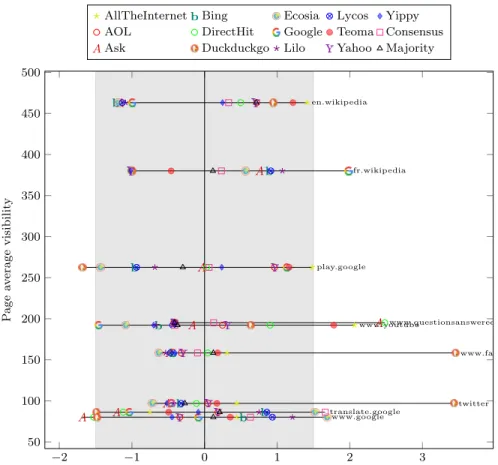
Another observation which might be of interest is to look at the most im-portant pages (that is, those having the largest visibility–their average CTR among SEs– over all weighted keywords) and compare their visibility at the various SEs. To do so, we aggregate pages within the same domain. The goal is to highlight SEs giving to some pages/domaines a very different visibility from others: far above average could mean ties with the page, and far below would mean neglecting it in a suspect way. Figure 8 displays the distance with the average score (divided by the standard deviation), when we normalize the visibility scores. SEs are identified when at the extremes.
Figure 8 illustrates that Wikipedia is the most visible domain overall, even when its English-speaking and French-speaking variants are considered separate domains (all our searches have been performed from France). It seems that Google makes an extensive use of the geographical data of the user, and refers to the French-speaking version significantly more often than the other SEs; Google is also on the lower-end side for the visibility it gives to the English-speaking version. Finally regarding Google, one can notice that surprisingly, it is the SE giving the lowest visibility to YouTube, despite owning it. Maybe this is due to Google having a specific “video” option for its search, while all our tests were using the “all” (all types of results) filter.
The figure also highlights the higher visibility that Duckduckgo gives to Facebook and Twitter (visibility more than 3 standard-deviations above the SE average), and the low visibility it gives to some Google-owned services like Google Play, Google Translate, or just the Google website www.google.com. Notably, the SE Ecosia has a behavior opposite to Duckduckgo for those five domains.
6.3
Comparison of meta engines
We already illustrated in Section 4.2.2 in an artificial setting the advantage of the majority judgment ranking over the consensus one to reduce biases. Our goal here is to see what happens with “real” searches.
On Table 2, we can check that the majority judgment SE gives an average score about 10% smaller than the consensus one (built as the score-maximizing ranking). That score is significantly larger than any available engine, with the advantage of significantly reducing biases.
To emphasize the gain in bias reduction by the majority judgment ranking, we show in Figure 9, among the pages ranked first by an SE and identified by a Dixon’s Q test as a potential outlier (Section 3.4), their position distribution at both the consensus and majority judgment ranking. The figure highlights the lower sensitivity of the Majority Judgment ranking to one page being arti-ficially boosted by an SE, as we had observed for the numerical experiment of Section 4.2.2. Indeed, among the SE top-ranked pages detected as outliers due
−2 −1 0 1 2 3 50 100 150 200 250 300 350 400 450 500 en.wikipedia fr.wikipedia play.google www.questionsanswered www.youtube www.facebook twitter translate.google www.google A A A A A A A A A b b b b b b b b b
Visibility distance to SE average (nb of standard deviation)
P age a v erage visibilit y
AllTheInternetbBing Ecosia Lycos Yippy AOL DirectHit Google Teoma Consensus
AAsk Duckduckgo Lilo Yahoo Majority
Figure 8: Distance between visibilities of domains for the most-shown domains. Each line is a domain, the line height is the domain average visibility, and each dot represents a specific SE (the abscissa of the dot is the difference between the domain visibility for that SE to the mean domain visibility, normalized with the standard deviation among SEs). The grey zone indicates the interval with semi-width 1.5 standard deviation.
1 2 3 4 5 6 7 8 9 10 Not shown 0 20 40 60 80 Position at meta-SE P ercen tage of detected pages Consensus Majority
Figure 9: Repartitions of the position on the meta-SEs of the suspected top-results from SEs.
to a low score, the Majority Judgment ejects nearly 80% (versus 30% for the Consensus ranking), and generally tends to rank them worse than the Consen-sus ranking. That higher sensitivity of the ConsenConsen-sus ranking is due to the fact one SE showing a page on the top of its results already guarantees the page a score of at least q1/N (attained if the page is only shown by this SE), which can
be sufficient to be among the 10 highest-score pages; by contrast, the Majority Judgment would prefer a page that is shown–event in low positions–by two SEs or more over a top-result shown by only one SE.
6.4
An example: the “chrome” keyword
We previously evoked the search term “chrome”, as one for which Google dis-agrees most with our Consensus meta-SE. In this section we analyze that case in more detail. The detailed results from each SE can be found on our shared archive, to save space we only provide in Table 5 the rankings given by our two meta-SEs.
Several points are worth mentioning for that specific search:
• The SEs Ask and DirectHit give the exact same three pages in their three top results, from the domain “questionsanswered.net”, but no page from that domain is shown by any other SE;
• Nevertheless, since there are two SEs showing the same top result, neither of them is labeled as an outlier regarding the visibility that their top-page has among others (test from Subsection 3.4), but both are detected by the
Consensus www.google.com/chrome www.google.fr/chrome/index.html www.google.com/chrome/browser/index.html www.questionsanswered.net/article/how-updat.. apps.apple.com/us/app/google-chrome/id53588.. www.google.com/intl/en/chrome www.commentcamarche.net/download/telecharge.. www.clubic.com/telecharger-fiche257658-goog.. www.google.fr/chrome www.questionsanswered.net/article/how-insta.. Majority judgment www.google.fr/chrome/index.html www.google.com/chrome/browser/index.html apps.apple.com/us/app/google-chrome/id53588.. www.google.com/chrome support.google.com/chrome/answer/95346?co=G.. play.google.com/store/apps/details?id=com.a.. www.commentcamarche.net/download/telecharge.. support.google.com/chrome/?hl=en www.clubic.com/telecharger-fiche257658-goog.. chrome.google.com/webstore
Table 5: Rankings for our two meta-SEs for the research term ’chrome’ (The two urls highlighted in red were shown only by two SEs, in their top two results).
other test version (from Subsection 3.5) comparing the visibility score of SE top-results.
• Those two SE, even if the only ones showing pages from the domain “ques-tionsanswered.net”, influence significantly the Consensus ranking (due to the high weight given to top ranks) by getting two of those page shown. By contrast no such page is shown in the Majority Judgment ranking, illustrating its higher robustness to biases as observed for our synthetic example of Section 4.2.2.
7
Conclusions
This paper proposes a model and tools to analyze the results from search engines (SEs), combine them to build some meta-SEs, and detect possible bias using statistical tests. The whole framework is presented in a publicly-available tool. The basis of our model is the interpretation of the positions in search engines ranking in terms of visibility given to webpages. This allows us to aggregate the visibility that a webpage is given from a set of SEs, and to define several types of tests using the Dixon outlier detection test.
The meta-SEs we have defined and implemented have satisfying properties: the Consensus ranking allows to average out some possible bias ranks by ranking according to pages’ aggregated visibility for a search term, and the Majority Judgment favors pages that deserve visibility by at least half of the SE, hence being more robust to manipulations by one or a few SEs.
The test campaign that we have carried out on 767 search terms allows to identify some differences and similarities among SEs, for example highlighting some tendencies to comparatively favor or disfavor some specific domains.
The work presented in this paper opens several directions for future research. First, the data collection tool would need to be improved to be able to deal with SEs’ changes in the presentation of their result pages, so that some further campaigns could be run on whole sets of search terms (for our campaign we had to remove 233 terms out of the initial 1000). Also, a fine tuning of the parameters in the model would be worth considering, in particular the visibility values for each position and on each SE would need to be estimated with more precision, and the results compared with what we get with our coarse approach (visibility
depending only on position). We also compared results from “new” users, i.e., without any cookie, browsing or search history, or personal data; the method proposed in this paper could be used to investigate how such information affects SE results through test campaigns using a variety of user profiles, checking whether a bias occurs for some specific profiles.
Acknowledgement
The authors would like to acknowledge the support of Inria through the ex-ploratory action SNIDE (for Search Non neutralIty DEtection).
References
[1] C. C. Aggarwal. Outlier Analysis. Springer Publishing Company, Incorpo-rated, 2nd edition, 2016.
[2] M. Balinski and R. Laraki. Majority Judgment: Measuring Ranking and Electing. MIT Press, 2010.
[3] M. Balinski and R. Laraki. Judge: Don’t vote! Operations Research, 62(3):483–511, 2014.
[4] Judit Bar-Ilan, Mazlita Mat-Hassan, and Mark Levene. Methods for com-paring rankings of search engine results. Comput. Netw., 50:1448–1463, July 2006.
[5] A. J. Biega, K. P. Gummadi, and G. Weikum. Equity of attention: Amortiz-ing individual fairness in rankAmortiz-ings. In The 41st International ACM SIGIR Conference on Research & Development in Information Retrieval, SIGIR ’18, pages 405–414, New York, NY, USA, 2018. ACM.
[6] P. Coucheney, P. Maill´e, and B. Tuffin. Network neutrality debate and ISP inter-relations: Traffic exchange, revenue sharing, and disconnection threat. Netnomics, 1(3):155–182, 2014.
[7] J.-C. de Borda. M´emoire sur les ´elections au scrutin. M´emoires de l’Acad´emie Royale des Sciences, pages 657–664, 1781.
[8] R. B. Dean and W. J. Dixon. Simplified statistics for small numbers of observations. Analytical Chemistry, 23(4):636–638, 1951.
[9] R. Dejarnette. Click-through rate of top 10 search results in Google, 2012. http://www.internetmarketingninjas.com/blog/ search-engine-optimization/click-through-rate, last accessed June 28, 2017.
[11] C. Dwork, R. Kumar, M. Naor, and D. Sivakumar. Rank aggregation methods for the web. In Proceedings of the 10th International Conference on World Wide Web, WWW ’01, pages 613–622, New York, NY, USA, 2001. ACM.
[12] J. Grimmelmann. Some skepticism about search neutrality. In Berin Szoka and Adam Marcus, editors, The next digital decade: Essays on the future of the Internet, pages 435–460. TechFreedom, Washington, DC, 2010.
[13] V. Hodge and J. Austin. A survey of outlier detection methodologies. Artif. Intell. Rev., 22(2):85–126, October 2004.
[14] A. Kamoun, P. Maill´e, and B. Tuffin. Evaluating search engines and defining a consensus implementation. In VALUETOOLS 2019 Conference, Palma de Majorque, Spain, March 2019.
[15] J. Kulshrestha, M. Eslami, J. Messias, Muhammad B. Zafar, S. Ghosh, K. P. Gummadi, and K. Karahalios. Quantifying search bias. Proceedings of the 2017 ACM Conference on Computer Supported Cooperative Work and Social Computing, Feb 2017.
[16] P. L’Ecuyer, P. Maill´e, N. Stier-Moses, and B. Tuffin. Revenue-maximizing rankings for online platforms with quality-sensitive consumers. Operations Research, 65(2):408–423, 2017.
[17] T.M. Lenard and R.J. (Eds.) May. Net Neutrality or Net Neutering: Should Broadband Internet Services be Regulated. Springer, 2006.
[18] D. Lewandowski. Evaluating the retrieval effectiveness of web search en-gines using a representative query sample. J. Assoc. Inf. Sci. Technol., 66(9):1763–1775, September 2015.
[19] D. Lewandowski. Is google responsible for providing fair and unbiased results? In Mariarosaria Taddeo and Luciano Floridi, editors, The Respon-sibilities of Online Service Providers, pages 61–77. Springer International Publishing, Cham, 2017.
[20] P. Maill´e, E. Markakis, M. Naldi, G. Stamoulis, and B. Tuffin. An overview of research on sponsored search auctions. Electronic Commerce Research Journal, 12(3):265–300, 2012.
[21] P. Maill´e, G. Simon, and B. Tuffin. Toward a net neutrality debate that con-forms to the 2010s. IEEE Communications Magazine, 54(3):94–99, 2016.
[22] P. Maill´e and B. Tuffin. Telecommunication Network Economics: From Theory to Applications. Cambridge University Press, 2014.
[23] G. A. Manne and J. D. Wright. If search neutrality is the answer, what’s the question? Law and Economics Research Paper Series 11-37, George Mason University, 2011.
[24] A. Mowshowitz and A. Kawaguchi. Assessing bias in search engines. In-formation Processing & Management, 38(1):141 – 156, 2002.
[25] A. Mowshowitz and A. Kawaguchi. Measuring search engine bias. Infor-mation Processing & Management, 41(5):1193 – 1205, 2005.
[26] A. Odlyzko. Network neutrality, search neutrality, and the never-ending conflict between efficiency and fairness in markets. Review of Network Economics, 8(1):40–60, 2009.
[27] M. Page, S. Brin, R. Motwani, and T. Winograd. The pagerank citation ranking: Bringing order to the web. Technical Report 1999-66, Stanford InfoLab, November 1999. Previous number = SIDL-WP-1999-0120.
[28] Digital Competition Expert Panel. Unlocking digital competition, re-port of the digital competition expert panel. Technical report, 2019. https://assets.publishing.service.gov.uk/government/uploads/ system/uploads/attachment_data/file/785547/unlocking_digital_ competition_furman_review_web.pdf.
[29] E. Pitoura, P. Tsaparas, G. Flouris, I. Fundulaki, P. Papadakos, S. Abite-boul, and G. Weikum. On Measuring Bias in Online Information. SIGMOD record, 2018.
[30] R. Pollock. Is google the next microsoft: Competition, welfare and regula-tion in online search. Review of Network Economics, 9(4):1–31, 2010.
[31] W. J. Reed and B. D. Hughes. From gene families and genera to incomes and internet file sizes: Why power laws are so common in nature. Physical Review E, 66(6), 2002.
[32] R. E. Robertson, S. Jiang, K. Joseph, L. Friedland, D. Lazer, and C. Wil-son. Auditing partisan audience bias within google search. Proc. ACM Hum.-Comput. Interact., 2(CSCW), November 2018.
[33] L. Vaughan and M. Thelwall. Search engine coverage bias: evidence and possible causes. Information Processing & Management, 40(4):693 – 707, 2004.
[34] C. Villani. Optimal transport: old and new. Springer, 2008.
[35] W. Webber, A. Moffat, and J. Zobel. A similarity measure for indefinite rankings. ACM Trans. Inf. Syst., 28(4):20:1–20:38, 2010.
[36] J. D. Wright. Defining and measuring search bias: Some preliminary ev-idence. George Mason Law & Economics Research Paper 12-14, George Mason University School of Law, 2012.
[37] T. Wu. Network neutrality, broadband discrimination. Journal of Telecom-munications and High Technology, 2003.
[38] H.P. Young. An axiomatization of Borda’s rule. Journal of Economic Theory, 69(1):43–52, 1974.