Vous avez des questions? Nous pouvons vous aider. Pour communiquer directement avec un auteur, consultez la première page de la revue dans laquelle son article a été publié afin de trouver ses coordonnées. Si vous n’arrivez pas à les repérer, communiquez avec nous à [email protected].
Questions? Contact the NRC Publications Archive team at
[email protected]. If you wish to email the authors directly, please see the first page of the publication for their contact information.
https://publications-cnrc.canada.ca/fra/droits
L’accès à ce site Web et l’utilisation de son contenu sont assujettis aux conditions présentées dans le site LISEZ CES CONDITIONS ATTENTIVEMENT AVANT D’UTILISER CE SITE WEB.
READ THESE TERMS AND CONDITIONS CAREFULLY BEFORE USING THIS WEBSITE. https://nrc-publications.canada.ca/eng/copyright
NRC Publications Archive Record / Notice des Archives des publications du CNRC :
https://nrc-publications.canada.ca/eng/view/object/?id=86e729f9-8546-4c45-a53d-17de0fc20b5f https://publications-cnrc.canada.ca/fra/voir/objet/?id=86e729f9-8546-4c45-a53d-17de0fc20b5f
Archives des publications du CNRC
Access and use of this website and the material on it are subject to the Terms and Conditions set forth at
Visual perception under energy-efficient light sources: detection of the
stroboscopic effect under low levels of SVM: final report
FINAL REPORT
Energy Efficient End-use Equipment (4E)
International Energy Agency
Solid State Lighting Annex: Visual Perception under
Energy-Efficient Light Sources
– Detection of the
Stroboscopic Effect under Low Levels of SVM
Final Report:
Visual Perception under Energy-Efficient
Light Sources
– Detection of the
Stroboscopic Effect under Low Levels
of SVM
Jennifer A. Veitch
National Research
Council of Canada
and
Christophe D. Martinsons
Centre Scientifique et
Technique du Bâtiment (France)
Dr. Jennifer A. Veitch Principal Research Officer NRC Construction, Building M-24 National Research Council of Canada 1200 Montreal Road
Ottawa, Ontario, K1A 0R6 Canada
https://nrc.canada.ca/en
Dr. Christophe Martinsons Head of Division
Division of Lighting and Electromagnetic Fields Centre Scientifique et Technique du Bâtiment 24, rue Joseph Fourier
38400 Saint Martin d'Hères France
http://www.cstb.fr/en/
Copyright: © 2019, Her Majesty the Queen in Right of Canada, as represented by the National Research Council of Canada, Ottawa, AND Centre Scientifique et Technique du Bâtiment, Saint Martin d'Hères, France.
This report may not be reproduced in whole or in part without the written consent of both the National Research Council of Canada and the Centre Scientifique et Technique du Bâtiment.
Title-English : Final report: Visual perception under energy-efficient light sources – detection of the stroboscopic effect under low levels of SVM
NRC Report Number: NRCC-CONST-56395 CSTB Report Number: SC-ECE-2019-111
Catalogue number : NR24-38/1-2020E (Print); NR24-38/1-2020E-PDF (PDF) ISBN : 978-0-660-34246-7 (Print); 978-0-660-34245-0 (PDF)
Acknowledgements
The authors are grateful to the governments of Australia, Canada, Denmark, France, Sweden and the United Kingdom for their direct contributions to fund this study, and to the larger IEA 4E SSL Annex for their support and expert assistance with the design and implementation of this project.
Additional support was provided by the National Research Council of Canada High Performance Buildings program (project A1-014733) and by the Centre Scientifique et Technique du Bâtiment through its Health and Comfort Program SEC 2.1.
The authors would like to thank Carsten Dam-Hansen from the Technical University of Denmark and Steve Coyne of Light Naturally (Australia) for their guidance and input in the project design and review of the findings. The authors also wish to express their deep gratitude to Peter Erwin, founder of Der LichtPeter laboratory and internet site, for sharing his knowledge and extensive database of lamps and luminaires, as well as kindly providing some of the LED lamps used by the CSTB in this research. They also thank Naomi Miller of Pacific Northwest National Laboratory in the USA for her assistance in the selection of the LED lamps used by the NRC.
At the National Research Council of Canada, contributing staff included Chantal Arsenault, Erhan Dikel, Steven Kruithof, Sandra Mancini, Travis Moore, Sasa Muradori, and Mark Vuotari. The NRC thanks Prof. Chris Herdman of the Carleton University Applied Cognitive Engineering Laboratory for his assistance with data collection. At the Centre Scientifique et Technique du Bâtiment in France, contributing staff included Nicolas Picard, Jan Jagla and Simon Bailhache. Finally, the authors wish to thank Therese Lindström of Borg & Co. (Sweden) for her kind assistance with an editorial review.
Disclaimer
The authors have made their best endeavours to ensure the accuracy and reliability of the data presented herein, however neither they, the countries sponsoring the research nor the IEA 4E Implementing Agreement make warranties as to the accuracy of data herein nor accept any liability for any action taken or decision made based on the contents of this report. Furthermore, it should be noted that this report is issued as evidence for governments making policy decisions and does not necessarily reflect the views or policies of the governments who are part of the IEA 4E SSL Annex. This report does not mention the lamp brands or models associated with the measured data or analysis. Any products visible in the photographs are included strictly for clarity and ease of understanding and do not represent an endorsement by the IEA 4E, the IEA 4E SSL Annex or any of the member governments.
This document updates the report titled I teri Report: Visual Per eptio u der E ergy-Efficient Light Sources – Dete tio of the “tro os opi Effe t U der Lo Le els of “VM , dated 11 December 2018. This report includes new data and new analyses. A peer-reviewed version of this final report is available:
Veitch JA, Martinsons C. Detection of the stroboscopic effect by young adults varying in sensitivity.
Lighting Research & Technology, in press, 2020.
https://doi.org/10.1177/1477153519898718.
About the IEA 4E Solid State Lighting Annex
The ““L A e as esta lished i u de the f a e o k of the I te atio al E e g Age s
Energy Efficient End-use Equipment (4E) Implementing Agreement to provide advice to its member countries seeking to implement quality assurance programmes for SSL lighting. This international collaboration currently consists of the governments of Australia, Canada, Denmark, France, the Republic of Korea, Sweden and the United Kingdom. Information about the IEA 4E SSL Annex is available online at http://ssl.iea-4e.org/
Table of Contents
Executive Summary ... iii
1. Introduction ... 1
2. Results ... 3
2.1 Sample and lighting details ... 3
2.2 Stroboscopic effect – rotating disc ... 4
2.3 Stroboscopic effect – metronome ... 7
2.4 Acceptability ratings ... 9
2.5 Annoyingness ratings ... 11
2.6 Inter-relationships ... 13
3. Summary and Conclusions ... 13
References ... 16 Method ... A-1 A.1 Research design and hypothesis ... A-1 A.2 Setting and lighting conditions in Canada and France... A-1 A.3 Dependent variables ... A-3 A.3.1 Demographics ... A-3 A.3.2 Pattern glare sensitivity ... A-4 A.3.3 Stroboscopic effect ... A-4 A.3.4 Judgements of light sources ... A-5 A.4 Procedure ... A-6 Supplemental Analyses ... B-1
Executive Summary
Te po al light odulatio TLM, k o ollo uiall as fli ke of light sou es has isual, neurobiological, and performance and cognition effects on viewers. This study aims to address an important gap in the scientific literature on the measurement of levels of TLM of light emitting diode (LED) light sources that may affect human health and productivity.
The outcomes of this research are intended to assist decision makers when developing lighting policy measures and regulations. This study was initially proposed in response to a request for public comment on the draft European ecodesign regulation for lighting before a vote by the European Union (EU) member countries. An interim report was provided in December 2018, and those data were also presented at the CIE 29th Quadrennial Session in June 2019. This final report is based on a
larger data set and contains a more detailed analysis of the subgroups.
The International Electrotechnical Commission (IEC) and the Commission Internationale de l E lai age CIE have identified two metrics which may be measured and used to characterize lighti g s ste s TLM:
• PstLM, short term flicker metric for visible flicker at frequencies below 80 Hz, and
• SVM, Stroboscopic Visibility Measure, for the higher frequency stroboscopic effect. Although the scientific development of these metrics and their associated measurement protocols continues, there is a parallel discussion concerning the appropriate levels of these metrics in regulations. At present there is limited public information concerning the occurrence of the stroboscopic effect under lamps of varying SVM values. To provide further information on levels of SVM, the IEA 4E SSL Annex commissioned this study to test the visibility of the stroboscopic effect for five levels of SVM (targeting values of 0, 0.4–0.6, 1, ~1.6, and >2) using an experimental method similar to previous research from which the metric was developed. The preliminary report was based on a sample of 36 people across two sites (NRC in Canada and CSTB in France). This final report is based on data from 85 people (58 from Canada and 27 from France). The study focused on the effects on people under the age of ~30 because there is evidence that younger people may be more sensitive to TLM.
The decision to place a limit on any metric involves three choices: (1) The acceptable frequency of the outcome occurring in the population; (2) the acceptable proportion of the population who might experience this outcome; and (3) whether there are sensitive individuals in the population, whose needs might be considered to have a higher priority over those who are less sensitive. These choices are value judgements that research can inform but cannot determine. These data provide a first step towards discussions among stakeholder groups about suitable limits on lighting system TLM. The following guidance can be drawn from this work:
An SVM>2.0 caused virtually all of the participants to perceive stroboscopic effects of the rotating disk in every trial, and caused 50% of the participants to perceive stroboscopic effects of the metronome in 5 or more trials out of 8.
The proposed upper limit of SVM=1.6 is higher than the SVM for magnetic-ballasted T12 lamps, which are known to cause headaches and eyestrain and to disrupt eye movements. 25% of the people detected stroboscopic effects with the disk in 7 or more of the 8 trials
(i.e., 88% detection), and 6 or more of the 8 trials (i.e., 75% detection) for the metronome at SVM=1.4 (75th percentile overall). The EU-28 population includes ~101 million people
between the ages of 0–30. Based on the data presented here, SVM=1.6 would mean that on most of the occasions when they were exposed to that condition, one quarter of these 101 million young people could perceive the stroboscopic effect at greater than chance levels for both horizontal and vertical movement.
The 75th percentile detection rate dropped to 2 out of 8 trials (i.e., 25%) when the SVM was
~0.9. This is lower than the chance level of detection.
At SVM levels of 0.4 and below, the disc stroboscopic detection rate for the top quartile of the people dropped to 0.
Those in the population who are more at risk of visual stress (the top 30% of a measure of this risk) are more annoyed by an SVM of ~1.4 or greater than are those who are at low risk, even when the exposure is short (noting that long exposures were not included in this investigation).
1.
Introduction
The introduction of solid-state lighting to the marketplace has brought renewed concern about possible adverse consequences of exposure to temporal cyclic or transient variations in lighting system luminous flux, known as temporal light modulation (TLM), or more commonly referred to as
fli ke . TLM a ha e visual, neurobiological, performance and cognition effects on viewers1-3.
Visual perception effects such as the stroboscopic effect occur very quickly, with very short exposures1-3. TLM can also cause ill effects on a longer time scale, such as disruptions to eye
movements, headaches, and eyestrain1-3. There is not yet expert consensus about all of the possible
health and behavioural effects of TLM, and no single metric to predict their occurrence. This remains an active area for research and standardization4.
The visual perception effects are collectively known as temporal light artefacts (TLA), comprising flicker, the stroboscopic effect, and the phantom array effect. Definitions of these phenomena, proposed TLM frequency ranges for their occurrence, and guidance for possible TLM metrics to p edi t the a tefa ts a e fou d i the Co issio I te atio ale de l E lai age CIE Te h i al Note TN006:20165. TLM can be characterized in several ways, all derived from measurements of the
light output waveform. Among the parameters available to describe TLM are the dominant frequency, the modulation depth, the IES flicker index6, a predictor of visible flicker from the
International Electrotechnical Commission (IEC), called PSTLM 7, the stroboscopic visibility measure
(SVM)5, 7, 8, and the ASSIST Stroboscopic Acceptability Measure9. Others may be developed as
research progresses, and to support the development of new metrics the CIE Technical Committee TC 2-89 is tasked with developing a technical note to describe a rigorous method for measuring and reporting TLM waveforms. Regulators in some regions are considering the importance of
establishing limits on TLM from lighting products under the precautionary principle, to prevent large numbers of long-life light sources coming into use that could adversely affect the health and well-being of the public.
For the present investigation, which concerns the stroboscopic effect, we characterized the independent variable in terms of the SVM. The SVM is a visibility measure that is derived from measurements of the TLM of the light source or lighting system. This characterization of the TLM relates to the visibility of the stroboscopic effect and is scaled such that, by definition, a value of 1 means that the average person would detect the phenomenon 50% of the time; thus, a light source having an SVM value of 1 would mean that the average person can detect the stroboscopic effect 50% of the time when that light source is the sole source of illumination5, 10. As noted by the CIE5 and
the Natio al Ele t i al Ma ufa tu e s Asso iatio NEMA 11, the visibility threshold (i.e., SVM=1)
is not a guarantee of acceptability of the visible phenomenon. At SVM=1.6, the level presented in NEMA 77-2017 (the only published standard containing a suggested SVM level), the average person would detect stroboscopic motion considerably more than 50% of the time, and many people would have an even higher probability of detection, with some people likely to detect it on all exposures to that condition.
There is some evidence of adverse effects that develop over a longer time course of exposure to TLM than occurs in experiments looking for the stroboscopic effect. In particular, the value of SVM of 1.6 is slightly higher than the TLM characteristic of a magnetically-ballasted T12 fluorescent lamp (SVM of 1.3), which prior research established as a cause of disrupted visual performance12, 13 and a
likely cause of headache and eyestrain14. Prior to the development of the SVM, Bullough and
colleagues15 examined the visibility and acceptability of flicker and of the stroboscopic effect across
a range of TLM frequencies, modulation depths, and duty cycles, and obtained data from ten
participants viewing each of nine conditions once, for less than two minutes. The stroboscopic effect was detectable at frequencies up to 300 Hz for a hand waving under the lamp, but acceptability of what had been seen was high for all frequencies at and above 120 Hz (controlling for modulation depth), and when modulation depth was 33% (but not 50% or 100%). A subsequent experiment16,
also with ten participants but changing the task to a wand waved under the light source, found that 100 Hz TLM was detected 80% or more of the time for modulation depths equal to or greater than 25%. The conditions were rated as just acceptable, on average, when the modulation depth was 25%, but unacceptable at higher values of modulation depth. The small sample sizes in these two studies (N=10 each, with more males than females in each one) limit their generalizability to the general population, and the fact that individuals controlled the wand movement risks inconsistency in the visual task.
The most relevant paper to the question of acceptability is that of Perz and colleagues, who
reported a series of experiments as one data set with a combined range of SVM conditions from 0 to 4.9. An unknown number of participants performed various office-work-type tasks for variable amounts of time under varying sets of these conditions, and then rated the acceptability of the room conditions. Based on these data, Perz et al. constructed a logistic function to predict the percentage of annoyed people in relation to SVM, concluding that 20% of the population would be annoyed at an SVM of 1.5, and ~12% at an SVM of 1. It is problematic that there is no information available about the sample size or composition, because it is impossible to assess how generalizable the results might be. Moreover, by combining the results from studies in this way, the function
combines within-subject and between-groups variation, which adds to the difficulty of interpreting the outcomes.
To the best of our knowledge, the published literature does not address the population rates for stroboscopic motion detection under varying levels of “VM. The et i s de elop e t has i luded several experiments, each with samples ranging from 20 to 35 individuals, the data from which show considerable individual variability in responses to TLM10, 17. Perz and colleagues found that the
relationship between the visibility threshold and TLM frequency held for individuals and for the average across individuals10, and on this basis they developed SVM based on an averaging function
across participants, then normalized to provide the definition that at SVM=1, the average individual should detect the stroboscopic effect 50% of the time (the visibility threshold). Data have not been published showing the effect of varying levels of SVM on stroboscopic visibility in the population at large: That is, what proportion of the population do, in fact, detect the stroboscopic effect when SVM=1? Put another way, at what value of SVM does the stroboscopic effect become almost undetectable? This experiment was designed to provide some answers to these questions, although for this experiment the focus was on people under 30 years of age, to increase statistical power by focusing on those thought to be most sensitive18.
This document provides the final findings of a project designed to provide some of the necessary data to support policy- ake s dete i atio of a suita le li it fo “VM. A p eli i a epo t as submitted to the funders in December 2018, and a paper based on that work was presented at the CIE 29th Quadrennial Session in June 201919.) To increase the sample size in the time available and to
ensure applicability of the results around the world, the experiment was conducted at two sites in parallel, using the same experimental design and methods. The two subject test sites were in Ottawa, Canada, led by the Jennifer Veitch at the National Research Council of Canada (NRC), and Saint Martin d'Hères, France, led by Christophe Martinsons at the Centre Scientifique et Technique du Bâtiment (CSTB). Additional support was provided by other experts affiliated with the IEA 4E SSL Annex, particularly Carsten Dam-Hansen (Technical University of Denmark, Roskilde, Denmark) and Steve Coyne (Light Naturally, Brisbane, Australia).
The objectives of the project were as follows:
Test the visibility of the stroboscopic effect for five levels of SVM (targeting 0, 0.4–0.6, ~1, ~1.6, and >2*) using an experimental method as similar as feasible to the published work
from which the metric was developed10, 17, 20, with a target sample size of ~50 people across
the two sites;
Examine the population frequency of pattern glare sensitivity [PGS]21, which is known to
predict sensitivity to headache and disrupted eye movements in response to TLM (see Appendix A, section A.3.2);
If possible, establish preliminary information about the visibility of the stroboscopic effect by individuals high in PGS; and
Collect preliminary information about how people judge the acceptability of their
perceptions under the five SVM levels, in terms of comfort, pleasantness, and annoyingness.
2.
Results
2.1
Sample and lighting details
This final report is based on data from 85 people, 27 tested in France and 58 tested in Canada. Table 1 summarises their characteristics. The samples in the two sites were comparable, although NRC had more female than male volunteers. All participants were university students, and none were older than 32. The limited age range was chosen because there is evidence that younger people may be more sensitive to TLM18, and all had self-reported normal or corrected-to-normal
vision, and normal hearing.
Sensation scores on Pattern 2 of the Wilkins and Evans Pattern Glare Sensitivity test were used as the indicator of a higher risk of visual stress21, 22. There was no difference between NRC and CSTB on
this variable (Mann–Whitney U test, Z=-0.50, p=0.62). The sensation scores for pattern 2 in the full sample correlated moderately with discomfort ratings for viewing that pattern (r=0.31, p=0.004, N=85).† The relationship between pattern 2 sensation scores and discomfort ratings for pattern 2 was very high for CSTB (r=0.53, p=0.005, N=27), whereas it was moderate for NRC (r=0.26, p=0.05, N=58). We considered this adequate evidence for the validity of the pattern 2 sensation scores as the indicator of sensitivity and of risk of visual stress. Therefore, we created a grouping variable (PGS) for this purpose by selecting the top 30% of the full sample, which were the individuals having s o es of o g eate o this a ia le high-PG“ , e sus the lo e 7 % of the sa ple lo -PG“ . We chose this value based on the evidence that for the highest scores on that pattern,
approximately 30% of the population report adverse effects (discomfort)22.
Table 1. The number of participants in each demographic group, shown by location. Sex Age Pattern 2 high score Male Female 18 to 29 30 to 39 (High PGS) Group
CSTB 16 11 26 1 7
NRC 18 40 56 2 19
* The high level of SVM>2 was included to provide a validation of the test method by including a level known to
be above the proposed limit value, and for which it should be the case that stroboscopic effect detection rates would be high.
† Another suggested indicator of pattern glare sensitivity is the difference between responses to pattern 3 and
pattern 221. We have not reported this value because we have learned that scores on pattern 3 may be unduly
LED lamps were selected and purchased from the market to match the five levels of SVM, and hence represent SSL products available in the market in North America and Europe. Although the specific lamps used by the laboratories were different in the two countries, the five experimental conditions were matched in terms of SVM for methodological consistency. PstLM is a metric that characterizes
TLM in the range of 0–80 Hz, which is the range in which viewers can report seeing the temporal variation in light output (flicker). The light sources were chosen to keep PstLM very low to avoid
experimental confounding. Details are available in Appendix A. Table 2 summarizes the key
information about the lamps used at each site, showing that they are similar enough to be expected to produce comparable visual perceptions. Lamps were tested and operated with a clean sinusoidal power supply. At both sites the illuminance on the surface of the rotating disc was in the range 330– 350 lx, the light source correlated colour temperatures (CCT) were in the range of 2700–3000 K, and the CIE general colour rendering index, Ra, was 80–85.
Table 2. Light source characteristics, by site, as measured by the respective research teams. SVM Condition 1 2 3 4 5 CSTB 0 0.43 0.96 1.47 3.09 NRC 0.04 0.42 0.91 1.38 2.80 PstLM Condition 1 2 3 4 5 CSTB 0.39 0.05 0.08 0.26 0.38 NRC 0.05 0.07 0.08 0.06 0.33
2.2
Stroboscopic effect – rotating disc
Participants each completed 10 trials for each of the five lamps. For each trial, the individual looked at a rotating black disc on which was a white spot. The stroboscopic effect occurs when one sees the white spot as a distinct circle that jumps from one location to another. When there is no
stroboscopic effect the white spot looks like an undifferentiated blur. For each trial the individual answered whether or not they saw the stroboscopic effect when looking at the rotating disc. Figure 1 displays this effect using the apparatus in Canada and images taken from an iPhone SE (therefore not necessarily exactly as the human eye would see).
Data from the first two trials were treated as training runs, and not included in the analysis. For each participant, we averaged the responses to trials 3–10 and scaled them out of a score of 8 (detection rate, with theoretical minimum=0 and maximum=8).
The SVM metric was originally developed from this task. It is intended that the average performance for an SVM=1 light source should be a detection rate of 0.50, which would mean a score of 4 in this experiment.
We examined the data to determine whether or not there were meaningful differences using non-parametric tests because the distributions did not meet the assumptions of normality required for parametric tests (e.g., analysis of variance). This is evident, for example, in Figure 2, where the means and medians are not the same for three of the five SVM conditions. Having made this determination for the stroboscopic disc detection (because the experiment was designed to replicate the conditions under which SVM had been developed), we applied the same statistical model to all analyses. In all analyses in this report, the alpha criterion for statistical significance was set to p<0.05.
For every level of SVM, we compared the data from the two locations (CSTB vs NRC) and we compared the data from the groups formed based on high and low pattern glare sensitivity (PGS). These between-groups tests used the Mann–Whitney U test, which is distributed following the
Z distribution. The tests were repeated for each individual SVM level and for an overall score formed
by averaging the detection scores for the five SVM levels.
We also tested for differences between SVM levels in four successive comparisons (0 vs 0.4; 0.4 vs 0.9; 0.9 vs 1.4; 1.4 vs 3). For these repeated measures, we used the Wilcoxon Signed Ranks test. We performed these repeated measures tests both for the combined sample and separately for the two locations and for the high and low pattern sensitivity glare (PGS) groups.
For the rotating disc detection scores, there were no statistically significant differences between the two locations: the outcomes for CSTB and NRC were the same for each SVM level (Table 3) and for the overall average (Mann–Whitney U test, Z=-0.39, p=0.69). Therefore, we present the combined data for the full sample of 85 participants graphically in Figure 2. Looking to the Wilcoxon tests between the SVM levels (Table 3), we see that the distributions of rotating disc stroboscopic detection scores for SVM ~0 and SVM ~0.4 did not differ. The rotating disc detection scores did increase for each successive SVM level, with results that reached the criterion level of statistical significance. The pattern of Wilcoxon test results was similar when the sample was split into two groups by location.
Similarly, there were no statistically significant differences in the Mann–Whitney test results for comparisons between the low and high PGS groups for any SVM level, nor for the overall average (Mann-Whitney U test, Z=-0.01, p=1.00). When the sample was split into these groups, the pattern of results for the Wilcoxon comparisons between the different SVM levels was the same for both groups (Table 3). PGS, an indicator of sensitivity to ill-effects of visual stress, did not predict performance on this stroboscopic visibility task in this experiment.
Table 3. This table displays the results for the stroboscopic detection scores for the rotating disc (N=85). Splitting the sample by testing location, or by PGS, did not change the results.
Descriptive Statistics Wilcoxon Signed Ranks Test
Condition 1 2 3 4 5 1 vs 2 2 vs 3 3 vs 4 4 vs 5 SVM ~0 ~0.4 ~0.9 ~1.4 ~3.0 Z (p) Z (p) Z (p) Z (p) Both sites (N=85) Means (StDev) 0.25 (0.60) 0.34 (0.88) 1.26 (2.11) 4.12 (3.05) 7.92 (0.54) -1.23 (.22) -4.72 (0.000) -7.03 (0.000) -7.09 (0.000) Minimum 0.00 0.00 0.00 0.00 4.00 25th percentile 0.00 0.00 0.00 1.00 8.00 50th percentile 0.00 0.00 0.00 4.00 8.00 75th percentile 0.00 0.00 2.00 7.00 8.00 Maximum 3.00 4.00 8.00 8.00 8.00 CSTB (N=27) Means (StDev) 0.22 (0.51) 0.26 (0.71) 1.48 (2.36) 4.30 (3.20) 8.00 (0.00) -0.45 (0.66) -3.08 (0.002) -3.83 (0.000) -4.04 (0.000) Minimum 0.00 0.00 0.00 0.00 8.00 25th percentile 0.00 0.00 0.00 0.00 8.00 50th percentile 0.00 0.00 0.00 5.00 8.00 75th percentile 0.00 0.00 2.00 7.00 8.00 Maximum 2.00 3.00 8.00 8.00 8.00 NRC (N=58) Means (StDev) 0.26 (0.64) 0.38 (0.95) 1.16 (1.99) 4.03 (3.01) 7.88 (0.65) -1.11 (0.27) -3.59 (0.000) -5.92 (0.000) -5.86 (0.000) Minimum 0.00 0.00 0.00 0.00 4.00 25th percentile 0.00 0.00 0.00 1.00 8.00 50th percentile 0.00 0.00 0.00 4.00 8.00 75th percentile 0.00 0.00 2.00 7.00 8.00 Maximum 3.00 4.00 8.00 8.00 8.00 CSTB vs NRC Z -0.06 -0.48 -0.52 -0.27 -0.97 p 0.95 0.63 0.60 0.79 0.33 Low PGS (N=59) Means (StDev) 0.19 (.43) 0.32 (0.88) 1.10 (1.90) 4.20 (3.14) 7.93 (0.52) -1.57 (0.12) -3.91 (0.000) -5.80 (0.000) -5.80 (0.000) Minimum 0.00 0.00 0.00 0.00 4.00 25th percentile 0.00 0.00 0.00 1.00 8.00 50th percentile 0.00 0.00 0.00 5.00 8.00 75th percentile 0.00 0.00 2.00 8.00 8.00 Maximum 2.00 4.00 8.00 8.00 8.00 High PGS (N=26) Means (StDev) 0.38 (0.85) 0.38 (0.90) 1.62 (2.52) 3.92 (2.88) 7.88 (0.59) -0.72 (0.94) -2.70 (0.000) -4.06 (0.000) -4.12 (0.000) Minimum 0.00 0.00 0.00 0.00 5.00 25th percentile 0.00 0.00 0.00 2.00 8.00 50th percentile 0.00 0.00 0.00 3.50 8.00 75th percentile 0.00 0.00 2.25 7.00 8.00 Maximum 3.00 3.00 8.00 8.00 8.00 Low vs High PGS Z -0.51 -0.29 -0.68 -0.36 -0.58 p 0.61 0.77 0.50 0.72 0.56
Figure 2. This chart shows the detection score for the rotating disc for the full sample at each SVM level, displaying the means in bars and the 25th, 50th, and 75th percentiles overlaid.
2.3
Stroboscopic effect – metronome
In addition to the horizontal rotating disc detection task discussed in section 2.2, the authors developed a new vertical task for this experiment. Participants were told to look at a black dot on a mechanical metronome. For the second round of data collection, both sites used 208 bpm as the speed, replicating Bullough and Marcus23. Only these data (N=50) are reported here. The participants
were asked whether they saw a series of black dots (stroboscopic effect) or if they saw a black blur (no stroboscopic effect detected). The metronome location differed slightly for the NRC and CSTB. At NRC it was farther from the observer than the rotating disk, and slightly to the side, with the white wall of the room behind. At CSTB the line of sight placed the light grey desk surface behind the moving metronome arm. As for the horizontal disc detection task, we used only the responses from the last 8 trials averaging the responses and scaling them to a maximum of 8. One person from CSTB missed several trials of the metronome question and was not included for this variable.
Table 4 shows the results for the full sample and for the split groups by country and PGS. The two sites showed no differences for the metronome detection scores at each level of SVM, and for the overall average (Mann–Whitney U test, Z=-0.13, p=0.89). There also were no differences between the high and low PGS groups on the individual SVM scores, nor on the overall average metronome detection score (Mann–Whitney U test, Z=-1.04, p=0.30).
The Wilcoxon Signed Ranks tests for the full sample showed that the stroboscopic effect detection scores for the three lower SVM values did not differ from one another. However, the stroboscopic effect became more visible at SVM ~1.4 as compared to ~0.90, and still more visible for ~3.0 as compared to ~1.4. There were some differences in the subgroup analysis: At NRC, there was no difference between metronome detection scores at 1.4 and 3.0. For the high-PGS group, there were no differences in metronome detection scores between the levels. Figure 3 displays the descriptive statistics for the full sample as a bar chart.
Table 4. This table displays the results for the stroboscopic detection scores for the metronome beating at 208 bpm at both locations (N= 50).
Descriptive Statistics Wilcoxon Signed Ranks Test
Condition 1 2 3 4 5 1 vs 2 2 vs 3 3 vs 4 4 vs 5 SVM ~0 ~0.4 ~0.9 ~1.4 ~3.0 Z (p) Z (p) Z (p) Z (p) Both sites (N=50) Means (StDev) 3.12 (3.10) 2.82 (3.17) 2.70 (2.78) 3.34 (2.95) 4.12 (3.15) -1.66 (0.10) -0.64 (0.53) -2.93 (0.003) -2.28 (.02) Minimum 0.00 0.00 0.00 0.00 0.00 25th percentile 0.00 0.00 0.00 0.00 0.75 50th percentile 2.00 1.00 2.00 3.00 5.00 75th percentile 6.25 6.25 5.00 6.00 7.00 Maximum 8.00 8.00 8.00 8.00 8.00 CSTB (N= 10) Means (StDev) 2.50 (3.44) 2.70 (3.47) 2.50 (3.17) 3.10 (3.00) 5.50 (2.99) -1.00 (0.32) -0.11 (0.91) -2.45 (0.01) -2.21 (0.03) Minimum 0.00 0.00 0.00 0.00 0.00 25th percentile 0.00 0.00 0.00 0.75 2.00 50th percentile 0.50 1.00 1.50 2.50 7.00 75th percentile 6.50 7.25 5.00 5.75 8.00 Maximum 8.00 8.00 8.00 8.00 8.00 NRC (N=40) Means (StDev) 3.28 (3.04) 2.85 (3.13) 2.75 (2.72) 3.40 (2.98) 3.78 (3.13) -1.87 (0.06) -0.64 (0.53) -2.48 (0.01) -0.90 (0.37) Minimum 0.00 0.00 0.00 0.00 0.00 25th percentile 0.00 0.00 0.00 0.00 0.00 50th percentile 2.50 1.50 2.00 3.00 3.50 75th percentile 6.75 6.00 5.00 6.00 7.00 Maximum 8.00 8.00 8.00 8.00 8.00 CSTB vs NRC Z -0.74 -0.19 -0.46 -0.14 -1.6 p 0.46 0.85 0.65 0.89 0.11 Low PGS (N=38) Means (StDev) 2.89 (3.18) 2.58 (3.17) 2.58 (2.88) 3.18 (3.09) 3.97 (3.34) -1.80 (0.07) -0.020 (0.98) -2.60 (0.01) -2.12 (0.03) Minimum 0.00 0.00 0.00 0.00 0.00 25th percentile 0.00 0.00 0.00 0.00 0.00 50th percentile 2.00 1.00 1.50 2.00 4.50 75th percentile 7.00 6.25 5.00 6.00 7.25 Maximum 8.00 8.00 8.00 8.00 8.00 High PGS (N=12) Means (StDev) 3.83 (2.86) 3.58 (3.18) 3.08 (2.50) 3.83 (2.52) 4.58 (2.50) -0.65 (0.52) -1.14 (0.25) -1.56 (0.12) -.085 (0.40) Minimum 0.00 0.00 0.00 0.00 0.00 25th percentile 0.50 0.25 1.00 2.25 2.25 50th percentile 4.00 3.50 3.00 3.50 5.50 75th percentile 6.00 6.75 5.00 5.75 6.75 Maximum 8.00 8.00 8.00 8.00 8.00 Low vs High PGS Z -0.89 -1.08 -0.92 -0.78 -0.40 p 0.37 0.28 0.36 0.43 0.69
Figure 3. This chart shows the stroboscopic effect detection score for the metronome for the full sample at each SVM level, displaying the means in bars
and the 25th, 50th, and 75th percentiles overlaid.
2.4
Acceptability ratings
Participants rated the acceptability of each light source in terms of comfort, pleasantness, and annoyingness on the tenth block of trials. Although for the interim report, we had combined these to form one scale, the internal reliability analysis showed that the annoyingness rating did not correlate ell to the othe ite s. The efo e, e fo ed o e s ale fo a epta ilit a e agi g the ati gs for comfort and pleasantness (higher scores meaning better conditions, theoretical range 0 [not at all] to [e t e el ] . The C o a h s alpha i di ato of i te al o siste elia ilit fo this t o-item scale was 0.81, which is considered very good. We analysed the annoyingness rating separately as a single rating (see section 2.5).
Table 5 displays the results for the average acceptability ratings and the comparisons between SVM conditions and groups. Overall acceptability hovered around the midpoint of the scale (see Figure 4), and did not differ from one SVM condition to the other. The overall average acceptability (across all SVM conditions) was not different between CSTB and NRC (Mann-Whitney U test, Z=-1.06, p=0.11). Looking at the comparisons between locations, we see statistically significant differences between CSTB and NRC for the acceptability ratings of the conditions SVM ~0.9 and SVM ~1.4. In both cases, the CSTB conditions were rated as slightly more acceptable; however, when considered as a difference in median between 2.0 and 1.5 on a scale of 0–4, the difference is small. There also was one difference between sites in the SVM comparisons, in that at NRC but not at CSTB, with the NRC site showing a drop in acceptability between SVM ~0.40 and SVM ~0.90. This drop is consistent with predictions, but given the absence of consistent effects across the SVM conditions (higher SVM conditions were not any less acceptable), this is probably a chance occurrence.
There were no differences between the PGS groups in the acceptability of the conditions, shown in the individual SVM tests (Table 5), nor in the overall average scores by PGS groups (Mann–Whitney U test, Z=-0.62, p=0.54). Similarly, the two groups showed the same pattern of comparisons across the SVM conditions (Wilcoxon tests).
Table 5. This table displays the results for the acceptability ratings of the light sources, both the descriptive statistics and the comparisons.
Descriptive Statistics Wilcoxon Signed Ranks Test
Condition 1 2 3 4 5 1 vs 2 2 vs 3 3 vs 4 4 vs 5 SVM ~0 ~0.4 ~0.9 ~1.4 ~3.0 Z (p) Z (p) Z (p) Z (p) Both sites (N=85) Means (StDev) 1.90 (0.96) 1.87 (0.98) 1.79 (0.93) 1.85 (1.02) 1.97 (0.96) -0.40 (0.69) -0.68 (0.49) -0.45 (0.65) -1.15 (0.25) Minimum 0.00 0.00 0.00 0.00 0.00 25th percentile 1.50 1.00 1.00 1.00 1.50 50th percentile 2.00 2.00 2.00 1.50 2.00 75th percentile 2.50 2.50 2.50 2.75 2.50 Maximum 4.00 4.00 4.00 4.00 4.00 CSTB (N= 27) Means (StDev) 1.78 (0.74) 1.91 (0.88) 2.13 (0.83) 2.22 (0.80) 2.19 (0.88) -1.08 (0.28) -1.21 (0.23) -0.51 (0.61) -0.08 (0.94) Minimum 0.50 0.00 0.50 0.50 0.00 25th percentile 1.00 1.00 1.50 1.50 1.50 50th percentile 2.00 2.00 2.00 2.00 2.50 75th percentile 2.00 2.50 3.00 3.00 3.00 Maximum 3.00 3.50 4.00 3.50 4.00 NRC (N=58) Means (StDev) 1.96 (1.05) 1.85 (1.03) 1.63 (0.94) 1.67 (1.07) 1.87 (0.99) -1.34 (0.18) -2.01 (0.05) -0.24 (0.81) -1.40 (0.16) Minimum 0.00 0.00 0.00 0.00 0.00 25th percentile 1.50 1.38 1.00 1.00 1.00 50th percentile 2.00 1.75 1.50 1.50 1.75 75th percentile 2.63 2.50 2.13 2.50 2.50 Maximum 4.00 4.00 3.50 4.00 4.00 CSTB vs NRC Z -0.75 -0.21 -2.42 -2.67 -1.58 p 0.46 0.84 0.02 0.01 0.11 Low PGS (N=59) Means (StDev) 1.81 (0.99) 1.83 (1.04) 1.70 (1.01) 1.87 (1.13) 2.06 (0.91) -0.22 (0.83) -1.01 (0.31) -1.16 (0.24) -1.81 (0.07) Minimum 0.00 0.00 0.00 0.00 0.00 25th percentile 1.00 1.00 1.00 1.00 1.50 50th percentile 1.50 1.50 1.50 2.00 2.00 75th percentile 2.50 3.00 2.50 3.00 2.50 Maximum 4.00 4.00 4.00 4.00 4.00 High PGS (N=26) Means (StDev) 2.12 (0.88) 1.96 (0.85) 1.98 (0.70) 1.79 (0.74) 1.77 (1.07) -1.00 (0.32) -0.49 (0.49) -0.93 (0.35) -0.58 (0.56) Minimum 0.50 0.00 0.50 0.50 0.00 25th percentile 1.50 1.50 1.50 1.00 1.00 50th percentile 2.00 2.00 2.00 1.50 1.50 75th percentile 3.00 2.50 2.50 2.50 2.50 Maximum 4.00 3.50 3.50 3.00 4.00 Low vs High PGS Z -1.54 -0.73 -1.36 -0.40 -1.42 p 0.12 0.46 0.17 0.69 0.16
Figure 4. The acceptability of the light conditions in these short exposures did not differ by SVM condition.
2.5
Annoyingness ratings
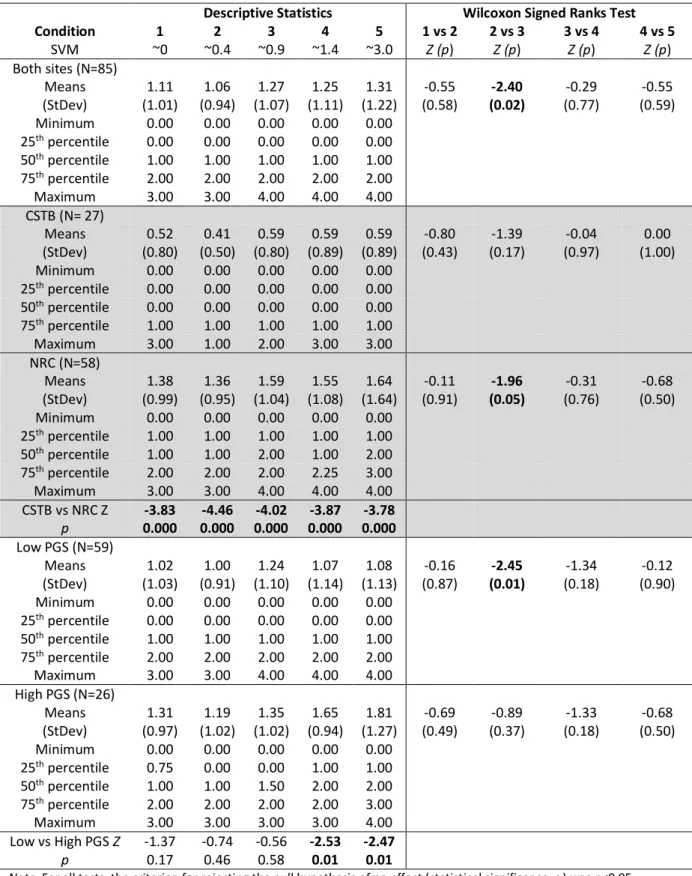
Participants rated the annoyingness of each light source once, on the tenth block of trials. This was a single question rated on a scale from 0 (not at all) to 4 (extremely). Table 6 displays the results for this variable both for the overall sample, and for the subgroups formed by the location (CSTB or NRC) and by the PGS score.
There were differences in responding between CSTB and NRC on the ratings for each SVM level, and in their overall average annoyingness ratings (Mann–Whitney U test, Z=-4.85, p=0.000). The CSTB participants rated their light sources as consistently less annoying than the NRC participants. Note that the CSTB sessions took place in French and the NRC sessions took place in English (see Appendix A for translation). We cannot rule out the possibility that the difference in annoyingness ratings reflects a translation effect; perhaps the words used in the two languages had subtly different meanings. It is also possible that the difference reflects the fact that the dominant frequency of the TLM was 100 Hz for CSTB and 120 Hz for NRC; however, this seems unlikely to explain the difference for two reasons. First, there was no difference in perception between the two countries, as one might expect if the dominant frequency influenced perception directly23. Second,
the direction of this effect is opposite to what would be expected; the lower frequency should be more easily detected and, by extension, more annoying. Overall, the language difference seems the most likely explanation.
Looking at the comparisons between SVM levels within the two sites, we see that none of the comparisons showed any statistically significant differences in the CSTB data. Within the NRC data, there was an increase in annoyingness between SVM ~0.40 and SVM ~0.90. The higher level of annoyingness persisted among the NRC participants for SVM ~1.4 and SVM ~ 3.0.
The split of the data set based on PGS scores also showed differences between the groups in the annoyingness ratings. These were as one would expect, with annoyingness ratings being higher for the high-PGS participants: There was an overall difference in average annoyingness between PGS groups (Mann–Whitney U test, Z=-2.12, p=0.03; low-PGS median=0.80 and high-PGS median=1.5 ). For SVM ~1.4 and SVM ~3.0, annoyingness was higher for the people higher in PGS. The high-PGS group showed no statistically significant differences in annoyingness ratings in the comparisons between the SVM conditions, but the low-PGS group showed a small increase in annoyingness for SVM ~0.90 in comparison to SVM ~0.40.
Table 6. This table displays the results for the annoyingness ratings of the light sources, both the descriptive statistics and the comparisons.
Descriptive Statistics Wilcoxon Signed Ranks Test
Condition 1 2 3 4 5 1 vs 2 2 vs 3 3 vs 4 4 vs 5 SVM ~0 ~0.4 ~0.9 ~1.4 ~3.0 Z (p) Z (p) Z (p) Z (p) Both sites (N=85) Means (StDev) 1.11 (1.01) 1.06 (0.94) 1.27 (1.07) 1.25 (1.11) 1.31 (1.22) -0.55 (0.58) -2.40 (0.02) -0.29 (0.77) -0.55 (0.59) Minimum 0.00 0.00 0.00 0.00 0.00 25th percentile 0.00 0.00 0.00 0.00 0.00 50th percentile 1.00 1.00 1.00 1.00 1.00 75th percentile 2.00 2.00 2.00 2.00 2.00 Maximum 3.00 3.00 4.00 4.00 4.00 CSTB (N= 27) Means (StDev) 0.52 (0.80) 0.41 (0.50) 0.59 (0.80) 0.59 (0.89) 0.59 (0.89) -0.80 (0.43) -1.39 (0.17) -0.04 (0.97) 0.00 (1.00) Minimum 0.00 0.00 0.00 0.00 0.00 25th percentile 0.00 0.00 0.00 0.00 0.00 50th percentile 0.00 0.00 0.00 0.00 0.00 75th percentile 1.00 1.00 1.00 1.00 1.00 Maximum 3.00 1.00 2.00 3.00 3.00 NRC (N=58) Means (StDev) 1.38 (0.99) 1.36 (0.95) 1.59 (1.04) 1.55 (1.08) 1.64 (1.64) -0.11 (0.91) -1.96 (0.05) -0.31 (0.76) -0.68 (0.50) Minimum 0.00 0.00 0.00 0.00 0.00 25th percentile 1.00 1.00 1.00 1.00 1.00 50th percentile 1.00 1.00 2.00 1.00 2.00 75th percentile 2.00 2.00 2.00 2.25 3.00 Maximum 3.00 3.00 4.00 4.00 4.00 CSTB vs NRC Z -3.83 -4.46 -4.02 -3.87 -3.78 p 0.000 0.000 0.000 0.000 0.000 Low PGS (N=59) Means (StDev) 1.02 (1.03) 1.00 (0.91) 1.24 (1.10) 1.07 (1.14) 1.08 (1.13) -0.16 (0.87) -2.45 (0.01) -1.34 (0.18) -0.12 (0.90) Minimum 0.00 0.00 0.00 0.00 0.00 25th percentile 0.00 0.00 0.00 0.00 0.00 50th percentile 1.00 1.00 1.00 1.00 1.00 75th percentile 2.00 2.00 2.00 2.00 2.00 Maximum 3.00 3.00 4.00 4.00 4.00 High PGS (N=26) Means (StDev) 1.31 (0.97) 1.19 (1.02) 1.35 (1.02) 1.65 (0.94) 1.81 (1.27) -0.69 (0.49) -0.89 (0.37) -1.33 (0.18) -0.68 (0.50) Minimum 0.00 0.00 0.00 0.00 0.00 25th percentile 0.75 0.00 0.00 1.00 1.00 50th percentile 1.00 1.00 1.50 2.00 2.00 75th percentile 2.00 2.00 2.00 2.00 3.00 Maximum 3.00 3.00 3.00 3.00 4.00
occurred following a very short exposure to the conditions. Longer exposures could be expected to lead to different outcomes.
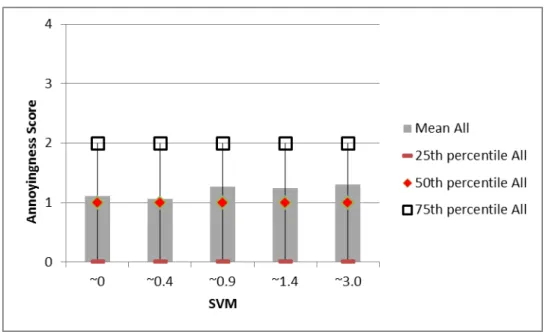
Figure 5. The annoyingness of the light conditions in these short exposures showed a small increase between SVM ~0.40 and SVM ~0.90 in the full sample.
2.6
Inter-relationships
As a final step to understand and to validate the pattern of responses, we explored the correlations between six variables: pattern 2 sensation scores; discomfort ratings of pattern 2; average
stroboscopic effect detection of the rotating disc; average stroboscopic effect detection of the metronome (high speed only); average acceptability rating; and, average annoyingness rating. Appendix B shows the results for the full sample and when split by location (CSTB and NRC) and by low vs high PGS.
The intercorrelations show that people who tended to see the stroboscopic effect for the rotating disc also tended to see it for the metronome (r=0.40, p=0.004, N=50). Average acceptability was negatively correlated with average annoyingness (r=-0.22, p=0.04, N=85) and with the discomfort experienced in response to pattern 2 (r=-0.26, p=0.02, N=85).
3.
Summary and Conclusions
In the preparations for this experiment, both laboratories acquired a variety of commercially available LED replacement lamps that are available on the North American and European markets today. In the laboratory the lamps were measured under clean sinusoidal power supply conditions and found to exhibit a wide range of TLM characteristics, from nearly none to very high SVM. In the absence of consensus concerning the best metric with which to characterise TLM, and with no requirement for package labelling or product technical specifications to report TLM characteristics (noting that it is uncertain as to whether consumers would understand this metric if declared), there is no way for a consumer to know what the TLM performance of a product will be prior to its use. Each laboratory selected five lamps for this experiment, based on their SVM characteristics, taking care to seek similar performance at each chosen level to permit the data to be combined. The primary visual perception task in this experiment was carefully chosen to replicate the rotating disc task with which the SVM was developed10, 17, 20. The metric is defined such that the average person
The results of this experiment showed that, under these experimental conditions, the average rotating disc detection was lower than expected. For this SVM=0.9 condition, the average score was 1.26 (out of 8) and only 25% of the people scored above 2 out of 8. The definition of SVM would lead to the expectation that the average should be closer to 3, or perhaps close to 4, when SVM
approaches 1.0. There were individuals who scored as high as 8 when SVM was ~0.90, but they were few. The 90th percentile was 5.4 at SVM ~0.90, indicating that 10% of the population scored higher
than this. For SVM ~1.4, half of the sample scored more than the threshold detection (4 out of 8) and 25% of the sample scored 7 or 8.
The conference paper based on interim data from this project reported few results for the
metronome stroboscopic detection19, but the additional data reported here were collected after the
task was changed to have the metronome move at 208 bpm. Bullough and Marcus23 reported that a
logarithmic function of the SVM values of their range of experimental conditions explained 79% of the variance in average metronome detection at 100 Hz, which compares very well to the 78% explained variance for the data reported here (excluding our SVM=0 condition, for which a log function cannot be fit). This consistency gives us greater confidence in the interpretation of the metronome detection results. Most notably, the increases in metronome detection scores between SVM ~0.9 and SVM ~1.4, and between SVM ~1.4 and SVM ~3.0, were statistically significant. The judgements of acceptability (pleasantness and comfort average) did not show any consistent relation to SVM, but over the whole sample, annoyingness did increase from SVM ~0.4 to SVM ~0.9 and stayed at that level as SVM increased further. Annoyingness was higher for the NRC participants than the CSTB participants, a difference that could have been caused unintentionally in the
translation from the English used at NRC to the French used at CSTB.
This larger sample of 85 people across the two sites was sufficiently large to permit the examination of results by comparing people expected to be at risk of visual stress (those with high sensation scores when looking at pattern 2 of the Wilkins and Evans Pattern Glare Sensitivity Test21), and those
whose risk would be low. Visual stress is a syndrome characterized by headache and the occurrence of unwanted visual illusions. The results of this investigation did not find that stroboscopic detection of either the horizontal rotating disc or the vertical metronome differed between these groups. The acceptability ratings also did not differ; however, the more sensitive group (high-PGS) did report greater annoyance with the SVM ~1.4 and SVM ~3.0 conditions than those less sensitive. The following are the limitations of this experiment that were identified:
A greater number of female than male participants overall because of the participation rate at the NRC site;
Only young participants, although this could provide guidance on the upper limit of detection, as older people might be less sensitive;
Similarly, a limited range of eye colour and ethnicity in the sample might have excluded some sensitive individuals;
Short viewing times;
Only an overhead view of the horizontal task and a straight-on view of the vertical task; other geometries of moving objects should be investigated;
Only 5 SVM levels, leaving gaps where information is lacking;
Non-immersive surroundings, which had been the setting for prior research; perhaps SVM becomes more annoying as one moves around the space; and,
evidence and the tolerance for risk4. Discussions concerning the best metrics to characterise TLM
and suitable limits for them are expected to continue, but in the meantime our lit environment is being transformed by long life SSL products on the market today, some of which have very high SVM values. This experiment has been conducted to contribute data for discussions concerning limit values for TLM where, at present, very limited evidence exists11, 24.
The decision to place a limit on any metric involves two choices: (1) the acceptable frequency of the outcome occurring; and (2) the acceptable proportion of the population who might experience this outcome4. These choices are value judgements that research can inform but cannot determine.
As a first step towards discussions among stakeholder groups about suitable limits on lighting system TLM, the following guidance can be drawn from this work:
An SVM>2.0 caused virtually all of the participants to perceive stroboscopic effects of the rotating disk in every trial, and caused 50% of the participants to perceive stroboscopic effects of the metronome in 5 or more trials out of 8.
The proposed upper limit of SVM=1.6 is higher than the SVM for magnetic-ballasted T12 lamps11, which are known to cause headaches and eyestrain and to disrupt eye
movements12-14.
25% of the people detected stroboscopic effects with the disk in 7 or more of the 8 trials (i.e., 88% detection), and 6 or more of the 8 trials (i.e., 75% detection) for the metronome at SVM=1.4 (75th percentile overall). The EU-28 population includes ~101 million people
between the ages of 0–30. Based on the data presented here, SVM=1.6 would mean that on most of the occasions when they were exposed to that condition, one quarter of these 101 million young people could perceive the stroboscopic effect at greater than chance levels for both horizontal and vertical movement.
The 75th percentile detection rate dropped to 2 out of 8 trials (i.e., 25%) when the SVM was
~0.9. This is lower than the chance level of detection.
At SVM levels of 0.4 and below, the disc stroboscopic detection rate for the top quartile of the people dropped to 0.
Those in the population who are more at risk of visual stress (the top 30% of a measure of this risk) are more annoyed by an SVM of ~1.4 or greater than are those who are at low risk, even when the exposure is short (noting that long exposures were not included in this investigation).
References
1. Wilkins AJ, Veitch JA, Lehman B. LED lighting flicker and potential health concerns: IEEE Standard PAR1789 update. Proceedings of the Energy Conversion Congress and Exposition
(ECCE) 2010 IEEE, 12-16 Sept, 2010. New York, NY: Institute of Electrical and Electronics
Engineers; 2010. p. 171-8.
2. IEEE Power Electronics Society. IEEE recommended practices for modulating current in
high-brightness LEDs for mitigating health risks to viewers. S1789-2015 New York, NY: Institute
for Electrical and Electronics Engineers, Inc. (IEEE). 2015.
3. Wilkins AJ. A physiological basis for visual discomfort: Application in lighting design. Lighting
Research and Technology. 2016;48(1):44-54.
4. Co issio I te atio ale de l E lai age CIE . Final report CIE stakeholder workshop for
temporal light modulation standards for lighting systems CIE TN 008:2017 Vienna, Austria:
CIE, 2017.
5. Commission Internationale de l E lai age CIE . Visual aspects of time-modulated lighting
systems – Definitions and measurement models. TN 006-2016 Vienna, Austria: CIE, 2016.
6. DiLaura DL, Houser KW, Mistrick RG, Steffy GR. The lighting handbook. 10th ed. New York: Illuminating Engineering Society of North America; 2011.
7. International Electrotechnical Commission (IEC). Equipment for general lighting purposes -
EMC immunity requirements - Part 1: An objective light flickermeter and voltage fluctuation immunity test method. IEC TR 61547-1:2017 Geneva, Switzerland: IEC, 2017.
8. International Electrotechnical Commission (IEC). Equipment for general lighting purposes -
Objective test method for stroboscopic effects of lighting equipment. IEC TR 63158:2018
Geneva, Switzerland: IEC, 2018.
9. Alliance for Solid-State Illumination Systems and Technologies (ASSIST). ASSIST
recommends...Evaluating light source flicker for stroboscopic effects and general
acceptability. Vol. 11(4) Troy, NY, USA: Lighting Research Center, Rensselaer Polytechnic
Institute., 2017.
10. Perz M, Vogels IMLC, Sekulovski D, Wang LL, Tu Y, Heynderickx IEJ. Modeling the visibility of the stroboscopic effect occurring in temporally modulated light systems. Lighting Research
and Technology. [Article]. 2015;47(3):281-300.
11. National Electrical Manufacturers Association (NEMA) Lighting Systems Division. Standard
for temporal light artifacts: Test methods and guidance for acceptance criteria. NEMA
77-2017 Rosslyn, VA: NEMA, 77-2017.
12. Veitch JA, McColl SL. Modulation of fluorescent light: Flicker rate and light source effects on visual performance and visual comfort. Lighting Research and Technology. 1995;27(4):243-56.
13. Wilkins AJ. Intermittent illumination from visual display units and fluorescent lighting affects movement of the eyes across text. Human Factors. 1986;28(1):75-81.
16. Bullough JD, Sweater Hickcox K, Klein TR, Lok A, Narendran N. Detection and acceptability of stroboscopic effects from flicker. Lighting Research and Technology. 2012;44(4):477-83. 17. Vogels IM, Sekulovski D, Perz M. Visible artefacts of LEDs. Proceedings of the 27th Session of
the Commission Internationale de l'Eclairage, Sun City, South Africa. Vienna, Austria: CIE;
2011. p. 42-51.
18. Brundrett GW. Human sensitivity to flicker. Lighting Research and Technology. 1974;6(3):127-43.
19. Veitch JA, Martinsons C. Detection of the stroboscopic effect under low levels of the stroboscopic visibility measure. Proceedings of the 29th CIE Quadrennial Session, June
16-22, Washington, DC, USA. Vienna, Austria: Commission Internationale de l'Eclairage; 2019. p.
682-91.
20. Perz M, Sekulovski D, Vogels IM, Heynderickx IEJ. Stroboscopic effect: Contrast threshold function and dependence on illumination level. Journal of the Optical Society of America A:
Optics and Image Science, and Vision. [Article]. 2018;35(2):309-19.
21. Wilkins AJ, Evans BJW. I.O.O. Pattern Glare Test. London, UK: i.O.O Sales Ltd.; 2012. 22. Wilkins AJ, Allen PM, Monger LJ, Gilchrist JM. Visual stress and dyslexia for the practicing
optometrist. Optometry in Practice. 2016;17(2):103-12.
23. Bullough JD, Marcus D. Influence of flicker characteristics on stroboscopic effects. Lighting
Research & Technology. 2016;48(7):857-70.
24. Perz M, Sekulovski D, Beeckman P. Acceptability criteria for the stroboscopic effect visiblity measure. Proceedings of the Conference "Smarter Lighting for Better Life" at the CIE
Midterm Meeting 2017, October 23-25, 2017, Jeju, South Korea. Vienna, Austria: Commission
Internationale de l'Eclairage; 2017. p. 453-9.
25. European Commission. Draft commission regulation laying down ecodesign requirements for
light sources and separate control gears pursuant to Directive 2009/125/EC of the European Parliament and of the Council and repealing Commission Regulations (EC) No 244/2009, (EC) No 245/2009 and (EU) No 1194/2012 Brussels, Belgium: European Commission, 2018,
October 6.
26. Whissell CM. Sex, eye-color, and aesthetic ratings of colors. Perceptual and Motor Skills. 1980;51(3, Pt 1):1012-4.
Method
In Canada, this research protocol was reviewed and approved by the National Research Council of Canada Research Ethics Board (Protocol 2018-129) and by the Carleton University Research Ethics Board-B (CUREB-B Clearance # 109982).
This research complies with the EU and French General Data Protection Regulation (GDPR).
A.1
Research design and hypothesis
This is a repeated-measures experiment with 5 levels of the independent variable, light source. The five light sources were commercially available products chosen because they are known to exhibit the chosen levels of the metric SVM7, 8, 10. They were chosen based on the following criteria: about
800 lm output; ~2600–3000 K correlated colour temperature; PstLM<<1, and having the target SVM
values (0, 0.4–0.6, ~1, ~1.6, and >2). These values were chosen to provide a range of data for conditions at and below the proposed regulatory limit being considered in Europe (SVM upper limit of 1.6)25, and one condition considerably higher as a manipulation check. To the extent possible,
chromaticity coordinates were matched, although this was dependent on the existence of alternatives at any given SVM value.
Participants performed 50 trials in total, 10 blocks of five light source conditions. Within each block the order of presentation was random.
Data were collected in parallel using this same procedure by teams in Canada (NRC) and in France (CSTB). The results presented in this report are based on a combination of the data in a mixed design for analysis (site being a between-groups variable, and light source a repeated measures variable). The hypotheses to be tested were:
H1: The visibility of the stroboscopic effect is 50% for SVM=1. (This is the definition of the metric.)
H2: The visibility of the stroboscopic effect increases with increasing SVM.
H3: Comfort and pleasantness drop with increasing SVM, and annoyingness increase with increasing SVM.
A.2
Setting and lighting conditions in Canada and France
Testing occurred in a dedicated small windowless room. The room was minimally furnished with a desk and chairs. During the session trials all the illumination came from the custom desktop luminaire described below. During the instructions and demographic questionnaires, a desk lamp with the low-SVM condition was used on a separate desk from the one holding the apparatus (see photos).
The custom luminaire consisted of an aluminum frame supporting a light box. The central light box had six chambers, in each of which was a standard E27 socket. Five locations were used, each with one of the five lamps (described below). All lamps were powered continuously during the session to maintain constant temperature and light output.
At NRC, the light box drum could be rotated such that one chamber was located over an aperture that allowed light to fall onto the desk surface, while the other lamps were blocked by the plywood
The height of the luminaire was adjusted once so that all the lamps delivered ~330 lx on the surface of the principal task, a rotating disk (see below). There were no sides to the frame, so that viewers had the full field of view available to them and light from the luminaire could provide ambient illumination for the rest of the room beyond the desk on which it sits. An uninterruptible power supply was used by NRC to ensure clean power for the luminaire during testing. A laboratory specification AC power supply was used by CSTB for the same purpose.
Figure A1. Images of the NRC apparatus installed in the test room. For the image on the left, the hallway outside provided ambient light for the photograph, but the door was closed during testing. The image on the right shows the desk surface as seen by the participant.
Figure A2. Images of the CSTB apparatus installed in the test room.
Each laboratory characterized its light sources based on measurements made under the light box at the location of the rotating disc (see Table A1).
Table A1. NRC and CSTB test lamp characteristics claimed CCT and luminous flux, and light characteristics measured horizontally at the location of the rotating disk under the light box for each of the five lighting conditions.
Condition CCT (label) [K] Lum. flux (claim) [lm] Illum (meas) [lx] CCT (meas) [K] Ra (meas) Duv (meas) Dominant Frequency [Hz] Modu-lation [%] Flicker Index [%] PstLM SVM NRC-1 2700 800 341 2872 83 -0.0008 120 4.7 0.43 0.05 0.04 NRC-2 2700 800 319 3018 84 -0.0016 120 14.0 3.79 0.07 0.42 NRC-3 2700 800 354 2717 83 -0.0001 120 32.0 8.47 0.08 0.91 NRC-4 3000 800 334 3094 83 -0.0023 120 55.6 13.25 0.06 1.38 NRC-5 3000 800 335 3027 83 -0.0003 120 91.5 29.99 0.33 2.80 CSTB-1 2700 806 344 2756 83 0.00001 100 2.1 0.6 0.39 0.00 CSTB-2 2700 810 330 2810 82 0.0009 100 11.8 3.7 0.05 0.43 CSTB-3 2600 720 318 2559 90 0.0022 100 27.8 7.9 0.08 0.96 CSTB-4 2700 810 312 2641 81 0.0016 100 40.2 12.3 0.26 1.47 CSTB-5 2700 600 324 2799 80 0.0022 100 79.4 26.9 0.38 3.09
A.3
Dependent variables
The same questions and tasks were used in both countries. They were originally written in English and translated to French at CSTB.
A.3.1 Demographics
At the start of the session (after signing the Agreement to Participate), participants answered demographic questions with paper and pen on the desk surface, under the lowest SVM condition. These questions are shown in Table A2.
Table A2. Demographic questions.
What is your sex? 0 Male 1 Female 2 Prefer not to say
How old are you? 0 18 to 29 1 30 to 39 2 0 to 49 3 50 to 59 4 60 and older What type of
correction lenses do you have today?
0 None 1 Reading Glasses 2 Distance Glasses 3 Bi- or Trifocal Lenses 4 Gradual or Multi-focal Lenses 5 Contact Lenses
Have you ever been diagnosed with a hearing impairment?
0 No 1 Yes
Do you use any form of hearing aid?
0 No 1 Yes
What best describes your eye colour? We ask because there is evidence that eye colour predicts some visual perceptions although the mechanism for this is
0 Blue 1 Grey 2 Green 3 Light brown 4 Brown or black