i.-^'-a*;;
^PH
i
RESEARCH PROGRAM ON THE ORGANIZATION AND MANAGEMENT OF RESEARCH AND DEVELOPMENT
The Analysis of Large Scale R&D Programs:
A Case Study of Project Mercury Archie L: Wood
#115-65 March 1965
This working paper is the first in a series of reports on studies
of New Approaches to Program Management, under the general direction
of Professor Edward B. Roberts. Other publications of this series now
being prepared include additional case study analyses of space programs and an investigation of the effectiveness of incentive contracts in
research and development. These research undertakings have all been supported by grant NaNsG 235-62 of the National Aeronautics and Space Administration to the M.I.T. Sloan School of Management.
ABSTRACT
This paper is the first of a planned series of analyses of large-scale
research and development programs. The objectives of this study are threefold:
(1) to develop better understanding of the principal causes of program
results in large-scale technological undertakings;
(2) to create new analytic and predictive tools for assessing the future
course of programs planned and in-process;
(3) to attempt application of these new approaches to a set of on-going
programs, both as a test of the methods and as a possible source of contribulon
to program effectiveness.
In carrying out these analyses major projects of the United States space flight program have been selected for individual and comparative case study.
The results of the initial phase of this research ars described in this paper. It describes a case study of Project Mercury, the United States' first manned space flight venture. The paper attempts:
(1) to document authoritatively but concisely, from a program management
viewpoint, the technical, schedule, and financial results of Project Mercury;
(2) to trace the project's evolution from its inception in 1958 through
its completion in 1963;
(3) to draw from analysis of these data descriptions of the underlying
policies and processes by which the project was conducted;
(4) to utilize these data and descriptions as contributors to the over-all purposes of the study, as outlined above, broadly the development of new approaches for program management.
The research documented in this paper confirms the popularly-held view
of the technical success of Project Mercury. It also concludes that the project was restricted to its original objectives, but that the perceived
cost went from an original budget of about $200 million to a final actual cost of $384.1 million. Furthermore, the first manned Mercury flight was
22 months later than initially scheduled and the entire project duration was about 30 months longer than scheduled. The research further concludes that
these results of Project Mercury are consistent with those of earlier programs similar in size and technological character, but sponsored by the various United States military services.
This paper draws inferences that:
(1) a tendency (no doubt a necessary one) to decide nearly all issues with astronaut safety as a paramount criterion contributed to the cost growth
and schedule slippage;
(2) factors such as a very short design schedule and the heterogeneity
of pertinent technologies resulted in a relatively inferior systems engineering
(3) the capsule systems engineering problems resulted in subsequent
slippages and additional costs due to resultant difficulties in flight
pre-paration;
(4) other factors contributing to cost growth and schedule slippage
were (a) a lack of system and program definition at the program outset, and
(b) technological risk due primarily to system unreliability.
CASE STUDY OF PROJECT MERCURY
Background
Project Mercury was the first program carried out by the United States
to put man in space. The program was conducted by the National Aeronautics and Space Administration, and was initiated in late 1958, just after the
es-tablishment of N.A.S.A. By early 1959 N.A.S.A. had let the contract for the
manned satellite capsule; by the summer of 1959, proposals were in N.A.S.A. 's
hands for the tracking network. These were the two largest developmental
ele-ments of the program.
The program was planned to use existing boosters--Redstone, Jupiter and Atlas.
As is well known, the program was highly successful, resulting in six successful manned space flights ranging from Redstone flights of a few minutes to a final one-day orbital flight.
There are aspects of the Mercury Project, however, that need analysis
for the inferences that can be drawn for use in the future. Such questions
as the following present themselves: What were the stated objectives and the
real objectives of Project Mercury? Was the Mercury Program carried out on schedule? If not, why? Was the program executed within the projected budget?
If not, why? What was the "risk" content of Project Mercury? Did the expec-tations of problems materialize? What was the program content in terms of objectives? Were these contents realized by the program as executed? If not,
what were the underlying reasons? If the problems experienced fell short of expectations, what might the program have cost if these expectations had been realized?
domain, is an attempt to answer some of these questions and to draw some of
the inferences that might be useful in the future.
Planned and Accomplished Objectives
The announced objectives as of late 1959 of Project Mercury were three:
1. To place a manned space capsule in orbital flight around the earth; 2. To investigate man's performance capabilities and ability to
sur-vive in a true space environment?
3. To recover the capsule and the man safely.
Technical Requirements of Project Mercury and the State of Existing Technology
The Mercury mission to achieve these objectives can be divided into seven "phases". Each phase contains some of the primary technical require-ments imposed by the mission objectives and by the environment. The phases are shown schematically in Figure 1 on the next page. Each of the phases of Figure 1 can be further broken down into individual functions to be performed;
however, analysis of even so simplified a representation as that above permits
an overall comparison of the state of existing technology in late 1958 with Mercury requirements.
Launch Preparation. This mission phase is simply the countdown. In
Mercury it presented few problems not already met and solved in the many mis-sile countdowns conducted by both NASA and the military by late 1958. The
-3 u « > o u -> (0 c a V o w
Q
-U
h^
U V (0 U fl "O J3 4J ig 'O a u a CO a ea 4J c I «*=£
o
COX
o
u w C 73 0>SCO
c o 3 U Id U3 V M (0 Oo
-4
presence of the astronaut did not modify the countdown in any particularly unusual way other than for the safety requirements his presence imposed. Obviously new psychological pressures were felt due to concern for his safety. No requirements for launch at a predicted time existed.
Launch and Boost. The launch and boost phase of the Mercury mission
was of course a complex process requiring guidance and control, propulsion,
and almost an infinity of other detailed functions. Each of these had been carried out previously, however, with existing ballistic missiles, in
partic-ular. Atlas, Thor, Jupiter, and Redstone, to name the most obvious examples. Redstone had orbited objects by late 1958 and the Atlas had flown some 6300
2
miles in tests at Cape Canaveral. At that time Atlas had been in flight
test for about 18 months^ and Redstone for about 5 years.^ It would appear that other than for reliability and safety a straightforward adaptation of
one or more of these vehicles to the Mercury Project would meet Mercury needs. The problem of safety and realiability, two tightly interwoven require-ments, are discussed separately below. However, since escape during launch
is an integral part of the launch phase it is discussed here.
Safety during launch consisted primarily of extracting the astronaut from the launch vehicle in event of a launch vehicle abort. This required first a system to sense the presence of an incipient or actual aborted mission and, second, a means of removing the astronaut, separately, or capsule and all,
from the vicinity of the launch vehicle. Although these requirements had not
been met before, their satisfaction was straightforward and certainly no new technology was required. The tractor rockets on the capsule escape tower and
the abort sensing and implementation system were designed to satisfy these
-5
In short, launch technology had developed sufficiently by late 1958 that high confidence in the ability to launch the Mercury capsule into orbit was warranted. Little if any new development was required since existing boosters could be adapted to the purpose. The main area of reasonable
con-cern was booster reliability.
Orbital Flight. The orbital phase of the Mercury mission imposed few
new requirements and none that had not been met at least partially by other previously developed equipment. Among these requirements were:
1. Protection from the hard vacuum of space;
2. Protection from radiation;
3. Protection from micro-meteorite impact;
4. Provision of life support in the form of environmental control, breathing gases, and waste disposal (or storage);
5. Support and protection of the astronaut during exist and re-entry accelerations;
6. Attitude control capability;
7. Sufficient automatic controls and/or command capability to permit recovery even if the astronaut were incapacitated;
8. Systems to initiate departure from orbit, i.e., controls, instru-ments, and retro-rockets.
The functional needs of the orbital phase had been satisfied at least partially
in existing systems. A complicating factor, however, was weightlessness, a
new environmental element. High altitude high performance aircraft then in operation contained systems embodying most of the technology of the life support system required as well as cockpits capable of maintaining reasonable environ-ments even in the extreme upper reaches of the atmosphere. Radiation protection
-6
nificant problems since no treatment of these hazards is present in literature surveyed for this study.
Attitude control systems using thrusters (reaction controls) were being built in late 1958 in the X-15 and installed experimentally in F-104's for
certain flight tests. NASA was flying an "iron cross" using thrusters for
controls.
The iron cross was a rigidly constructed cross configured device mounted
on a gimbal near its center of gravity. Also on the cross was a rudimentary
cockpit and a reaction control system. A pilot could fly the device from the
cockpit, and since the device's response to an application of thrust at one
of its extremities was an angular acceleration, it simulated the dynamics of
attitude control of a spacecraft.
Instruments for attitude control and initiating departure from orbit were either available or were easily designed using existing technology.
Support of the astronaut during high accelerations was shown to be
fea-sible in July 1958 through use of contour couches.
Perhaps the major challenge of the space capsule was the systems
engineer-ing job of reliably meeting all imposed requirements in a high performance
spacecraft and integrating this craft with the launch vehicles, ground equip-ment, and maintenance and test equipment. Clearly many technological disci-plines were involved and many varieties of equipment were required in the
capsule. This, no doubt, complicated the system engineering job further. Re-entry. The re-entry phase was probably the phase about which least
was known. However, the ballistic missile programs had by late 1958 flown both ablative and heatsink re-entry vehicles successfully. The U.S. Army had recovered an ablative re-entry vehicle flown in late 1957. Also by late 1958 the Air Force had conducted the X-17 re-entry test program and had
under-way other pertinent programs. NASA chose to carry out two technical approaches
to the heat shield, ablative and heat sink. The former was flown in September
1959 and the test was highly successful. With this success all thought of
using any type but an ablative heat shield was abandoned.
Final Descent. The final descent was to have been made with parachutes
into water. The system consisted of a small drag parachute to stabilize and
slow the capsule at speeds below Mach 1.5 and at altitudes below 70,000 feet.
The main parachute was to open at about 10,000 feet for the final descent.
The development of such systems in late 1958 left little doubt that anything more than engineering was required to qualify necessary equipment. Such
o
qualification was achieved in the summer of 1959.
Recovery. The recovery phase (excluding impact prediction) of a Mercury
mission did not present requirements of any significant technological conse-quence. The task was mainly one of proper employment of sufficient recovery forces and use of standard equipment adapted to the specific task at hand.
9
Tracking. Trajectory Prediction, Command and Instrumentation. It was
obvious early in the Mercury Project that a complex world-wide tracking
net-work would be required to insure adequate flight safety. Study of these needs resulted in the definition of a far flung network possessing remarkable qual-ities of speed, reliability and accuracy.
This network ultimately contained, among others,the following equipment:
16 tracking radars
16 telemetry receiving stations
16 air to ground voice radio stations
3 IBM 7090 Computers
1 IBM 709 Computer
1 Burroughs /General Electric Computer
102,000 miles of teletype lines 60,000 miles of telephone lines
15,000 miles of high speed data lines A complete mission control center
-8
Nearly all of this equipment was of standard commercial or military varieties, some with varying degrees of modification. Some new equipment (for example, acquisition aids for the radars and digital interface coupling equipment) had
to be built but none of this required significant technological advances. The network did present a very substantial integration task; fortunately, this network was largely a system unto itself with only procedural inters
faces or instrumentation interfaces with the rest of the Mercury equipment. Also, it contained largely the technologies of a narrow range of
disciplines--electronics and communication system engineering.
Technical Challenges of Project Mercury. Given that little if any new
technology was required what were the technical challenges of Mercury? There would appear to be three:
Astronaut Safety. Safety was a paramout issue in every critical
sub-system of Mercury. Statements of related policy are cited later in this paper.
The reader should distinquish between safety and reliability. In an oversim-plified form the probability of losing an astronaut can be thought of as
PL=Pp X Pp£. Qj. the loss probability equals the probability of catastrophic failure times probability of failure of escape systems.
System Engineering and System Integration. Two outstanding examples of
these system-requirements are the spacecraft (and its launch vehicles) and
the tracking network. Both of these presented very complex conglomerations that had to be engineered into finely tuned systems.
Reliability. Reliability was at the outset recognized as a problem. As
is cited in this paper, even with the strenuous efforts exercised by the Mercury development program (for good coverage of this see NASA SP-45,
Chapter 6)^ significant numbers of component and subsystem failure still occurred
The Flight Test Program
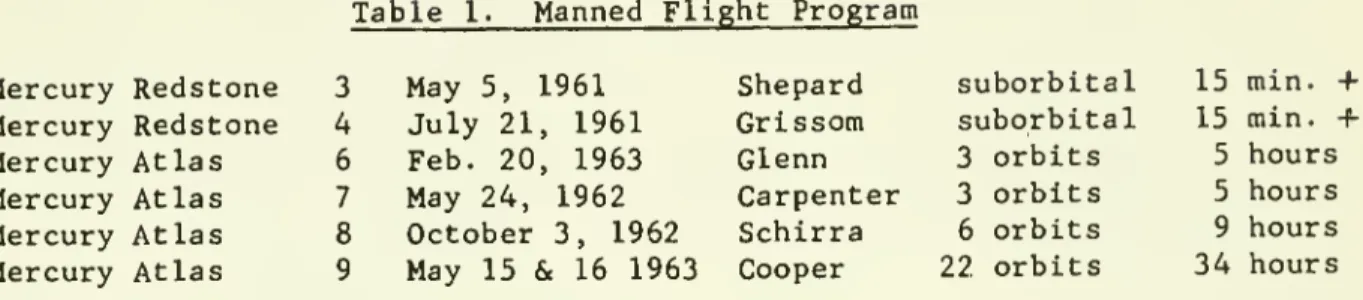
The manned flight program consisted of six flights summarized in the table below:
Table 1. Manned Flight Program Mercury Redstone 3 Mercury Redstone 4 Mercury Atlas 6 Mercury Atlas 7 Mercury Atlas 8 Mercury Atlas 9 May 5, 1961 July 21, 1961 Feb. 20, 1963 May 24, 1962 October 3, 1962 May 15 & 16 1963 Shepard Grissom Glenn Carpenter Schirra Cooper suborbital suborbital 3 orbits 3 orbits 6 orbits 22 orbits 15 min.
+
15 min.+
5 hours 5 hours 9 hours 34 hoursEven though serious consideration was given to flying both additional 3
orbit flights and additional 1-day flights^^, the Mercury program was ended with the manned flight program summarized above. As is well known, recovery was completely successful in every manned flight except that of MR-4, In which the capsule was lost in the sea.
The flights were punctuated with minor difficulties (some of which seemed quite serious at the time) that were effectively coped with by the astronauts or by ground crews. The seriousness of many of these failures was minimized by redundancy or other provisions for failure made in the system design. The Mercury Project Summary. NASA SP-45, points out an average of ten spacecraft
component malfunctions or failures per manned flight despite intensive efforts
to discover and correct all anomalies prior to flight. In none of these, how-ever (even though some of these failures were critical), did mission failure result. In every case redundancy or pilot back-up modes were effective. (See
page 110, NASA SP-45).
Looking at the results of the flights and the restricted number of flights and noticing that only two can be considered as near duplicates of any other flight, one would conclude that:
a. project objectives were realized;
-10
Programmed Flights versus Accomplished Flights. At different times in
its evolution, Project Mercury was planned to contain various numbers of
flights. Specifically, the planned flight programs at various times are summarized in Figure 2. Examination of the total flights at the left of the figure reveals that the program as accomplished contained one extra Little Joe flight, two less Redstone flights, and two less Jupiter flights than the original program. The Jupiter flights were not planned to be
manned. Each of the astronauts rode one flight. (This statement excludes
the astronaut who was disqualified for physical reasons.)
Summary of Content Discussion
Project Mercury achieve the objectives it set out to achieve. It
appar-ently was not expanded to encompass other objectives and the program flew very close to the number of flights planned at the outset. The program can be said to have adhered very closely in actual conduct to the original
objec-tives and program content.
Project Mercury's Adherence to Schedule
Figures 3 and 4 show how Project Mercury fared as regards its adherence
to schedule. Figure 3 shows reference line representations of the planning
in early 1959 and of the actual conduct of the program. It can be seen that the first developmental flight was about one month late. This increased to
about three months which, when added to spacecraft delivery slippage, placed
the flight test corresponding to the 8th originally planned test about 10
months behind schedule. Additional slippage accrued such that by the flight
test corresponding to the 18th originally planned test, a slip of about 14
months existed. Additional slippage accrued then of about 8 months, putting
FIGURE
3/CS
IWIA^.63
)
FIGURE
4-11
A much oversimplified analysis of these slippages is as follows:
Slip l--amount, 3 months; probable causes, difficulties in preparation
for flight plus flight failures of Little Joe boosted flights plus about one month of design and/or fabrication slippage that had developed prior to the first developmental flight.
Slip 2--amount, 6 months; probable causes, difficulties in design and
fabrication of spacecraft leading to spacecraft delivery slippage. Slip 3--amount, 5 months; probable causes, longer launch preparation
times* than estimated, accumulated over about 11 flights. Slip 4--amount, 8 months; probable causes, structural and guidance
failures in Atlas boosted launches plus longer launch prepara-tion times than estimated.
Slip 5--amount, 12 months; probable causes, an accumulation of longer launch preparation times due to original underestimates. Total slippage--about 34 months.^"
A slightly different and more approximate way of looking at the schedule performance of Project Mercury is shown in Figure 4. This figure is drawn from Figure 2 previously presented. This shows an intermediate schedule line
that reflects probably, slips 1 and 2 above since these had materialized by
early 1960 when the intermediate estimate was made. The intermediate line does not reflect the Atlas failures nor the longer preparation times actually encountered at Cape Kennedy.
Project Mercury's Adherence to Budget
To discuss the budget it is first necessary to establish just what the
program at various points in time intended to achieve. The objectives of
the Project Mercury are reasonably clear and are stated above. Perhaps the
main item of controversy is whether or not the 1-day missions were included
in the program and therefore in the budgets. There is ample evidence, indi-cated below, that indeed the 1-day mission was included up until October 1959.
*"Launch preparation times" as used here is that time required to modify, test and assemble the spacecraft and launch vehicle as well as the actual countdown.
-12
"Manned Space Flight is N-A S-A.'s top priority program. Increased costs have resulted from program complexities not
foreseeable at the time the fiscal year 1960 budget was drawn up. The program as justified contained funds for work on the extension of man's space flight capability
be-yond Mercury; in order to make these funds available to
Mercury, all such advanced work has been delayed for a year and the 18 orbit missions have been reduced to a 3 orbit
mission. An additional $7,515 million has to be programmed
to maintain the Mercury rate of progress... "19
Dr. Abe Silverstein of N.A.S.A. is quoted in Aviation Week of
June 29, 1959, as saying that the capsule might be allowed to go approxi-mately 18 circuits, which would extend the orbital time to somewhat over
24 hours, and that provisions for the astronaut had been made for at least
20
that time period in the Mercury capsule.
In the November 24, 1958 issue of Aviation Week, the projected Mercury
capsule is described rather accurately. This description is stated in the article to be based on the Request for Proposals then in industry's hands
for this capsule. Among other attributes said to be required of the capsule was an 18 orbit capability.^^
It would appear then that budget estimates made for Project Mercury prior to October 1959 included the 1-day mission and those made subsequent
to that time excluded it. Some of the key program budget estimates and the
date on which these estimates were made are shown in Table 2. All these have
been adjusted to include the one day mission.
Table 2.
Program Cost Estimates--Project Mercury
February 1959 ?200,000,00022
November 1959 $346,000,00023
March 1962 $351, 500,000^*^
March 1963 $347,000,00025
-13
Before drawing direct comparisons of the figures in Table 2 the reader should look carefully at the program sizes set forth in Figure 2. As can be seen, the program estimates are associated with substantially different
num-bers of flights. Table 3 below presents data from Figure 1 and Table 2 in
slightly different form:
Table 3
Mercury Program Comparisons
Approximate Duration of
Program Cape Kennedy Program Cape K Budget
Flights* Duration Operations **
April 1959 20-8 MR,2MJ,10MA 2 years Approx. 20 mo. $200,000,000
Feb. 1960 23-8 MR, 15 MA 2k years Approx. 28 mo. $346,000,000 April 1962 11-6 MR, 15 MA 4% years Approx. 33 mo. $351,500,000 Actual Prog. 16-6 MR, 10 MA 4^ years Approx. 30 mo. $384,100,000
*MR: Mercury Redstone, MJ-Mercury Jupiter, MA-Mercury Atlas
**Duration of Cape Kennedy Operations is merely the sum of the number of months in which launches were scheduled or conducted. When long breaks
in the launch schedule are present, the months in these breaks were not
counted
In summary, then, the data used in this study show that Project Mercury costs exceeded the original budget by about $184,000,000 or stated another
way, final costs were about 1927„ of original estimates. This is true even though the program actually carried out contained fewer flights than the
•14
Risk Content of Project Mercury
To evaluate the risk* in a development program before or even after
the fact is a difficult undertaking. However, there are data available from which inferences can be drawn as to the risk estimated to be in the program at various times. These data are of three types:
1. Testimonials of knowledgeable people in (and around)
the program, given at the beginning of or during the program ;
2. The scope of the planned program as compared to the actual program, i.e., the apparent reserve in the
number of flights, for example, that were programmed
to meet objectives;
3. The actual occurrence during program life of probabil-istic events that specifically influenced time and
fi-nancial requirements.
Testimonial Data on Project Mercury
The citations listed below indicate aspects of the risk content of
Project Mercury: Mr. Maxime A. Faget, Chief of the Flight Systems Division
of the N.A.S,A, Space Task Group, April 9, 1959, stated:
"The particular type of manned satellite that we have chosen is a ballistic re-entry vehicle....
* "Risk", as used in this paper, is the extent to which a development program
contains possible occurrences which would affect the time and/or money required
to achieve specified program objectives. Such probabilistic events are the working or failing of technical approaches that are uncertain at the outset.
"Risk" as used here is the uncertainty that flows from a lack of technical and/or programming knowledge.
•15
"The reasons we chose this particular type of vehicle were as follows: Such a vehicle is considerably more compact and lighter than the more sophisticated lifting types of vehicles, and for this reason it was easy to
incorporate it with an existing booster system, namely
the Atlas. . .
.
"This save not only development time and expense, but it also enhances our chance of success inasmuch as we are exploring the unknown with the least amount of new developments in proceeding in this manner. "27
NASA SP-45
"After the objectives were established for the project,
a number of guidelines were established to insure the
most expedient and safest approach for attainment of the
objectives were followed. The basic guidelines that were established are as follows:
(1) Existing technology and off-the-shelf equipment
should be used wherever practical.
(2) The simplest and most reliable approach to design
would be followed.
(3) An existing vehicle would be employed to place the
spacecraft into orbit.
Basically, the equipment used in the spacecraft was derived from off-the-shelf equipment or through the direct application of existing technology, although some notable exceptions were made in order to improve reliability and flight safety. These exceptions include:
(1) An automatic blood-pressure measuring system for
use in flight.
(2) Instruments for sensing the partial pressures of
oxygen and carbon dioxide in the oxygen atmosphere of the
cabin and suit re''>pectively "28
Aviation Week, November 17, 1958, quoting Dr. York of ARPA
"York said it will take a number of years to get the
vehicle and capsule system to the point where man can be orbited safely, but he said 'nearly everything we want exists, is about to exist or is solidly under
•16
Aviation Week, June 22, 1959
"The technical policy adopted by the task group is to use existing technology and proved methods throughout
the Mercury program to save time and money. Although this eliminated the need for new research, it has not
been possible to use off-the-shelf equipment and systems
in the Mercury capsule."
"All aspects of the Mercury program rest on firm technical ground. While a great deal of engineering design and environmental test work has yet to be done, the programs have been outlined clearly by the wide experience gained in recent years on the major problems connected with orbital flight."
"In areas where there is still some doubt about the
basic technical approach involved N.AS.-A, has back-up programs.
"
"The heat sheiid required for the capsule to re-enter
the atmosphere is being purchased in both ablation and
heat sink forms. While a great deal of nose cone invest-igation for the ballistic missile program is applicable to the capsule, no re-entry tests ever have been made from an orbit. Orbital re-entry occurs at speeds only slightly higher than intercontinental missile speeds but the energy
that must be dissipated as heat or drag is considerably
higher and the re-entry paths are different."
'The Mercury capsule is a less complicated vehicle to
develop than a high performance aircraft and its design
and test program are expected to move correspondingly faster. "30
Program Reserve
The program as planned in February 1960 contained the following planned flights: 6 Little Joes, 8 Redstones, and 15 Atlases. The program actually conducted contained: 7 Little Joes, 6 Redstones, and 10 Atlases including
the 22 orbit mission.
The planning in February 1960 did not include the 22 orbit missions, so
deducting it and the failures (which included 2 Redstones, 2 Atlases and 1 Little Joe) from the actual program, the reserve in planning is found as:
-17
In short, a flight test program was planned with about twice as many liquid missiles as would have been required if NASA had not planned for any failures and if the 22 orbit mission had not been planned This infers that
NASA expected a failure rate of about .5 for liquid missile boosted flights.
In summary, it appears from available data that the Mercury capsule
de-velopment was thought to be straightforward except for a few areas such as the heat shield. Whenever the success »f the outcome was in doubt, back-up programs were utilized to reduce this risk to low levels. In the case of the
heat shield, little doubt remained by February 1960 (when the "15 Atlas"
pro-gram was laid out), since the Big Joe shot of mid-1959 had removed this doubt.
The tracking network, though underestimated as to cost, was not thought
to be risky in a technical sense. It checked out the first time it was tested and "performed beyond our expectation". One can at least speculate
that at the $53.0 million it finally cost for procurement and installation little risk was present in the program.
The major risk area then appears to be system reliability--uncertainty that the missions could be flown in the minimum number of flights. The prob-ability of success used for planning of a liquid missile boosted flight appears
to be about .5.
ANALYSES OF PROJECT MERCURY
Project Mercury achieved the desired technological results but it
in-curred both financial and time overruns. Based on data in this paper, the
cost overrun of the initial program budget was 184 million dollars and the
time overrun for the program was about 30 months. Put in the language of
-18
budget overrun factor was 1.92. If one estimates these factors based on the
flight of MA-6 (1st manned orbital flight, which might be used to mark the end of the development program), they are respectively about 2.2 and 1.93. An earlier section of this paper presents a gross reconciliation of schedule
slippage. To what causes can the budget overruns be attributed? At least four general causes are apparent:
1. Accumulation of overhead costs due to time slippage;
2. Growth in the tracking network costs-'^ ;
3. Flight failures causing increased direct costs;
4. Purchase of additional equipment over that thought to be required when the initial budget was layed out.
Crude analyses of actual financial data from the program permit the
fol-lowing highly approximate cost attributions:
Overhead accumulation due to time slippage Growth in tracking network costs
Flight failures
Purchase of additional equipment
-19
NASA programmed and bought 5 Atlas boosters that were not ultimately
re-quired and 2 Redstones, with spacecraft for all of these. Consequently addi-tional launches required only operational costs. Incremental costs of one Atlas launch and one Redstone launch (excluding costs of hardware) were
es-timated at 12.0 and $8.7 million respectively. If failures had occurred
re-quiring the use of all the hardware onhand, somewhere in the neighborhood of
$77.0 million more would have been required therefore for a total program
cost of about $460 million, or a range of $270.0 million dollars. One might
think of these figures as representing a probability distribution. A plausible (though not necessary) assumption is that such a distribution is nearly normal, since it is made up of a large number of other distributions and the working of the central limit theorem might lead to such normality.
The range of uncertainty of $270.0 million arrived at above is a little
surprising when one reconsiders the evident lack of technological uncertainty in the program. This reconsideration leads logically to the next element of analysis. What aspects of the Mercury program process contributed to the
total financial uncertainty (as contrasted to that part identified above) that
existed in the program?
Lack of Definition at the Inception of the Program
A lack f;f definition appears to have existed specifically in the tracking
network and is alluded to in testimony of Mr. T. Keith Glennan, former
Admin-istrator of NASA, before the Authorization Subcommittee of the Senate Committee on Aeronautical and Space Science in March of I960.-'-' This lack also
mani-fests itself in the need to procure substantial additional qualities of hard-ware after the first budget was established. This additional equipment was referred to also by Dr. Glennan in the testimony of footnote 33.
-20
Primary Concern for Astronaut Safety
A general and no doubt necessary tendency to decide nearly all trade-offs with astronaut safety as the paramount criterion also contributed to the
un-certainty. The following quotations from NASA's Summary Report on Project Mercury illustrate this policy:
In a discussion of reliability and flight safety the following statement
is made:
"Consideration of cost, manpower, or schedule were never allowed to influence any decisions involving mission success or flight safety. "34
"Basic equipment designs and implementation criteria for
this program (the tracking network) were the result of several major considerations. One of them was economics: existing facilities were to be used whereever they met the Mercury location requirements. Thus at six locations a
major part of the equipment, including most of the network's tracking radars, was already available. Another major
con-sideration was time. Maximum use of existing, proven equip-ment was dictated by the necessity to avoid the long hard times required for research and development. But the
pri-mary consideration, over-riding all others, was the safety of the astronaut."35
The primary effect of this safety consciousness was probably to increase the time required to complete specific tasks through increased attention to
test details and through an increased readiness to accept changes to the system promoted on the grounds of safety. Both of these, increased time and system changes, of course acted to increase costs of the program.
Systems Engineering Problems
Further accentuating the effect noted above is probably a deficient system engineering job on the space capsule itself. The comparative results on the two major integration tasks are striking and lend support to such a
-21
Among the causes for delay at Cape Kennedy, NASA, in SP-45, pointed out that the average time taken for spacecraft modifications was 3% months; 1 1/3
months were used for actual hangar testing, and 1 month while the spacecraft
was on the launch pad. These long preparation times were partially accounted
for by inadequate test provisions in the spacecraft, the difficulty of access
to various installed systems, etc. Also the unavailability of documented test procedures, the wearing out or life expiration of equipment and lack of space were cited.-'' (See NASA SP-45 Chapter 14, for a detailed review of
these problems.)
One can also cite the structural failure in the flight of MA-1 as a
system integration deficiency that was found only in test. It is interesting
to speculate here inasmuch as the "Big Joe" flight which preceeded MA-1 had an Atlas booster with "thick skin" and no failure occurred. MA-1 was a "thin
38
skinned" Atlas and failure did occur. The fix was to thicken the skin on MA-3 (with an interim fix on MA-2) to about that thickness used in the Big
39
Joe Flight. The question arises: Where were Mercury systems engineers when the decision was made to reduce skin thickness on MA-1? The point here,
obviously, is not to cast a stone but to highlight what appears to be a
diffe-rent level of performance in the spacecraf
t^booster
system engineering and system integration areas and that (to be discussed below) in the tracking network.As was pointed out early in this paper the tracking network too,
pre-sented a system engineering and integration challenge. Chapter 8 of SP-45 covers the development and performance of this network in great detail. Among
the points worthy of note are the following:
1. By May of 1961 the network was fully operational and training had been conducted at all sites.'^^
2. Manuals of various types were provided for the network users
,42
-22
^1
3. Self test capabilities were built into the network
4. Logistic support was provided for in advance and spares did not
present the problems presented by the spacecraft.
One is forced by these two examples to a tentative conclusion that for
some reasons, a different quality job of systems engineering and integration
was done on these two major elements of the Mercury system. Underlying this difference would appear to be several significant process elements.
Schedule. The spacecraft was developed on an extremely tight schedule.
For example, the contract for the spacecraft was signed in January 1959. The mockup of the spacecraft was inspected only 2 months later in March. The first complete spacecraft was delivered in March of 1960, only about 14 months
44 1 J •
after contract signing. Allowing 9 or 10 months for manufacturing lead time
(a very short period for a first article of this nature) only 4 or 5 months
are left for design. Granting that design began upon receipt of the request
for proposal, only some 6 or 7 months were spent on design. Following the
first spacecraft delivery, on the average, about one per month was delivered
for the next year.
The world wide tracking network on the other hand was placed on contract
In July 1959. Prototype tests were conducted at Wallops Island in July 1960
and operational status was achieved in March 1961.^^ Recalling that most of
the tracking network was standard equipment and that the Wallops Island tests were of a prototype installation, it is clear that this simpler task was
con-ducted on a more leisurely schedule.
Another factor in the schedule situation is the competition that was
-23
Examination of Figure 3 shows a sharp break in the rate of the achieved
pro-gram schedule in about April or May of 1961. The Gagarin flight of course occurred on April 12, 1961 and our own manned program began on May 5, 1961.
Prior to this time, though discrete slippages had occurred, rates of accom-plishment generally were about equal to those planned. After this time rate
of achievement fell sharply from that originally planned. Obviously, our
program had entered the operational phase, become more complex, and the oper-ations had become more critical. But a logical question remains of the influ-ence of the Gagarin flight in removing some of the urgency from the Mercury Project.
Some evidence is present that indicates that the airborne elements of the system were in a race but that the tracking network was not. Such an
approach fits a "race with the Russians" theory if we were willing to "win"
the race with a Redstone flight. The range of Redstone was only about 250 miles and it is quite clear that the tracking network except for the Cape
Kennedy installation was not required for such a flight. Examination of
track-ing network schedules clearly show that Cape Kennedy installation including the Mercury Control Center was programmed to be available (provisionally accepted) substantially earlier than most of the other stations--l station was three months later, 3 stations were four months later one, five months
later, and the remainder more than five months later, ^"
Also, examination of the tracking network's actual procurement schedule and the expenditure rate in early 1959 forces one to the conclusion that even
at this early date the tracking network was on a different schedule than that
of the spacecraft. Figure 5 shows these schedules and accumulated expenditures
on the spacecraft and the tracking network. The launch vehicle expenditures are also shown. The point here is simply that the network was about 6 months
24
Sc];ie:dul^:sIaSi3lxpend'itir.es--nver:sus-Tki^^
:^
^n
fFl^
ttrtthi
ggg'S
pa^'eoraf
t% fJLmrnch
!Vehrct
J^- ;ftvi,^'KTTVfl:Ah^^^x|^al=^Pha:s,e"rsfoTT-
H
25
slower than the spacecraft even getting into development. The implication
of this is that by early 1959, orbital flights were not in fact expected prior to early 1961. Yet at this time the first orbital flight was scheduled
48
for April 1960. One other possibility of course is that the first orbital flight would have been made without a world wide tracking network; however,
the emphasis on safety tends to rule out such a plan.
In summary, then, there is evidence that for any or all of several
pos-sible reasons the spacecraft development was scheduled very tightly whereas
the tracking network was on a looser schedule. This no doubt contributed significantly to the apparent quality difference in the system engineering of the two systems.
Heterogeneity of Technologies. It is reasonably clear that the
space-craft with its aerodynamic, structural, electronic, aerothermodynamic, mechanical, thermodynamic, human factor, environmental, manufacturing, and probably other technological requirements presented more complex engineering and manage-ment problems than did the network with its narrower range of technological
needs. The problems associated with optimal design of systems employing such ranges of technological skills constitute the meat of the systems engineering and integration task. Achieving adequate communication among the specialists
in these technologies and the breaking down of parochial interests takes time.
The time allowed was probably inadequate in the complex case of the spacecraft
and adequate in the less difficult case of the tracking network.
Organization. There is some evidence, though it is admittedly weak in
available public references, that the spacecraft was largely system engineered by the Space Task Group, a new NASA group formed especially for Mercury. The
tracking network on the other hand was assigned to an established operation
-26
an influencing factor. Such a factor would logically be accentuated since many system engineering decisions must be made early in a program just at the time a new group is most likely to be inefficient and ineffective.
Development Results in Mercury Related to other Development Projects The best available body of data to which the results of the Mercury project can be related is contained in Peck and Scherer's The Weapons Acquisition Process; An Economic Analysis. Tables 2.1 and 10.1 of that book are
com-bined and reproduced as Table 4 of this paper. ^^ Added to this table are Mercury results. The values entered were arrived at in the following ways:
Exploitation of the State of the Art. Based on data in this paper
Mer-cury was estimated to be less exploitative than a higher performance
air-craft. Three such aircraft are the sample of Table 4. These aircraft are
the B-58, F-4H and the F-105. Mercury was estimated to be less exploitative than any of these, an "exploitative" value of 50 was therefore used for
Mercury.
Importance of Development Time. Mercury was estimated to be as urgent
as the most urgent project prior to April 1961. Subsequent to that time urgency was assumed to have dropped by %. This yields an average value for the program of 75.
Importance of Development Cost. Mercury was estimated to be about the
same as the highest priority missiles which ranged from to 40. An average of these two values was chosen.
Relative Technical Difficulty. A value was chosen equal to the lesser
of the aircraft projects.
Development Cost Factor. All costs to MA-6 were included and divided by
$160.0 million. This yields a value of 1.93. The $160.0 million figure results from reducing the $200.0 million original budget in proportion to
V ;;>i I! 1-1 '
1 ji, I i.'.
t.'
.,I I r '
-28
the reduction in the $384.1 million budget due to exclusion of the part of the program beyond MA-6.
Development Time Factor. Time to MA-6 was used divided by 19 months, the original period allowed until the first manned orbital flight - 19+22
~T5~
2.2Inspection of this table immediately reveals a difference between pro-jects A through L and Mercury in that the development-cost factor in almost every case substantially exceeds the development time factor. In Mercury, however, the reverse is true.
Other relationships can best be looked at by examination of figures
6 through 12 below:
Coi.'ciaiion ofTime Slippage tractors with
State o.. tiic Art Exploitation
2.5 -o 2.0 -UJ o 1.5 < c c 5 1.0 Ul *- .5
-•29
Correlation oi CostOverrun Factors with
Stateof theArt Exploitation
8.0 7.0 6.0 5.0 4.0 3.0 2.0 1.0
-30
Correlation of Cost Overrun Factors with the Importance of MinimizingTime
K4.0 > 03.0
-V) 82.0 1.0Merc\arx*Q^
.o^
I 1 t L 10 20 30 40 50 60 70 80 90 100 IN'PC^"^'""" Or TIWE FIGu'RE 9Correlation ol Cost Overrun 7;',ciors
with Time Slippage Factors
31
Correlation ofTime Slippage Factors with theImportance ofMinimizingTime
10 20 30 40 50 60 70 80 90 100
IMPORTANCEOFTIME
PIOURE
11
Correlation of Time Slippage Factors with the Importance of Minimiicir.g Cost
10 20 30 40 50 60 70 80 90 100
IMPORTANCE OF COST
-32
These figures show that Mercury experienced more time overrun than would have been predicted from the projects A through L, given Mercury's
cost overrun factor and the other indices used. This can be explained a
number of ways. Probably the most credible is that the time slippage
re-sulted from safety considerations and related problems discussed elsewhere
in this paper, and that this slippage occurred in the main at a time in
the program, during flight test, when overhead bases had diminished. The program stretchout then was less costly than it would have been had it
occurred during an earlier phase of work.
In summary, then, Project Mercury experienced project results generally consistent with other similar programs except that time overrun was
Appendix 1 Financial Analysis
1. Overhead Calculations:
Total actual cost of program $384.1 million Total duration of the program 54 months
Average expenditure rate 384.1 ^
^^^
million/mo. 54Assumption: Overhead rate is 100% of direct effort. Average overhead expenditure rate then was $3.55 million/mo. This assump-tion is based on the author's experience with numerous similar situations. In general, overhead rates range from about 907, to
135% depending on factors such as which contractors are involved,
whether the rate is to be applied to engineering or manufacturing, etc.
30 months x $3.55 x 10 =$L06.0 x 10^
2. Growth in tracking network costs:
Original estimate = $35.0 million Final cost = $124.0 million^^ Total difference = $89.0 million
Total direct cost addition = $44.5 million (based on 1007. overhead
assumption above)
3. Flight failures:
Incremental costs of 1 Atlas flight = $12.0 million^^
Assumption: Costs above were attributable to launch operations and time passage, not to hardware. This assumption is based on the fact that ample hardware existed in the program to support the extra launches.
Assumption: Cost of a Redstone launch =
—
- x $12 million = $8.7 million. ^0160
This assumption is based on costs being proportional to launch prepar;'t:ion time. Then direct costs, using 1007o overhead, of 2 Atlas and 2 Redstone
failures = $20.7 million.
4. Purchase of additional equipment.
5 Atlas boosters
at a direct cost of $2.29 x 10^* each = $11.4 x 10^ 61
12 spacecraft
at a direct cost of $ .79 x 10^** each = $9.5 x 10^ ^^
$20.9 X lot"
5 Total cost of 1 through 4;
$106.0 X 10^ Overhead due to schedule slippage
44,5 X 10^ Growth in tracking network costs (direct co.sts) 20 7 X 10^ Costs attributable to flight failures (direct costs)
20.9 X 10^ For purchase of additional equipment (direct costs)
$192. 1 X 10⁶
* $2.29 X 10⁶ derived by taking total launch vehicle cost from NASA SP-45,
removing Redstone costs and Little Joe costs, based on estimates in Project Mercury, a Chronology, dividing by 15 (for 15 boosters) and appl>ing an assumption of 1007, overhead.
** $.79 X 10^ derived by taking total spacecraft manufacturing cost from SP-45,
adding to this a proportional part of subcontracting, dividing by 24 (for 24
FOOTNOTES
1. Committee on Aeronautical and Space Science, U.S. Senate, Report No.
1014, Pro.ject Mercury: Man-In-Space Program of the National Aero
-nautics and Space Administration.
2. Grimwood, James M., Mercury Chronology, p. 32.
3. Ibid. 4. Ibid., p. 5. 5. Ibid., p. 22. 6. Ibid., p. 10. 7. Ibid., p. 74. 8. Ibid. . p. 73.
9. Mercury Project Summary, NASA SP-45, pp. 127-154.
10. Committee on Science and Astronautics, U.S. House of Representatives, 1963, N.A.S.A. Authorization Hearings Before the Subcommittee on
-Manned Space Flight. Committee on Science and Astronautics. U.S.
House of Representatives
.
87th Congress Second Session H.R. 10100 (Superceded by H.R. 11737) March 6, 7, 8, 14, 20, 26, 27, 28, 29; April 2, 3, 4, 5, and 10, 1962, p. 787.
11. Committee on Aeronautical and Space Sciences, U.S. Senate, N.A.S.A.
Authorization for Fiscal Year 1960. Hearings before Authorization
Subcommittee of the Committee on Aeronautical and Space Sciences,
U.S. Senate, l6th Congress on S. 1582, April 7, 8, 9, 10, 1959,
p. 361.
12. Report IOI4, Op. Cit., p. 23.
13. Committee on Science and Astronautics, U.S. House of Representatives, 1961 N.A.S.A. Authorization. Hearings before the Committee on Sciences
and Astronautics and Subcommittees Nos. 1, 2,
2
^"d ^, U.S. House ofRepresentatives. 86th Congress, Second Session on H.R. IO246, Feb. 17,
18, 19, 20, 23, 24, and 26, 1960, p. 170.
14. 1963 N.A.S.A, Authorization Hearings before the Subcommittee on Manned Space Flight, Op. Cit., p. 499.
15. Ibid., p. 499 and p. 789.
16. Clarlt, E. Aviation Week, April 20, 1959, "N.A.S.A. Reveals Mercury
Pre-Orbit Plans," p. 28.
17. N.A.S.A. Manned Spacecraft Center, Project Mercury, Mercury Pro.iect Surnmary, N.A.S.A. SP-45. pp. 14-15.
18. IbidJ. pp. 14 & 50-51.
19. Letter, dated Oct. 8, 1959 from Assistant Administrator for Congressional Relations of N.A.S.A. to the Committee Chairman, Report 1014, Qg. Cit.
.
p. 17.
20. Sweeny, Richard, Aviation Week. June 29, 1957, "Reliability is Vital
Space Flight Factor," p. 35.
21. Aviation Week, Nov. 24, 1958, "N.A.S.A. asks Specific Capsule," pp. 28, 29, 30.
22. Report 1014, Op. Cit., p. 17.
23. 1963 N.A.S.A. Authorization Hearings before the Subcommittee on Manned Space Foght, Committee on Science and Astronautics, Og. Cit.
.
p. 274.
24. Ibid.
25. 19o4 N.A.S.A. Authorization Hearing before the Subcommittee on Manned
Space Flight . Committee on Science and Astronautics. U.S. House of
Representatives
.
87th Congress, 1st Session on H.R. 5466 (Superceded by H.R. 7500) March 6, 7, 18, 19, 20, 21, 25, 27; April 1, 2, 4, 8,
%
10, 22, 24, 26, 29, p. 105.26. N.A.S.A. SP-45, Op. Cit., p. 26. 27. Report IOI4, 0^^ Cit., p. 22.
28. N.A.S.A. SP-45, Qp. Cit., p. 2.
29. Aviation Week. Nov. 17, 1958,"ARPA Official Gives Details on Man in
Space Program," pp. 26-27.
30. Aviation Week, June 22, 1959, "Manned Orbital Flight is N.A.S.A.'s
Top Priority Task," p. 126.
31. 1963, N.A.S.A. Authorization Hearings before the Subcommittee
on-Manned Space Flight, Op. Cit. . p. 274.
32. DATA. Jan. 1964, "N.A.S.A. Director of Manned Space Flight
Views," p. 11.
33- N.A.S.A. Authorization for 1961. Hearings before the N.A.S.A.
Authorization Subcommittee of the Committee on Aeronautical and Space Sciences. U.S. Senate, 86th Congress, 2nd Session on H.R.
10809, p. 61.
34^ N.A.S.A. SP-45,
Qc
OH',
p. 105.35. Ibid., p. 129. 36. Ibid., p. 249, p. 252. 37. Ibid., p. 251. 38. Ibid., p. 95. 29. Ibid. 40. Ibid., p. 143. 41. Ibid., p. 141. 42. Ibid. , p. 134. 43. Ibid., p. 143.
44. N.A.S.A. SP-45, Op. Cit., p. 17. 45. Ibid..
46. Ibid. p. 143
47. Ibid., p. 17, p. 26.
48. Ibid., p. 14.
49. Peck, M.J. and Scherer, P.M., The Weapons Acquistion An Economic Analysis, p. 22 and p. 290.
50. _Ibid-., p. 437. 51. Ibid. 52. Ibid., p. 439. 53. Ibid., p. 440, 54. Ibid., p. 442. 55. Ibid., p. 445. 56. Ibid.
57. 1961 N.A.S.A. Hearings before the Senate N.A.S.A. Authorization Subcommittee, O2. Cit. . p. 61.
58. DATA, Jan. I964, Op. Cit., p. 11.
59. 1964 N.A.S.A. Hearings before Subcommittee on Manned Space Flight on H.R. 5466, Op. Cit., p. 1207.
60. N.A.S.A. SP-45, Qe. £il., p. 251.
61. 1961 N.A.S.A. Hearings before Senate N.A.S.A. Authorization Subcommittee, Op* Cit. . p. 61.
62. Ibid.