Publisher’s version / Version de l'éditeur:
Science of The Total Environment, 640-641, pp. 1611-1634, 2018-06-28
READ THESE TERMS AND CONDITIONS CAREFULLY BEFORE USING THIS WEBSITE. https://nrc-publications.canada.ca/eng/copyright
Vous avez des questions? Nous pouvons vous aider. Pour communiquer directement avec un auteur, consultez la première page de la revue dans laquelle son article a été publié afin de trouver ses coordonnées. Si vous n’arrivez pas à les repérer, communiquez avec nous à [email protected].
Questions? Contact the NRC Publications Archive team at
[email protected]. If you wish to email the authors directly, please see the first page of the publication for their contact information.
NRC Publications Archive
Archives des publications du CNRC
This publication could be one of several versions: author’s original, accepted manuscript or the publisher’s version. / La version de cette publication peut être l’une des suivantes : la version prépublication de l’auteur, la version acceptée du manuscrit ou la version de l’éditeur.
For the publisher’s version, please access the DOI link below./ Pour consulter la version de l’éditeur, utilisez le lien DOI ci-dessous.
https://doi.org/10.1016/j.scitotenv.2018.05.392
Access and use of this website and the material on it are subject to the Terms and Conditions set forth at
Selenium analysis in waters. Part 1: Regulations and standard methods
Kumkrong, Paramee; Leblanc, Kelly L.; Mercier, Patrick H.J.; Mester, Zoltán
https://publications-cnrc.canada.ca/fra/droits
L’accès à ce site Web et l’utilisation de son contenu sont assujettis aux conditions présentées dans le site LISEZ CES CONDITIONS ATTENTIVEMENT AVANT D’UTILISER CE SITE WEB.
NRC Publications Record / Notice d'Archives des publications de CNRC:
https://nrc-publications.canada.ca/eng/view/object/?id=10b6a014-665c-4c4f-aaf9-dab981c2cc6e https://publications-cnrc.canada.ca/fra/voir/objet/?id=10b6a014-665c-4c4f-aaf9-dab981c2cc6e
Part 1
Page 1 Selenium Analysis in Waters
1
Part 1: Regulations and Standard Methods
2
Paramee Kumkrong*, Kelly L. LeBlanc, Patrick H.J. Mercier, Zoltán Mester 3
National Research Council Canada, 1200 Montreal Road, Ottawa, Ontario, Canada 4
*Corresponding Author Email: [email protected] 5
6
Selenium is released into the aquatic environment through anthropogenic activities such as agricultural
7
irrigation, coal mining, and metallurgical activities, where it acts as a reproductive toxin with negative
8
effects on predatory fish and water fowl. Waterborne selenium concentrations are closely regulated
9
worldwide, and various standardized methods are implemented by regulatory bodies to allow for the
10
monitoring of selenium concentrations in different types of waters. Here, we discuss worldwide
11
regulations relating to concentration limits of selenium in drinking, natural, and industrial waters.
12
Focusing specifically on North America, we look at some standardized analysis methods and discuss the
13
fact that many of these methods are not adequately sensitive to measure selenium in the concentrations
14
outlined by the associated regulations for natural waters. We look in detail at the limitations of these
15
methods with regards to both detection limits and interfering sample matrix components and establish
16
the need for more sensitive and robust methods of analysis for regulatory compliance. This review is
17
complemented by a second part (LeBlanc et al., 2018) where we discuss the state of selenium speciation
18
analysis and importance of speciation data for decision makers in industry and regulators.
19
Part 1
Page 2
Highlights - environmental selenium contamination is detrimental to aquatic life
21
- selenium concentrations in many types of waters are strictly regulated 22
- methods to analyze selenium in waters are becoming more sensitive and robust 23
- selenium speciation plays a vital role in its bioavailability to aquatic life 24
Keywords ICP-MS, ICP-OES, hydride generation, sample digestion, quality control, water quality criteria
25
Contents
26
1 Introduction 5
27
2 Selenium in the Environment 5
28
2.1 Occurrence, Production and Uses of Selenium 5
29
2.2 Selenium Contamination in Aquatic Environments–The Issue and Proposed Regulations 8 30
2.3 Selenium Toxicity to Humans 9
31
3 Water Quality Guidelines for Selenium 10
32
3.1 World Health Organization Water Quality Guidelines 11
33
3.2 North American Water Quality Guidelines 13
34
3.3 European Union Water Quality Guidelines 16
35
3.4 Asian Water Quality Guidelines 17
36
4 Analytical Methods for Selenium in Waters Used by U.S. Regulatory Bodies 23 37
4.1 Selenium Determination by Gravimetric Methods 24
38
4.2 Selenium Determination by Visual Colorimetric Comparison 24
Part 1
Page 3
4.3 Selenium Determination by Titration 25
40
4.4 Selenium Determination by Colorimetry (Spectrophotometry) 26 41
4.5 Selenium Determination by Fluorometry 27
42
4.6 Selenium by Hydride Generation – Atomic Absorption Spectrometry 28 43
4.7 Selenium Determination by Graphite Furnace Atomic Absorption Spectrometry 30 44
4.8 Selenium by Inductively-Coupled Plasma Atomic Emission Spectrometry 32 45
4.9 Selenium Analysis by Inductively-Coupled Plasma Mass Spectrometry 34 46
4.10 Selenium Determination by Isotope Dilution Mass Spectrometry 37 47
5 Method Requirements for Selenium Analysis in Waters 39
48
5.1 Sample Collection 39
49
5.2 Sample Preservation 39
50
5.3 Sample Preparation and Quality Control 40
51
6 Conclusions 53
52
6.1 Limitations of Total Selenium Analysis 53
53 6.2 Speciation Analysis 53 54 7 Acknowledgements 54 55 References 55 56 57
Part 1
Page 4 List of Acronyms AES Atomic Emission Spectrometry, APHA American Public Health Association, ASTM
58
American Society for Testing and Materials, AV Axially Viewed, AWWA American Water Works 59
Association, Cbkg Concentration at Background level, CCB Continuing Calibration Blank, CCV Continuing 60
Calibration Verification, CFR Code of Federal Regulations, CRC Collision Reaction Cell, CRM Certified 61
Reference Material, CVS Calibration Verification Standard, CWA Clean Water Act, DAN 2,3-62
Diaminonapthalene, DIW Deionized Water, DRC Dynamic Reaction Cell, ECCC Environment and Climate 63
Change Canada, EDL electro discharge lamp, EDTA Ethylenediamine Tetra-Acetic Acid, ERM European 64
Reference Materials, ETA Electro-Thermal Atomization, ETV Electro-Thermal Vapourization, EU 65
European Union, FAAS Flame Atomic Absorption Spectrometry, FEP Fluoroethylene Polymer, FI Flow 66
Injection, Fint Fraction at Intermittent, HDPE High Density Polyethylene, HG Hydride Generation, ICP 67
Inductively-Coupled Plasma, ICV Initial Calibration Verification, IDL Instrumental Detection Limit, IDMS 68
Isotope Dilution Mass Spectrometry, IPC Instrument Performance Check, LCS Laboratory Control 69
Sample, LFB Laboratory Fortified Blank, LFM Laboratory Fortified Sample Matrix, LLOQ Lower Limits of 70
Quantification, LOQ Limit of Quantification, LRB Laboratory Reagent Blank, MC Multi-Collector, MDL 71
Method Detection Limit, MMER Metal Mining Effluent Regulations, MNIA National Metrology Institute 72
of Australia, MS Mass Spectrometry, MSA Method Standard Addition, NIST National Institute of 73
Standards and Technology, NMIJ National Metrology Institute of Japan, NTI Negative Thermal 74
Ionization, OES Optical Emission Spectrometry, PTFE Polytetrafluoroethylene, QQQ Triple Quadrupole, 75
rf Ratio Frequency, RSD Relative Standard Deviation, SDWA Safe Drinking Water Act, SIC Spectrum
76
Interference Check, SIM Selected Ion Monitoring, SQ Single Quadrupole, TDI Total Daily Intake, THGA 77
Transverse Heated Graphite Atomizer, TOF Time of Flight, TS Total Solids, UN United Nations, U.S. 78
United States of America, U.S. EPA United States Environmental Protection Agency, U.S. PHS United 79
Stated Public Health Service, USGS United States Geological Survey, USN Ultrasonic Nebulizer, WHO 80
World Health Organization, WQCint Intermittent Water Quality Criteria 81
Part 1
Page 5
82
1. Introduction
83
“ele iu “e is a atu ally o u i g ele e t, p ese t i the ea th’s ust with a relative abundance of 84
0.3 to 10 x 10-6 %, depending on geographical region (Fleischer, 1953), which is mobilized through 85
various anthropogenic activities. Over the last several decades, interest in Se has increased significantly, 86
particularly in North America, due to its severe impact on aquatic ecosystems (Hamilton, 2004; Lemly, 87
2002a, 2007). As a result, regulations controlling maximum permissible Se concentrations in drinking 88
waters, industrial effluents, and natural surface waters have become increasingly stringent, which has 89
posed challenges to analysts measuring Se in these types of samples. In this review, we discuss these 90
challenges in terms of the regulations/guidance by various governmental and non-governmental bodies 91
and outline the analytical methods accepted by these regulators. We then critically examine the 92
outcomes of such methods and discuss challenges that will likely be faced in the future of Se analysis, 93
specifically in terms of the achievable detection limits and interfering sample matrix components, 94
establishing the need for more sensitive and robust methods of analysis for regulatory compliance. . In 95
Part 2 of this review (LeBlanc et al., 2018), we expand this discussion to examine the state of Se 96
speciation analysis and importance of speciation data for decision makers in industry and regulators. 97
2. Selenium in the Environment
98
2.1 Occurrence, Production and Uses of Selenium
99
The United States Geological Survey (USGS) Mineral Commodity Profiles of Se estimated its production 100
was approximately 2,200 - 2,300 tonnes between 2013 and 2016, with the largest producers including 101
the United States, Canada, Peru, the European Union (EU), Russia, China, and Japan (United States 102
Part 1
Page 6
Geological Survey, 2018). Se is classified as economic minor metal and it is produced and sold in the 103
form of pure SeO2 powder (>99%) and Se ingot. Se is used in variety industries, as illustrated in Figure 1.
104
105
Figure 1: World consumption of selenium, adapted from Yukon Zinc Corporation (2005)
106
A o g the other uses of Se are pharmaceuticals, cosmetics (though selenium sulfide is prohibited, 107
except in anti-dandruff shampoos where its limited quantity is labelled (European Parliament and of the 108
Council on Cosmetic Products, 2009)), and food and feed additives (Yukon Zinc Corporation, 2005). 109
While Se has been classified as a non-metal (Rumble, 2016), environmental chemists typically consider it 110
to be a metalloid due to its chemical behaviour. In naturally-occurring minerals, Se often coexists with 111
iron, lead, zinc, cadmium, copper, or silver, but upon mobilization via contact with water Se forms the 112
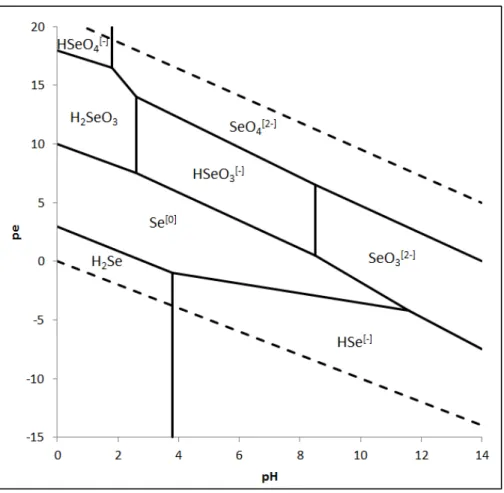
soluble oxyanions of selenite (Se(IV)) and/or selenate (Se(VI)) at the different pH and redox conditions 113
(Eh) shown in Figure 2 (Howard, 1977). Se in the water column can also be present in two additional 114
oxidation states: elemental Se0, and Se2- (selenide) which is typically found as an organic Se species such 115
as selenomethionine (SeMet) or selenocysteine (SeCys) (Maher et al., 2010). 116 9.1% 10.3% 15.2% 15.7% 23.9% 25.7% Electronics Pigments Chemicals
Agriculture and Other Uses Metallurgy
Part 1
Page 7
117
Figure 2: pe-pH diagram for Se at 25°C and 1 bar, when I = 0; based on Séby et al. (2001)
118
Background concentrations of Se in uncontaminated surface waters are generally below 1 µg/L (Seiler et 119
al., 1965), but in areas where the weathering and erosion of seleniferous soils is augmented by
120
anthropogenic activities such as agricultural irrigation, environmental Se concentrations have been 121
shown to be significantly elevated. For example, early studies of the San Joaquin Valley region noted Se 122
concentrations up to 100 mg/kg in the sediments of evaporation ponds (Dungan and Frankenberger, 123
1999; Saiki and Lowe, 1987). Other anthropogenic activities known to mobilize Se include petroleum 124
refining, certain mining operations (e.g. Cd and Zn), and the combustion of fossil fuels. In particular, coal 125
mined from high-sulphur areas such as the southeastern United States contains elevated levels of Se, 126
which is released via vapour- and particulate-phase emissions as SeO3 or trapped along with sulphur in
Part 1
Page 8
flue gas desulphurization (FGD) waters, producing a Se-contaminated wastewater that must be treated 128
before release back into the environment (Electric Power Research Institute., 2008; Maher et al., 2010). 129
2.2 Selenium Contamination in Aquatic Environments – The Issue and Proposed Regulations
130
While it has been demonstrated that 0.1 – 0.3 mg/kg Se in the diet is generally nutritionally adequate 131
(Mayland, 1994), elevated intake is cause for significant concern, particularly in oviparous animals such 132
as predatory fish and waterfowl where it results in teratogenic effects that can affect entire populations 133
in contaminated ecosystems (Janz et al., 2010). However, one of the most significant challenges being 134
faced by those attempting to manage environmental Se toxicity lies in the fact that there is no apparent 135
correlation between the total Se concentration in a water body and the associated effects observed in 136
the animal population within that ecosystem. These inconsistencies arise from the mechanisms by 137
which Se enters the aquatic food web, where the majority of the bioconcentration occurs between the 138
water and the lowest trophic level (usually algae). The extent of this bioconcentration varies over 139
several orders of magnitude and is dependent on both the species of algae and the species of Se present 140
in the water (Baines and Fisher, 2011). For example, the algal uptake of the organic Se species SeMet 141
has been shown to occur much more quickly and to a greater extent than the uptake of Se(IV) or Se(VI) 142
(Besser et al., 1989; Riedel et al., 1991; Sandholm et al., 1973). Additionally, inhibitory effects on the 143
uptake of Se(IV) and Se(VI) by algae have been observed in the presence of phosphate and sulphate, 144
respectively (Riedel and Sanders, 1996). 145
Due to this inconsistency between waterborne Se concentration and observed toxic effects, the United 146
States Environmental Protection Agency (U.S. EPA) has recently released new guidelines for Se in the 147
environment which consider fish egg/ovary Se as the primary indicator when examining a body of water, 148
rather than looking at the water column concentration alone, as has been done historically (U.S. EPA., 149
Part 1
Page 9
2016). This type of o ito i g a d egulatio a p o ide a ette i di atio of “e’s effe ts as a 150
reproductive toxin than whole-body or muscle-based concentrations (Hamilton, 2002), although those 151
values are to be monitored when egg/ovary concentrations are not available (U.S. EPA., 2016) because 152
they are still more relevant than water column concentrations (Hamilton, 2002), which are used as a last 153
resort (U.S. EPA., 2016). 154
2.3 Selenium Toxicity to Humans
155
Se is an essential micro nutrient element at low levels, but toxic when an excessive amount is 156
consumed. Generally, humans intake Se through their diet, though the amount of Se in food varies 157
globally depending on soil geology (Kunli et al., 2004). The recommended dietary allowance of Se 158
established by the U.S. Agency for Toxic Substances and Disease Registry is 55 µg/day for adults (Agency 159
for Toxic Substances and Disease Registry, 2003). The International Agency for Research on Cancer 160
(IACR) has reviewed many research studies on the relationship between Se and cancers in humans and 161
other animals and concluded that there is inadequate evidence to classify Se as a carcinogen (World 162
Health Organization, 1975). 163
Incidences of Se poisoning in humans are rare. Acute toxicity has been reported as both intentional and, 164
more commonly, accidental intake of inorganic Se. The symptoms of acute toxicity include strong garlic-165
like odours f o patie ts’ eath, o iti g, a do i al pai , and diarrhea. High concentrations of Se 166
were found in the blood, liver, kidney, and heart of patients (Nuttall, 2006). Toxic effects caused by the 167
inhalation of Se were reported in the chemical manufacturing industry, when a man was exposed to Se 168
fumes from the reaction of selenic acid with caustic soda. The man died as a result of second-degree 169
skin burns, necrosis of oral mucous membranes, and hemorrhagic lung edema; a post-mortem 170
Part 1
Page 10
examination revealed high concentrations of Se i the i ti ’s blood serum, urine, stomach contents, 171
and lungs (Schellmann et al., 1986). 172
In 2008, there were reports of a misformulated supplementary product reaching the U.S. commercial 173
market, where the actual Se content of a product was 200 times the labelled concentration 174
(MacFarquhar et al., 2010; National Institutes of Health, 2018). While no fatal cases were reported, 175
symptom of acute Se poisoning occurred within two weeks. Many patients developed gastrointestinal 176
symptoms (nausea, vomiting, diarrhea, abdominal pain) and musculoskeletal effects (muscle pain, joint 177
pain, cramps). Some patients also reported hair loss, and nail discoloration and brittleness. To follow 178
up, monitoring Se levels in the body was conducted via urine, hair, nail, and serum analysis 179
(MacFarquhar et al., 2010). The chronic effects of long term Se consumption are known as selenosis, and 180
include the development of brittle hair and deformed nails, and the impairment of the synthesis of 181
thyroid and growth hormones. In the most extreme cases, neurotoxicological effects may develop 182
resulting in the loss of feeling and control of the arms and legs (Vinceti et al., 2001). 183
3. Water Quality Guidelines for Selenium
184
Se and Se-containing compounds are classified by the International Agency for Research on Cancer 185
(IARC) as u lassifia le as to carcinogenicity i hu a s (World Health Organization, 1975). Se is of 186
concern in the areas of seleniferous soils from which Se could accumulate in plants and livestock and 187
become released to aquatic environment. Seleniferous soils are present in many areas of the world such 188
as in North America: Great Plains of the U.S. and Canada; in South America: Chili, Venezuela; in Asia: 189
Enshi County Hubei Province China, northwestern India, and Turkey; in Europe: Denmark, Norway, 190
Finland, Sweden, Poland, Germany, Ireland, Spain, and Greece; and parts of Australia and New Zealand 191
(Comb, 2001; Dhillon and Dhillon, 2014; Oldfield, 2002; Sasmaz et al., 2015). 192
Part 1
Page 11
Due to the evidence showing the detrimental effects of Se on aquatic life (Hamilton and Buhl, 2003; 193
Hume, 2014; May et al., 2008; Muscatello et al., 2008), the maximum permissible concentration of Se in 194
habitat waters is, on average, 10 times lower than that in drinking water, at values of 1 – 5 µg/L and 10 – 195
50 µg/L, respectively (Lemly, 2007). While overall, these guidelines for Se in freshwater for aquatic life 196
are very low level, they do vary from country-to-country. The Se toxicity criteria for aquatic life (fish and 197
birds) is a controversial issue because there are several factors involved such as vulnerable aquatic life 198
species, type of water (lentic and lotic water), water temperature, fish diet source, age of aquatic 199
animals and other co-contaminants (Lemly, 2007). 200
This section describes Se concentration limits proposed by national and international bodies for drinking 201
water, water intended for (human) consumption, fresh water for irrigation, for livestock and for aquatic 202
life, effluents, and marine water. The guidelines for Se outlined in Table 1 are organized by country or 203
region and are divided into drinking water, groundwater, marine water, water supplies for communities, 204
effluent discharged into waterways, and waters with various intended uses including recreation, 205
irrigation, livestock watering, and for protection of aquatic life. 206
3.1 World Health Organization Water Quality Guidelines
207
In 1958, the World Health Organisation (WHO) established the International standard for drinking water 208
after a questionnaire had circulated among members of the WHO in 1953 and revealed a problem and 209
the need for standard criteria for water quality. As a minimum requirement, drinking water for human 210
consumption must be physically accepted as free from chemical substances and micro-organisms. The 211
first edition of WHO - Standard Drinking Water Quality identified and regulated a few toxic 212
substances: arsenic, chromium, lead, Se and cyanide (World Health Organization, 1958). Five years later, 213
the second edition of WHO - Standard Drinking Water Quality was published with more stringent 214
regulations of maximum allowable concentrations of toxic substances, including Se where the allowable 215
Part 1
Page 12
limit was decreased from 50 µg/L to 10 µg/L, and also added barium and cadmium into the list of toxic 216
substances (World Health Organization, 1963). 217
The chemical and physical requirements for water were classified into four groups including: (1) toxic 218
chemical substances, (2) specific chemicals which may affect health, (3) chemicals affecting the 219
potability of water, and (4) chemical and physical indicators of pollution (World Health Organization, 220
1958, 2011b). Among these classifications, Se falls into the toxic chemical substances category, with the 221
maximum allowable limit closely regulated. Later in WHO - Guideline for Standard Drinking Water 222
Quality (2011, 4th Edition), the chemical substances requirement categories were further classified 223
according to source categories including: 1) natural occurring chemicals, 2) chemicals from industrial 224
sources and human dwellings, 3) chemicals from agricultural activities, and 4) chemicals used in water 225
treatment or from materials in contact with drinking water. The presence of any of these substances in 226
excess of the allowable concentrations results in the water being prohibited in use as a public supply. In 227
WHO – 2011, Se is classified as a atu ally o u i g he i al (World Health Organization, 2011b). 228
Se concentrations in drinking water of WHO –1st Edition in 1958 were set at 50 µg/L, which was 229
revised to 10 µg/L in WHO –2nd Edition in 1963. The current WHO – 4th Edition, Standard for Drinking 230
Water Quality , Se has been revised again to 40 µg/L. The limit of Se in drinking water was calculated 231
using an average total daily intake (TDI of 0.005 mg/kg/day (Canadian International Development 232
Agency, 2017) or 400 µg/day/man (World Health Organization, 2011a)) of water consumed per day, by 233
an adult male (average weight of 70 kg) and a fraction of the TDI allocated to drinking-water (20% of 234
TDI). The TDI of Se at 400 µg per day is recommended by The Food and Agricultural Organization (FAO), 235
the WHO (1998), and the United Kingdom Expert Group on Vitamins and Minerals (EGVM) (World 236
Health Organization, 2011b). However this guideline for Se may be modified according to variable 237
factors such as the weight of the average adult, and the fraction (%) of the TDI represented by Se intake 238
Part 1
Page 13
from the diet. While these factors vary by country and/or geographical region, where these factors are 239
not known, the WHO guideline may be considered (World Health Organization, 2011b). 240
3.2 North American Water Quality Guidelines
241
Preliminary surveys of Se (to establish the background data) were conducted on soil, plant, and water 242
samples from areas in the U.S. Great Plains during the period 1928-1933 (Durrell and Cross, 1944; 243
Lambert, 1947). The survey of water in South Dakota, found 8% of the 586 samples collected from 244
seleniferous regions had Se concentrations exceeding 10 µg/L (Stach, 1978). The U.S. Public Health 245
Service (U.S. PHS) first developed the drinking water standard in 1946 and Se was regulated at a 246
concentration limit of 50 µg/L. In 1962, the U.S. PHS revised the maximum limit of Se in drinking water 247
to 10 µg/L (Department of Health Education and Welfare, 1962; Write, 1962). 248
In 1972, U.S. Federal Government enforced requirements under the Clean Water Act (CWA) regulating 249
the discharge of pollutants into waters as well as quality standards for surface waters, and the Safe 250
Drinking Water Act (SDWA) to regulate the quality of drinking water. The regulations on water quality 251
are mentioned in 40 CFR Part 131 - Water quality standard, Part 132 - Water quality guidance for the 252
great lake system, Part 141 - National primary drinking water, and 40 CFR Part 264 - Standard for owners 253
and operators of hazardous, waste treatment, storage and disposal facilities. In Canada, drinking water 254
standard guidelines are the responsibility of Health Canada, and natural water quality and aquatic 255
system guidelines across Canada are under the control of the Environment and Climate Change of 256
Canada (ECCC) and the individual provinces. 257
Both the U.S. and Canada regulate the maximum limit of Se in drinking water at 50 µg/L as a minimum 258
requirement. However states/provinces can modify the value to satisfy their needs, as long as the value 259
is ot g eate tha that i posed y the Fede al Go e e t’s e ui e e t. Ma y states i the U.“. a d 260
provinces in Canada have revised the Se maximum allowable limit to 10 µg/L, as seen in Table 1. 261
Part 1
Page 14
Researchers in the U.S. and Canada have conducted many studies on the toxicity of Se to aquatic fish 262
and birds (Hamilton and Buhl, 2003; Hume, 2016; May et al., 2008). The U.S. and Canada have 263
established the concentration limit of Se in fresh water to protect aquatic life at the low level of 1 to 5 264
µg/L (see Table 1). The low limit of Se in freshwater is set according to the chronic effect of Se in water 265
column to vulnerable aquatic habitats. Many protocols for assessing the toxicity of Se use models to 266
calculate the daily allowable intake of Se in aquatic habitats and therefore the safe total maximum daily 267
loads for mining effluents, based on data proposed by many researchers (Lemly, 1995, 2002b; Peterson 268
and Nebeker, 1992). 269
Recently, oil sands, coal, metal and mineral mining in Canada have been in the focus of much attention, 270
as a result of proposed, new more stringent regulations for Se in discharge waters from mining 271
operations. In a consultation document issued by Environment and Climate Change Canada (ECCC), it is 272
being recommended that Se be monitored and controlled in mining permits through proposed 273
Amendments to the Metal Mining Effluent Regulations (MMER) (Government of Canada, 2017). MMER 274
were i itially p o ulgated i u de Ca ada’s Fishe ies A t, hi h p ohi its the deposit of 275
deleterious substances into fish frequented waters unless authorized by regulations. The MMER 276
currently require metal mines to monitor the concentration of selenium in their effluent as part of the 277
Effluent Characterization provisions of the Environmental Effects Monitoring requirements. This 278
obligates metal mines to report on hardness, alkalinity, electrical conductivity and temperature of 279
effluent water samples, and also on the concentrations, in total values, of aluminum, iron, mercury, 280
molybdenum, selenium, ammonia and nitrate. In addition to metal mines, the proposed Amendments to 281
MMER would extend regulatory controls to diamond mining and potentially coal mines, and would also 282
expand the list of substances monitored to include chloride, chromium, cobalt, sulphate, thallium, 283
uranium, phosphorous and manganese. Additionally, the proposed Amendments would also add 284
Part 1
Page 15
mandatory fish tissue study for Se, if the annual average of the concentrations reported under the 285
Effluent Characterization are equal to or greater than 5 g/L or if any single grab or composite sample is 286
equal to or greater than 10 g/L. 287
The United States Environment Protection Agency (U.S. EPA) limits the level of Se in effluent at point 288
source in specific industries, including inorganic chemicals (40 CFR Part 415), waste treatment (40 CFR 289
Part 437), steam electric power generation (40 CFR Part 423) and waste combustors (40 CFR 444). 290
Furthermore U.S. EPA has strictly controlled limits for Se in a variety of water resources and a database 291
of Se background concentrations in soils and waters of specific geological areas; these values are 292
available from the USGS (United States Geological Survey, 2017). 293
The U.S. EPA has e e tly eleased a e A uati Life A ie t Wate Quality C ite io fo “ele iu 294
(U.S. EPA., 2016). These new regulations not only examine water-column Se, as has been historically 295
monitored, but also use fish tissue Se concentrations to determine whether an ecosystem is 296
contaminated. Since Se is a reproductive toxin, the primary factor considered is the egg/ovary Se, which 297
is not to exceed 15.1 mg/kg (dry weight) at any given time of measurement. When egg/ovary Se is not 298
(or cannot be) monitored, fish whole body or muscle tissue values are used and cannot exceed 8.5 299
mg/kg or 11.3 mg/kg (dry weight), respectively. Water column Se criteria differ depending on the 300
ecosystem, with average monthly exposure not to exceed 1.5 µg/L in lentic (standing) or 3.1 µg/L in lotic 301
(flowing) waters more than once in a three year period. Intermittent Se water concentration limits are 302
not given as specific values, but are calculated based on the system, as follows: 303
304
���� = � 0 � − �����1− ��� (Equation 1)
305 306
Part 1
Page 16
where WQCint is the intermittent exposure criterion, WQC30 day is the water column monthly exposure
307
criterion for either lentic (1.5 µg/L) or lotic (3.1 µg/L), Cbkg is the average background Se concentration,
308
and fint is the fraction of a 30-day period during which Se concentrations are elevated (fint≥ . ; fo
309
day) (U.S. EPA., 2016). 310
To complicate matters, the areas of concern relating to environmental Se contamination are typically 311
those that involve the release of Se into aquatic ecosystems, usually as (treated) wastewaters. The U.S. 312
EPA egulatio s a ou t fo these s e a ios, lassifyi g the as e i puts to a k o ledge that 313
higher concentrations in both fish tissue and in the water column will be observed until a quasi-steady-314
state is reached; this may take several months (lotic system) to several years (lentic systems). In these 315
systems, fish-tissue Se concentrations do not take priority over water column concentrations as is the 316
case in general, but instead rely on site-specific criteria (U.S. EPA., 2016). 317
3.3 European Union Water Quality Guidelines
318
The EU established the water policy framework Directive 2000/60/EC and Directive 2008/105/EC to 319
avoid long term deterioration of surface water, groundwater and marine water quality (The European 320
Parliament and the Council of the Eurpoean Union, 2000, 2008). Se is only regulated under Directive 321
98/83/EEC on the quality of water intended for human consumption which controlled the maximum 322
level at 10 µg/L (The European Parliament and the Council of the Eurpoean Union, 1998). This value is 323
endorsed by EU members (e.g. Ireland, UK, Germany, Poland, Romania, and Bulgaria, as noted in Table 324
1). Another Directive that involves metals and their compounds is Directive 2006/118/EC (The European 325
Parliament and the Council of the Eurpoean Union, 2006b); other priority substances regulated under 326
EU water policy can be explored in Decision No. 2455/2001/EC (The European Parliament and the 327
Council of the Eurpoean Union, 2001). Interestingly, Se is not specifically mentioned in this document, 328
unlike Directive 80/68/EEC on the release of certain dangerous substances into groundwater and 329
Part 1
Page 17
Directives 76/464/EEC and 2006/11/EEC on pollution caused by certain dangerous substances 330
discharged into the aquatic environment – regulations which are no longer enforced (The European 331
Parliament and the Council of the Eurpoean Union, 1976, 1979, 2006a). 332
3.4 Asian Water Quality Guidelines
333
The exposure of Se to humans (selenosis) was discovered in Enshi District, Hubei Province China 334
between 1958-1963 and at the same time, 150 km away, Keshan disease (Se deficiency) was reported in 335
Zhangjikou District, Hubei Province (Li et al., 2012; Yin et al., 2013). Clearly, soil chemistry plays an 336
important role in the release of Se from different types of soil. Agricultural plants and livestock samples 337
from Zhangjikou and Shadi, Enshi district were sampled and analysed for Se concentrations and it was 338
concluded that the major source of Se exposure to human was from food (rice, corn, vegetable, chicken 339
and egg). Therefore the recommendation was to change daily diets and manage soils to increase Se 340
uptake into plants in the Keshan disease-affected areas. Conversely, the trend of Se in agricultural plants 341
in selenosis-affected areas decreased from 1963 to 2010, due to the loss of Se through natural 342
volatilization (Johnson et al., 1996; Li et al., 2012). Another area in Asia where seleniferous soils have 343
been reported is Northwestern India (Dhillon and Dhillon, 2014). There is little English information 344
available relating to standards for Se in waters in Asia, though the drinking water standard in many Asian 345
countries is set at 10 µg/L. 346
Part 1
Page 18 Table 1: Waters quality guidelines for selenium
348
Matrix Limit
(µg/L) Country or Organisation Reference
Drinking Water 10 Canada: British Columbia Ontario Quebec Saskatchewan New Brunswick United States: Oklahoma Australia Brazil China European Union Germany Ireland Japan India Malaysia Mexico Poland Russia Singapore United Kingdom Thailand
(British Columbia Ministry of Environment, 2017b) (Ontario Minsitry of the Environment, 2002) (Government of Québec, 2017)
(Government of Saskatchewan, 2002) (Government of New Brunswick, 2018) (Oklahoma Administrative Code, 2016)
(Australian National Health and Medical Research Council and Australian National Resource
Management Ministerial Council, 2016) (Brazilian Ministry of the Environment, 2012) (Ministry of Health of China, 2006)
(The European Parliament and the Council of the Eurpoean Union, 1998)
(Bartel, 2007) (Hayes et al., 2012)
(Japan Ministry of Health Labour and Welfare, 2004) (Bureau of Indian Standards, 1991)
(Ministry of Health Malaysia, 2010) (Martell et al., 2016)
(Polish Ministry of Health, 2010) (Ministry of Health of Russia, 2002)
(National Environment Agency Singapore, 2008) (Government of the United Kingdom, 2016) (Ministry of Industry Thailand, 1968)
Drinking water 40
World Health Organization Abu Dhabi
(World Health Organization, 2011b)
(The Regulation and Supervision Bureau for the water wastewater and electricity sector in the Emirate of Abu Dhabi, 2014)
Drinking water 50
Canada:
Federal Government Alberta
Newfoundland and Labrador Nova Scotia
Prince Edward Island Yukon United States: U.S. EPA Arizona California Colorado Kansas Minnesota (Health Canada, 2017) (Government of Alberta, 2016)
(Newfoundland Department of Environment and Conservation, 2013)
(Province of Nova Scotia, 2017)
(Government of Prince Edward Island, 2015) (Commission of Yukon, 2007)
(U.S. EPA, 2009)
(Arizona Department of Environmental Quality, 2009)
(Government of California, 2017)
(Colorado Department of Public Health and Environment, 2005)
(Kansas Department of Health and Environment, 2017)
Part 1 Page 19 Missouri Montana Nevada North Dakota Nebraska New Mexico South Carolina Tennessee Texas West Virginia Wisconsin Wyoming South Africa Tanzania
(Missouri Department of Natural Resources, 2015) (Montana Department of Environmental Quality, 2015)
(Nevada Administrative Code, 2016) (North Dakota Centruy Code, 2001)
(Nebraska Department of Environmental Quality, 2015)
(New Mexico Administrative Code, 2013) (South Carolina Department of Health and Environmental Control, 2014)
(Tennessee Department of Environment and Conservation, 2008)
(Texas Commission on Environmental Quality, 2014) (West Virginia Department of Environmental Protection, 2015)
(Wisconsin Department of Natural Resources, 2017) (Wyoming Department of Environmental Quality, 2016)
(Department of Water Affairs and Forestry, 1996b) (Energy and Water Utilities Regulatory Authority of Tanzania, 2014)
Water for human consumption
20
South Africa (Department of Water Affairs and Forestry, 1996a)
Water for human consumption
120
United States:
Oregon (Oregon Department of Environmental Quality, 2011) Water for human consumption 170 United States: Idaho Iowa Vermont Virginia
(Idaho Department of Environmental Quality, 2011) (Iowa Department of Natural Resources, 2017) (Vermont Department of Environmental Conservation, 2014)
(Virginia State Water Control Board, 2011) Natural mineral
water 10
Codex (Codex Alimentarius, 2001)
Water for
livestock 20
Australia and New Zealand (Australian and New Zealand Environment and Conservation Council and Agriculture and Resource Management Council of Austraila and New Zealand, 2000)
Water for
livestock 30
Canada:
British Columbia (British Columbia Ministry of Environment, 2017a)
Water for livestock 50 Canada: Federal Government Ontario United States: Arizona Nevada Brazil South Africa
(Canadian Council of Minister of the Environment, 2017)
(Ontario Ministry of the Environment, 1994) (Arizona Department of Environmental Quality, 2009)
(Nevada Administrative Code, 2016)
(Brazilian Ministry of the Environment, 2012) (Department of Water Affairs and Forestry, 1996a)
Part 1
Page 20 Water for
irrigation 10
Canada:
British Columbia (British Columbia Ministry of Environment, 2017a)
Water for irrigation 20 Canada: Alberta Ontario United States: Arizona Colorado Nebraska Nevada South Africa
United Nations Food and Agriculture Organization
(Government of Alberta, 2016)
(Ontario Ministry of the Environment, 2011) (Arizona Department of Environmental Quality, 2009)
(Colorado Department of Public Health and Environment, 2005)
(Nebraska Department of Environmental Quality, 2015)
(Nevada Administrative Code, 2016)
(Department of Water Affairs and Forestry, 1996a) (Ayers and Westcot, 1994)
Water for
irrigation 50
United States:
Utah (Utah Administrative Code, 2017)
Water for irrigation (Long term, 100 years)
20
Australia and New Zealand (Australian and New Zealand Environment and Conservation Council and Agriculture and Resource Management Council of Austraila and New Zealand, 2000)
Water for irrigation (short term, 20 years)
50
Australia and New Zealand (Australian and New Zealand Environment and Conservation Council and Agriculture and Resource Management Council of Austraila and New Zealand, 2000) Water for irrigation (intermittent) 50 Canada:
Federal Government (Canadian Council of Minister of the Environment, 2017)
Fresh water for aquatic life 1
Canada:
Federal Government Alberta
(Canadian Council of Ministers of the Environment, 2017)
(Alberta Environment and Sustainable Resource Development, 2014)
Fresh water for aquatic life 2 Canada: British Columbia United States: Arizona South Africa
(British Columbia Ministry of Environment, 2017a) (Arizona Department of Environmental Quality, 2009)
(Department of Water Affairs and Forestry, 1996b)
Fresh water for aquatic life 4.6
United States: Colorado Pennsylvania Utah
(Colorado Department of Public Health and Environment, 2005)
(Pennsylvania Code, 2012) (Utah Administrative Code, 2017)
Fresh water for aquatic life 5 United States: Alabama Florida Georgia Maine
(Alabama Department of Environmental Management, 2017)
(Florida Administrative Code, 2015)
(Georgia Department of Natural Resources, 2016) (Maine Department of Environmental Protection,
Part 1 Page 21 Nebraska New Hampshire North Carolina North Dakota South Carolina South Dakota Virginia Tennessee Vermont Washington West Virginia 2005)
(Nebraska Department of Environmental Quality, 2015)
(New Hampshire Code of Administrative Rules, 2015)
(North Carolina Department of Environment and Natural Resources, 2007)
(North Dakota Centruy Code, 2001) (South Carolina Department of Health and Environmental Control, 2014)
(South Dakota Legislative Research Council, 1999) (Virginia State Water Control Board, 2011) (Tennessee Department of Environment and Conservation, 2008)
(Vermont Department of Environmental Conservation, 2014)
(Washington State Legislature, 2016) (West Virginia Department of Environmental Protection, 2015)
Fresh water for aquatic life 10
Australia and New Zealand (Australian and New Zealand Environment and Conservation Council and Agriculture and Resource Management Council of Austraila and New Zealand, 2000)
Fresh water for aquatic life 35
United States:
Oregon (Oregon Department of Environmental Quality, 2011)
Fresh water for aquatic life 100
Canada:
Ontario (Ontario Ministry of the Environment, 1994)
Fresh water 3 Germany (Irmer et al., 2014)
Fresh water (Lentic, chronic 30 day)
1.5
United States:
U.S. EPA (U.S. EPA., 2016)
Fresh water (Lotic, chronic 30 day)
3.1
United States:
U.S. EPA (U.S. EPA., 2016)
Fresh water (continuous concentration)
5
United States:
U.S. EPA (U.S. EPA., 2016)
Surface water 10 Ireland Bulgaria Romania (Hayes et al., 2012) (Stoimenova et al., 1998) (Popovici et al., 1998) Marine water 10
Australia and New Zealand
Brazil
(Australian and New Zealand Environment and Conservation Council and Agriculture and Resource Management Council of Austraila and New Zealand, 2000)
(Brazilian Ministry of the Environment, 2012) Marine water
(chronic) 71
United States:
U.S. EPA (U.S. EPA, 2017d)
Groundwater 1 Canada:
British Columbia (British Columbia Ministry of Environment, 2017b) Groundwater 10 Brazil (Brazilian Ministry of the Environment, 2012)
Part 1
Page 22 Japan
Thailand
(Japan Ministry of the Environment.) (Thailand Ministry of Industry, 1978) Groundwater 50
Canada: Alberta
Newfoundland and Labrador
(Government of Alberta, 2016)
(Water Resources Management Division, 2009) Groundwater (Full depth background site condition standards) 5 Canada:
Ontario (Ontario Ministry of the Environment, 2011)
Groundwater; generic site, full depth generic and stratified site condition standards in a potable groundwater condition, and generic site condition standards for use within 30 m of a water body in a potable groundwater condition) 10 Canada:
Ontario (Ontario Ministry of the Environment, 2011)
Groundwater; Generic site condition standards for shallow soils in a non-potable groundwater condition and Generic site condition standards for use within 30 m of a water body in a non-potable groundwater condition) 50 Canada:
Ontario (Ontario Ministry of the Environment, 2011)
Groundwater (Full depth generic and Stratified site condition standards in a non-potable groundwater 63 Canada:
Part 1
Page 23 condition)
Groundwater for
livestock 10
Brazil (Brazilian Ministry of the Environment, 2012) Groundwater for
irrigation 50
Brazil (Brazilian Ministry of the Environment, 2012)
Effluent 20 Thailand (Thailand Ministry of Science Technology and
Environment, 1996)
Effluent 50 India (Bureau of Indian Standards, 1981; Thailand Ministry
of Industry, 1996)
Effluent 300 Brazil (Brazilian Ministry of the Environment, 2012)
Effluent 100
United Nations World Bank Group
United States: Florida
(The World Bank Group, 1999)
(Florida Department of State, 2014)
Effluent 500 Singapore (National Environment Agency of Singapore, 2017) Effluent into
controlled water 10
Singapore (National Environment Agency of Singapore, 2017) Effluent into
controlled water 20
Thailand (Thailand Ministry of Industry, 1996)
Effluent into
groundwater 20
United States:
New York (New York Department of State-Division of Administrative Rules, 2016)
Effluent into harbor and irrigation
20
Dubai (Government of Dubai, 2013)
Effluent into the environment or to storm sewers
50
Canada:
Newfoundland and Labrador (Ryan, 2003) Effluent into
coastal 50
India (Bureau of Indian Standards, 1981)
Effluent into municipal or industrial effluent treatment 100 Canada:
Newfoundland and Labrador (Ryan, 2003)
Effluent into seawater (instantaneous)
150
United States:
California (California State Water Resources Control Board, 2015)
349
4. Analytical Methods for Selenium in Waters Used by U.S. Regulatory Bodies
350
This section will focus on the analytical methods for the determination of Se in waters used by U.S 351
Federal Departments a d ill also dis uss othe sta da d ethods that are recognised worldwide. 352
These standard methods for water and wastewater analysis are published by highly respected scientific 353
Part 1
Page 24
organisations, though they are not mandatory standard test methods based on any official legislation. 354
However, the local regulatory authority under the Nation Acts has endorsed and approved the standard 355
methods for nationwide or regional use. 356
4.1 Selenium Determination by Gravimetric Methods
357
Follo i g “ edish s ie tist Ja o Be zelius’ i itial dis o e y of “e i 1818 (Trofast, 2011), he 358
collaborated with Heinrich Rose to develop the first method for the quantitative analysis of Se based on 359
a gravimetric method Ĺszĺ E dey et al., 1965). Later, a similar concept of gravimetric measurement 360
was developed, but with titration to quantify Se in seleniferous materials and geological samples 361
(Dudley and Byers, 1934; Norris and Fay, 1896; Noyes and Bray, 1924; Scott, 1917). AOAC International 362
u offi ially, the Asso iatio of A alyti al Co u ities modified these two methods to analyze Se in 363
biological samples as method AOAC 936.04 - Se in plants , and AOAC method 939.09 - Se in food 364
(Horwitz, 2000; Robinson et al., 1934). The sample preparation to separate Se from the sample matrix 365
was modified for Se determination in water by the USGS in 1960 (Rainwater and Thatcher, 1960). 366
For this analysis, Se is oxidised by hydrogen peroxide, sulfuric and nitric acid, then reduced to H2SeO4
367
with hydrogen bromide-bromine to liberate Se tetra-bromide in a distillate. The collected distillate is 368
then reduced by hydroxylamine hydrochloride or sodium bisulphite and oven dried to precipitate Se for 369
quantification by weighing. This technique is not appropriate for Se concentrations less than 1 mg/kg. 370
The quantitative analysis of Se in water can be achieved by the precipitation of elemental Se0 in a gum 371
arabic solution and matching the colour against standard Se solutions (Robinson et al., 1934). 372
4.2 Selenium Determination by Visual Colorimetric Comparison
373
The colorimetric comparison of elemental Se suspensions was first used by the U.S. PHS in 1946. At the 374
time, Se was regulated at a maximum level of 50 µg/L (World Health Organization, 1958), and the 375
Part 1
Page 25
gravimetric method was not sufficient to measure Se at the low concentrations present in drinking 376
water. Therefore, the method of analysis for Se was modified to use a colorimetric comparison. The 377
sample is prepared in the same way as the gravimetric method, mentioned above. The distillate is 378
collected in hydrogen bromide-bromine solution. The fine pink to red Se particulate can be observed 379
after the colour interference of bromine is removed. The pink particles are suspended in the solution of 380
gum arabic in a Nessler tube and ready for visual colour matching against Se standard solution. The 381
visual colour comparison was claimed to be able to detect Se present in concentration from 5 to 10 382
µg/L. The colorimetric comparison appeared in the Standard test methods for the examination of water, 383
sewage and industrial wastes (American Public Health Association (APHA), in 1955) and WHO during the 384
period from 1958 to 1971 (World Health Organization, 1958, 1963, 1971). The disadvantages of this 385
method include the fact that it requires a large amount of sample (up to 10 L), the long time required for 386
the distillation process, and the toxicity of the bromine solution. 387
4.3 Selenium Determination by Titration
388
Improved analysis of Se was achieved by titrimetric method. Following distillation and Se precipitation, 389
as described above, the Se particles are re-dissolved with hydrogen bromide-bromine solution to form 390
H2SeO3 and an excess of 0.001 N sodium thiosulfate is added. The solution is then back titrated with a
391
standard iodine solution using a starch solution as the indicator. The back titration is calculated as 1.00 392
mL of 0.001 N sodium thiosulfate being equivalent to 0.0198 mg of Se. This method can provide a low 393
detection limits for Se when using larger volumes of water (maximum of 100 mL) containing Se in 394
amounts less than 0.5 mg. With careful work, results are accurate and reproducible to ±0.002 mg. 395
Potential sources of interference include the presence of oxidizing compounds in solution. This titration 396
of Se with excess sodium thiosulfate is known as Norris-Fay titration and has been used since 1896 397
(Coleman and McCrosky, 1937). The quantitative analysis of Se using distillation and titration appeared 398
Part 1
Page 26
i Methods fo Colle tio a d A alysis of Wate “a ples pu lished y the USGS in 1960 as method 399
D:33a-1: Norris-Fay Titration Method, which was modified from the Association of Official Agricultural 400
Chemists in 1945 (Rainwater and Thatcher, 1960). 401
4.4 Selenium Determination by Colorimetry (Spectrophotometry)
402
A spot test for Se was first developed for qualitative purposes, using the redox reaction of H2SeO3 with
403
reducing agents (hydriodic acid or thiourea). Se0 obtained from this step is further reacted with sulfuric 404
acid to form a blue coloured complex with codeine. This method was used for biological samples and 405
good results were achieved at concentrations above 1 mg/kg. The colorimetric-basis of this complexing 406
method gave it the potential for development into a quantitative method (Frank et al., 1936; Horn, 407
1934; Stahl, 1969). 408
In 1962, the American Water Works Association (AWWA) / American Public Health Association (APHA), 409
joint committee considered a new method proposed for the determination Se in water by colorimetry 410
using 3,3-diaminobenzidine as a complexing agent. Here, following sample digestion, complexation is 411
completed under alkaline conditions and the resulting red-coloured 5,5-dipiazselenol is extracted into 412
an organic phase (typically toluene) for spectroscopic measurement against a standard solution which is 413
prepared in the same manner. However, other metals interfere with this complexation, and must be 414
removed through chelation with ethylenediamine tetra-acetic acid (EDTA) to ensure accurate Se analysis 415
(U.S. EPA., 1971b). It should be noted that 3,3-diaminobenzidine is carcinogen and therefore stringent 416
regulations are in place regarding its commercial availability. 417
The tested method and results of Se concentrations in waters from a collaborative study had been 418
proposed by the AWWA/APHA. There was an agreement in results among the participating laboratories 419
with accurate and precise data (AWWA Editorial Board, 1963; Skougstad and Fishman, 1963). This 420
method replaced the visual colour comparison method a d as pu lished i “ta da d Method of 421
Part 1
Page 27
A alysis i Wate a d Wastes by APHA, 12nd
Edition in 1965. This method was used for Se in surface 422
water by the U.S. Federal Water Pollution Control Administration in 1968(Federal Water Pollution 423
Control Administration, 1968; U.S. EPA., 1971a). The USGS also e do sed this ethod i Methods fo 424
Collection and Analysis of Water Samples for Dissol ed Mi e als a d Gases i (Brown et al., 425
1970). This colorimetric method with 3,3-diaminobenzidine was able to detect as little as 10 µg Se using 426
wavelength 420 nm. 427
U.S. Federal Water Pollution Control and USGS had spe ified the te s dissol ed “e , suspe ded “e , 428
a d total “e i thei test epo ts. Dissol ed “e is o tai ed he the sa ple is filte ed th ough a . 429
µm membrane prior to analysis, total Se is the amount present in the water without filtration, and 430
suspended Se is the difference between the first two measurements (Federal Water Pollution Control 431
Administration, 1968; Wallschläger and Roehl, 2001). At present, the determination of Se can be 432
spe ified as dissol ed “e a d total e o e a le “e 433
Alternatively, other complexing agents such as 2,3-Diaminonaphthalene (DAN) can be used and produce 434
brightly coloured and strongly fluorescent piazselenol compounds which can be measured at 480 nm 435
with detection limits around 10 µg/L. The DAN colorimetric method for Se appeared in APHA-Standard 436
Method, 22nd Edition in 2012 as Standard Method 3500-Se(C) (Rice et al., 2012). The development of 437
new complexing agents is still an active field of research (Krishnaiah et al., 2003; Narayana and Mathew, 438
2006; Soruraddin et al., 2011). Commercial test kits for the determination of Se in water based on this 439
type of chemistry are capable of detecting Se in the 0.01 to 1.0 mg/L range when used with a 1 cm 440
absorption cell (Xu et al., 1997). 441
4.5 Selenium Determination by Fluorometry
442
Similar to the 3,3-diaminobezidine colorimetric method for Se analysis, a fluorescent complexing agent, 443
2,3-diaminonaphthalene (DAN), was developed and provides better sensitivity than conventional 444
Part 1
Page 28
colorimetric reagents. The distillation process for sample preparation is omitted in these procedures, 445
making this method significantly faster. However, DAN does need to be prepared freshly prior to 446
analysis due to its sensitivity to air and light. Similarly, the use of EDTA is often required to complex 447
metals which interfere with Se complexation. 448
For this method, the sample is acid digested with strong acid and reduced to H2SeO3 by hydrochloric
449
acid. EDTA is added to mask interfering metals (tellurium, copper, zinc and aluminum) and the DAN 450
solution is added. The 4,5-benzopiazselenol formed through this reaction is extracted into toluene, 451
hexane, decahydronaphthalene, or cyclohexane (cyclohexane is recommended due to its low 452
background interference). The colour of 4,5-benzopiazselenol depends on pH, reaction time and light 453
conditions. The measurement is done at an excitation wavelength of 375nm and a fluorescent emission 454
wavelength of 525 nm (Lott et al., 1963). The fluorometric method had been used for Se in geological 455
surveys of waters by the U.S. Water Research Institute and claimed to be able to analyse Se at 456
concentration as low as 1 µg/L (Stach, 1978). 457
4.6 Selenium by Hydride Generation – Atomic Absorption Spectrometry
458
It has long been known that distinctive colours are produced when compounds of certain metals are 459
vaporized in flames. Since 1955, flame atomic absorption spectrometry (FAAS) has taken advantage of 460
this phenomenon and has been widely used for the quantitative analysis of many elements; however, it 461
is still not suitable for metalloids including Se (L'Vov, 1961; Walsh, 1955). Direct measurement of Se by 462
FAAS is not recommended because the absorption line of Se at 196 nm is interfered by hydrocarbon 463
molecules generated from air-acetylene in the flame. Other types of gas (i.e. propane-air, argon-464
hydrogen and nitrogen-hydrogen) have been studied to reduce the spectral absorption of hydrocarbons 465
below 200 nm. Moreover, increasing the intensity of the light source by using an electrodeless 466
Part 1
Page 29
discharge lamp was examined, but the detection limit of 200 µg/L was not suitable for the analysis of Se 467
in most natural waters (Thompson and Thomerson, 1974; Winefordner and Vickers, 1972). 468
Due to the limited sensitivity for metalloids (Se, As, Hg) analysis by hydride generation (HG) FAAS has 469
been developed. HG for Se involves two reducing steps: first reducing Se(VI) in digested solutions to 470
Se(IV) using hydrochloric acid, stannous chloride, potassium/sodium iodide, or potassium bromide. The 471
second step involves the reduction of Se(IV) to Se-2 using zinc powder, or magnesium or sodium 472
borohydride in acidic solution to form volatile selenides (typically H2Se). HG is widely used for the
473
analysis of Se in waters due to its sensitivity, specificity, and affordability; therefore, the research on 474
reducing reagents to increase the efficiency of hydride formation are still active and recently there has 475
been a trend to move from inorganic to organic reducing agents (Limchoowong et al., 2015; Musil and 476
Matoušek, ; Welz a d Šu a o ́, ; Ya a oto a d Ku a a u, . 477
The HG reaction is prepared by batch or continuous (flow injection) systems. Samples must be digested 478
to ensure that all Se is present as inorganic species before proceeding with the two reduction steps 479
mentioned above. Later, H2Se is purged into a quartz tube placed on a furnace or burner and atomised
480
by flame or flameless AAS. The measurement is taken as a transient signal and quantified by peak height 481
or integrated peak area. The method of batch HG has the advantage of being able to handle large 482
sample volumes (up to 100mL), but it is time consuming to reach the equilibrium required for hydride 483
reaction and diffusion to the flame. Continuous flow injection HG coupled to AAS (FI-HG-AAS) was 484
developed with automated systems, reducing time, and improving precision; however, these methods 485
are rather expensive (Chan and Sadana, 1992; Limchoowong et al., 2015; Piston and Knochen, 2012). 486
In 1974, the utilization of batch HG-AAS for Se analysis was issued by the U.S. EPA as Method 270.3 for 487
dissolved, suspended, and total Se in drinking water, freshwater, and marine waters and the USGS 488
published a HG-AAS protocol for total Se analysis as Method number I-3667-85 for batch HG-AAS and FI-489
Part 1
Page 30
HG-AAS (Fishman and Friedman, 1989; U.S. EPA., 1983). The USGS used the HG-AAS technique for a Se 490
survey of selected streams in regions with mineable coal reserves in Eastern Kentucky in 1980; at the 491
time, Se in waters was regulated at 5 µg/L. Most of the water samples from the sampling sites were 492
reported at 0-2 µg/L (detection limit was 1 µg/L); only two samples were found to contain higher 493
concentrations of Se, at 5 and 6 µg/L (Downing-Kunz et al., 2005). HG-AAS for Se analysis appeared in 494
APHA-Standard Method 301A in 1975, which later became Standard Methods 3114B (manual HG-AAS) 495
and 3114C (continuous AAS) (Rand et al., 1976; Rice et al., 2012). The capability to detect Se by HG-496
AAS below 1 µg/L was reported with sample volumes of 50-100 mL for batch systems (Fishman and 497
Friedman, 1989; International Organization for Standardization, 2013). 498
The current version of WHO-Guidelines for Drinking Water Quality references HG-AAS for Se analysis. 499
U.S EPA 40 CFR 136 (Clean Act Water) and 40 CFR 141 (Safe Drinking Water Act) have approved 500
mandatory methods for Se analysis by HG as follows: APHA-Standard Method 3114B, 3114C, ASTM 501
D3859-A and USGS Method I-3667-85. The USGS Method 1-3667-85 is not mentioned for Se analysis in 502
drinking water by 40CFR 141 (ASTM International, 2008; U.S. EPA, 2017a, c, e). However, there is a 503
concern based on the sample preparation by acid digestion using perchloric acid, which is not 504
recommended by the U.S. EPA because of its potential danger (U.S. EPA., 1994). 505
4.7 Selenium Determination by Graphite Furnace Atomic Absorption Spectrometry
506
Graphite furnace (GF)-AAS, also known as electro-thermal atomization (ETA)-AAS, electro-thermal 507
vaporization (ETV)-AAS, or flameless AAS, was developed at the same time as FAAS. GF-AAS affords the 508
determination of most metallic elements with a smaller amount of sample consumed (10-50 µL), 509
excellent sensitivities and detection limits, and direct analysis without sample preparation. However, the 510
disadvantage is the cost of GF-AAS itself, which includes the consumption of a graphite tube and 511