HAL Id: hal-00298779
https://hal.archives-ouvertes.fr/hal-00298779
Submitted on 9 Oct 2006
HAL is a multi-disciplinary open access archive for the deposit and dissemination of sci-entific research documents, whether they are pub-lished or not. The documents may come from teaching and research institutions in France or abroad, or from public or private research centers.
L’archive ouverte pluridisciplinaire HAL, est destinée au dépôt et à la diffusion de documents scientifiques de niveau recherche, publiés ou non, émanant des établissements d’enseignement et de recherche français ou étrangers, des laboratoires publics ou privés.
The scale of typhoon RUSA
N. W. Kim, Y. S. Won, I. M. Chung
To cite this version:
N. W. Kim, Y. S. Won, I. M. Chung. The scale of typhoon RUSA. Hydrology and Earth System Sciences Discussions, European Geosciences Union, 2006, 3 (5), pp.3147-3182. �hal-00298779�
HESSD
3, 3147–3182, 2006 Typhoon RUSA N. W. Kim et al. Title Page Abstract Introduction Conclusions References Tables Figures J I J I Back CloseFull Screen / Esc
Printer-friendly Version
Interactive Discussion
EGU Hydrol. Earth Syst. Sci. Discuss., 3, 3147–3182, 2006
www.hydrol-earth-syst-sci-discuss.net/3/3147/2006/ © Author(s) 2006. This work is licensed
under a Creative Commons License.
Hydrology and Earth System Sciences Discussions
Papers published in Hydrology and Earth System Sciences Discussions are under open-access review for the journal Hydrology and Earth System Sciences
The scale of typhoon RUSA
N. W. Kim1, Y. S. Won2, and I. M. Chung3
1
Research Fellow, Water Resources Research Department, Korea Institute of Construction Technology, 2311, Daehwa-Dong, Ilsan-Gu, Goyang-Si, Gyeonggi-Do, 411-712, Republic of Korea
2Researcher, River Information Center of Han River Flood Control Office, MOCT, Seoul,
137-049, Republic of Korea
3
Senior Researcher, Water Resources Research Department, Korea Institute of Construction Technology, 2311, Daehwa-Dong, Ilsan-Gu, Goyang-Si, Gyeonggi-Do, 411-712, Republic of Korea
Received: 8 August 2006 – Accepted: 18 September 2006 – Published: 9 October 2006 Correspondence to: I. M. Chung ([email protected])
HESSD
3, 3147–3182, 2006 Typhoon RUSA N. W. Kim et al. Title Page Abstract Introduction Conclusions References Tables Figures J I J I Back CloseFull Screen / Esc
Printer-friendly Version
Interactive Discussion
EGU Abstract
In August 2002, Typhoon RUSA hit Korea with severe gale and storm, causing exten-sive damage throughout the whole country and especially in the Gangneung area. Even on a single day, Typhoon RUSA recorded up to 879.5 mm of rainfall in the Gangneung area. Quantitative and qualitative analyses of the scale of Typhoon RUSA 5
are performed in this study. Most of the inland affected by RUSA in the Korean Penin-sula recorded heavy rainfall, equivalent to a return period of more than 200 years. Es-pecially, rainfall of 24 h duration exceeded the maxima observed so far. Although areal rainfall showed a rapidly decreasing trend with increasing area, it reached 96 percent of the existing PMP within a 2000 km2area and recorded the maximum observed value 10
of Korea according to a DAD analysis of rainfall. Re-estimated PMP values obtained from a hydro-meteorological approach compared with existing PMP estimates revealed a discrepancy between the two values, which showed that re-estimated PMP values of 12 to 24 h duration within 2000 km2 exceeded the existing PMP estimates of Ko-rea. Therefore, modification of the existing PMP is required, which is used as a design 15
hydrological variable of hydraulic structure.
1 Introduction
There have been a lot of natural disasters which have hit Korea heavily during the last years of the 20th century. Some of these natural storms and flood disasters include: Typhoon JANIS in 1995, heavy rainfalls in 1996 and 1998, typhoon YANNI in 1998, a 20
heavy storm in 1999, typhoon PRAPIRON in 2000 and typhoon RUSA in 2002. When South Korea was hit by heavy rainfall in 1999, it was recorded to be the most devastat-ing natural disasters to hit Korea throughout the entire hydrological history at that time. It affected the lives of many along with casualties and an enormous amount of damage totaling up to nearly 1 billion USD. However, when RUSA hit South Korea, it brought 25
HESSD
3, 3147–3182, 2006 Typhoon RUSA N. W. Kim et al. Title Page Abstract Introduction Conclusions References Tables Figures J I J I Back CloseFull Screen / Esc
Printer-friendly Version
Interactive Discussion
EGU of the heavy rainfall in 1999.
Typhoon RUSA passed through the Korean Peninsula and brought a tremendous amount of damage with gale and storm to the country. Compared to other parts of Korea, the Gangeung area recorded the largest amount of damage. Daily rainfall in Gangneung, during this period, was up to 879.5 mm and this was equivalent to 62 5
percent of the average annual rainfall (1401.9 mm) in this particular area. This record exceeded by more than 300 mm the record in Jangheung (547.4 mm) on 2 September 1981, which was recorded to be the largest rainfall in Korean History. This devastating storm went to affect other areas such as the Yeoungdong region (eastern part of Tae-baek Mountain), which wreaked havoc in major cities such as Gangneung, Samcheok, 10
Sokcho and Yangyang.
This paper evaluates the formation of heavy rainfall in terms of the mechanism of occurrence and decay with time and space. This research will also attempt to investi-gate the scale of Typhoon RUSA using quantitative and qualitative analysis. Due to the fact that the main issue at hand is the magnitude of rainfall by duration and area, the 15
evaluation of the scale of Typhoon RUSA will depend on the point probable rainfall and possible maximum precipitation.
2 The origin of Typhoon RUSA
Typhoon RUSA originated in the location which apart 1800 km from the east-northeast of Guam at 09:00 a.m. on 23 August 2002. Her central atmospheric pressure was 20
950 hPa and the central wind velocity within the storm was 36 m per second. Sporadi-cally, she maintained her magnitude as she approached and hit the Goheung peninsula located in the Jeonnam province of Korea at 03:00 PM on 31 August. A typhoon which develops from vapor of high water temperatures of the Pacific Tropics gradually weak-ens when it travels north due to the difference in temperature. It was anticipated that 25
RUSA would weaken as she reached the Japanese sea; however, she maintained her power. Furthermore, typhoons generally loose power when they arrive inland because
HESSD
3, 3147–3182, 2006 Typhoon RUSA N. W. Kim et al. Title Page Abstract Introduction Conclusions References Tables Figures J I J I Back CloseFull Screen / Esc
Printer-friendly Version
Interactive Discussion
EGU of many obstacles, such as mountains. However, RUSA sustained maximum intensity
and power as she reached Korea and devastated the whole nation for quite some time. The main factor of unabated power was that the temperature of the southern sea was higher than that of average. This allowed RUSA to take energy continuously from the sea. The temperature of the southern sea was 27∼29 C and generated vapor which 5
helped RUSA maintain her power. Additionally, the prevailing westerly and the upper air above the North Pacific, which lay from the east to the west in Korean Peninsula, was exceptionally weak. These phenomena seemed to block the movement of velocity and restrict changes in direction of the typhoon. Consequently, she penetrated the Korean Peninsula with powerful winds of maximum speeds at 30∼50 m per second and torren-10
tial rainfalls reaching up to 871 mm on a daily basis. According to the analysis, low and humid easterly wind blew to Yeongdong as the typhoon approached the north. Yeong-don is in the region of Gangwon province, located near the edge of the North Pacific, which meant that a zone of high atmospheric humidity would surround Gangneung. In this worst-case scenario, the cold atmosphere at an altitude of 1.5 km and the hot 15
atmosphere of the tropical cyclone joined at the upper atmosphere of Gangeung and created a storm. Additionally, humid northeast current air rose from Taebaek Mountain and generated a severe storm around the Gangwon province, which includes areas such as Gangneung and Sokcho. Conversely, Yeongseo region(western part of Tae-baek Mountain) had relatively less precipitation with air going down along the mountain. 20
3 The direction of the typhoon
3.1 The path of the Typhoon and spatial distribution of rainfall
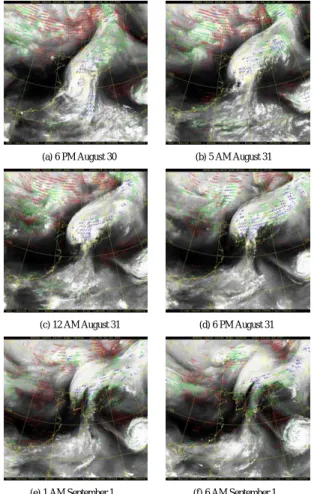
Typhoon RUSA slowly approached to the north from approximately 330 kilometers off the south-southeast of Jeju Island at 05:00 p.m. on 30 August. She caused torrential rainfall on Jeju Island and the southern part of Korea with the approaching helicoids 25
HESSD
3, 3147–3182, 2006 Typhoon RUSA N. W. Kim et al. Title Page Abstract Introduction Conclusions References Tables Figures J I J I Back CloseFull Screen / Esc
Printer-friendly Version
Interactive Discussion
EGU the north, and 170 kilometers off the south-southeast of Jeju Island. She also extended
to most of the inland and sea, except central and southwestern part of Korean Penin-sula (Fig. 1b). Henceforth, the storm passed near the Jeju Island Sea around noon (Fig. 1c), and at 06:00 p.m., it reached the south coast of the Goheung Peninsula of Jeonnam province, causing heavy rainfall. There were also severe rain and wind at the 5
mountainous areas of the southern part and Yeongdong of Gangwon province (Fig. 1d). She passed through Muju of Jeonbuk province at 01:00 a.m. on 1 September. Mean-while, the storm was getting weaker at the southern part and on Jeju Island, which was located at the backside of the typhoon during that time. However, torrential rainfall in the mid-west area moved to the front side of the typhoon. Specifically, the severe rain-10
storm had continued to the Yeoungdong area of the Gangwon province (Fig. 1e). Since then, typhoon RUSA, the 15th of the season, lost her power as she moved from the north-northeast to the northeast and passed through Gangneung-Donghae as shown in (Fig. 1f). The Path of the typhoon is shown in Fig. 2.
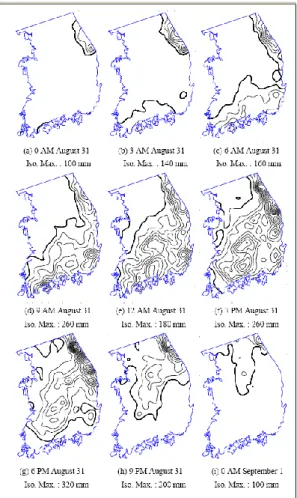
Figure 3 shows the spatial distribution of rainfall a three hourly intervals from mid-15
night of 31 August to 06:00 a.m. on 1 September. As presented in the figure, Typhoon RUSA passed from the southeastern part such as Jeju Island and Goheung Penin-sula and moved toward the Midwest and the Northeast, and eventually lost her power. Under the influence of the typhoon, an inflow of moist air from the east, and the topo-graphical factor, Taebaek Mountain, there was more precipitation than in the center of 20
the typhoon in Yeoungdong area from 31 August to 1 September. In detail, the center of cumulative rainfall was in the southwestern part of the country such as Jeju Island, Daeheuksan Island and Jin Island from 06:00 p.m. to midnight on 30 August. The storm expanded towards the south coast from midnight to 06:00 a.m. on 31 August. However, the center of rainfall was in the Samcheok area and rainfall duration in the 25
Singi-Myeon district was 107.0 mm and 95.0 mm in Miro-Myeon district (Table 1). Typhoon RUSA expanded her power to Jeonnam and Gyeoungnam province from 06:00 a.m. to 12:00 p.m. on 31 August. The center of rainfall moved slightly over to Gangneung, and accumulated to about 237.5 mm of rainfall in Gangneung and 180 mm
HESSD
3, 3147–3182, 2006 Typhoon RUSA N. W. Kim et al. Title Page Abstract Introduction Conclusions References Tables Figures J I J I Back CloseFull Screen / Esc
Printer-friendly Version
Interactive Discussion
EGU in Daegwallyeong. When she passed Jeju island, the south coast of Goheung
Penin-sula of Jeonnam province, from 12 p.m. to 6 p.m. on August 31, rainfall was concen-trated in the south and Yeoungdong, but relatively small amount of rainfall occurred in Chungnam, Chungbuk and Gyeonggi province, which were located on the west side of Typhoon. The center of cumulated precipitation was at the Ssanggye area and 5
Jungsanri area of Sumjin River Basin with 261 mm and 252.5 mm of rainfall, respec-tively. Afterwards, the typhoon was heading towards the northeast, thus the south coast was free from typhoon after midnight on 31 August. However, heavy rainfall of typhoon and storm due to the northeast air created more than 50 mm of rainfall per an hour for 5 h in the Yeoungdong area. At that moment, the maximum precipitation of 10
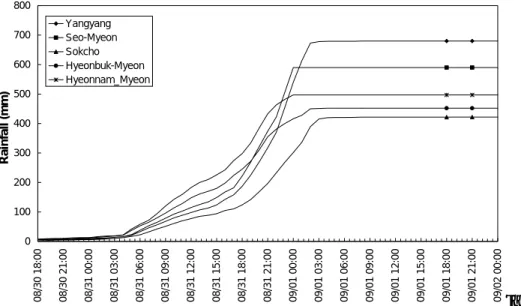
5 h duration was 365.5 mm; 6 h duration was 397.5 mm in Gangneung and 368 mm in Seo-Myeon in Yangyang County. From midnight to 6 a.m. on 1 September, the power of typhoon was getting weaker and passed away to the northeast through Gangneung-Donghae. Meanwhile, the center of rainfall moved slightly to the north and recorded up to 139 mm in Yangyang and 119 mm in Sokcho. Figure 3 and Table 1 show the char-15
acteristics of the storm along the path of the typhoon, and Fig. 4 and Table 2 present spatial distributions and maximum value of rainfall according to the rainfall durations. In case of 6 h duration, maximum rainfall was 403 mm in Yangyang from 8 p.m. on 31 August to 2 a.m.on 1 September. It was Gangneung that had maximum rainfall for 12 h to 48 h. The period and maximum rainfall by duration was 576 mm for 12 h duration 20
from 12 a.m. to 12 p.m. on 31 August. 880 mm for the 24 h duration from 1 a.m. on 31 August to 1 a.m. on September. And as for the 48 h duration from 5 a.m. on 30 August to 5 a.m. on September, 897.5 mm was recorded as maximum rainfall.
3.2 Time distributions of rainfall
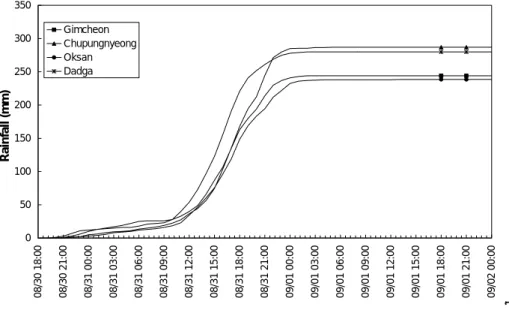
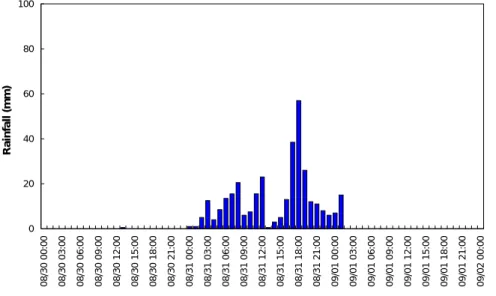
Figure 5 through Fig. 8 show the time distribution of rainfall based on the area of heavy 25
rainfall by the 15th typhoon RUSA. The figures present a representative time distribu-tion and cumulative rainfall of the observadistribu-tion stadistribu-tions; Gimcheon (Fig. 5), Samcheok and Donghae in the south of Gangneung (Fig. 6), Gangneung (Fig. 7), Yangyang and
HESSD
3, 3147–3182, 2006 Typhoon RUSA N. W. Kim et al. Title Page Abstract Introduction Conclusions References Tables Figures J I J I Back CloseFull Screen / Esc
Printer-friendly Version
Interactive Discussion
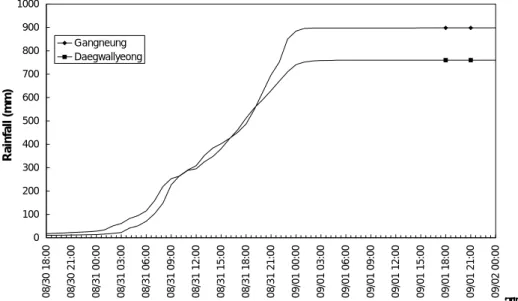
EGU Sokcho in the north of Gangneung (Fig. 8).
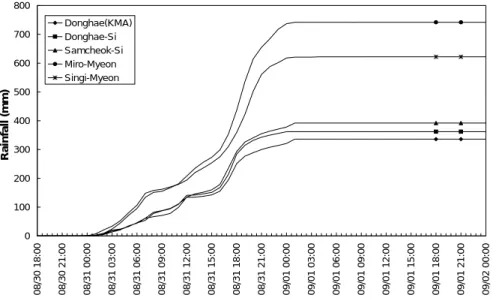
In case of Gangneung (Fig. 7), the results are similar to the time distribution of rainfall between Gangneung and Daegwallyeong before 6 p.m. on 31 August, but there is a large difference after that period. This happens exactly at the neighboring observation stations such as Miro-Myeon and Donghae (Fig. 6), and Yangyang County and Sokcho 5
(Fig. 8). This means that there are large rainfall deviations even in the Yeoungdong area, which had much rainfall from RUSA.
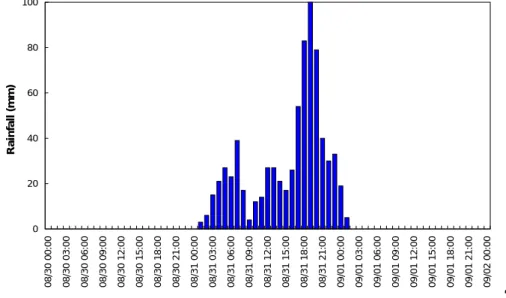
In terms of the temporal distribution of rainfall, the peak values at Chupungnyeong and Gimcheon station are lower than those of the other stations, and the time to peak and the duration of rainfall are much shorter than those at Miro-Myeon and Donghae. 10
The time to peak and the duration of rainfall at Miro-Myeon and Donghae are shorter than those at Gangneung and Daegwallyeong. The time to peak and the duration of rainfall are longest at Yangyang and Sokcho. This order is in accordance with the route of maximum rainfall of each duration and the path of the typhoon.
4 The Magnitude and scale of typhoon RUSA
15
4.1 Maximum rainfall by locality
Among the 8 observation stations of Fig. 5, one station that has the largest rainfall is chosen. Probable rainfall and observed rainfall by duration is presented for this station in Table 3. Except for the peak of Chupungnyeong, which shows a 5-year return period for 1 h duration, more than 200 year return periods have been observed at four stations. 20
In other words, it is hard to evaluate the scale of heavy rainfall for each station by probable rainfall.
HESSD
3, 3147–3182, 2006 Typhoon RUSA N. W. Kim et al. Title Page Abstract Introduction Conclusions References Tables Figures J I J I Back CloseFull Screen / Esc
Printer-friendly Version
Interactive Discussion
EGU 4.2 DAD analysis
The rainfall data from 850 stations have been collected; 508 stations of KMA1 and AWS, 294 stations of MOCT2and KOWACO3and 18 stations of MOGAHA4. A station was excluded if there were missing data or if the deviations from other observation sta-tions were too large. A station would also be excluded if it had a different distribution of 5
cumulative rainfall compared to neighboring observation stations. Such examples can be seen in Fig. 5 to Fig. 8. In the final analysis, 73 data from KMA, 239 from AWS, 266 from MOCT and KOWACO and 13 from MOGAHA were used. Due to the severe damage caused by RUSA, there were few or no T/M rainfall measurement stations for MOCT and KOWACO in Gangneung. The data from KMA were missing except for the 10
Gangneung and Daegwallyeong stations, after 7 p.m. of 31 August when there was severe rainfall. To compensate for the missing data, the data of MOGAHA from 18 additional stations in Donghae/Samcheok and Yangyang County were collected, and data from 13 out of the 18 stations were used. However, due to the missing data of Gangneung and Ganseong County, it was not possible to use the data directly, thus 15
it was not possible to find out how much of rain had concentrated on a certain size of land. The total number of data for established DAD analysis procedure(World Meteoro-logical Organization, 1969) were 591, excluding 229 due to missing data and outliers. The analysis was based on the DAD analysis program, considering rainfall movement, which was already developed (MOCT 2000a). The duration period and area of anal-20
ysis was divided into ten categories of 1, 2, 4, 6, 8, 12, 18, 24, 48, 72 h and 25, 50, 100, 200, 500, 1000, 2000, 5000, 10 000, 20 000 km2. Additionally, the representative area of point rainfall was limited to 1 km2, because the rainfall by RUSA tended to con-centrate in a small area. The result of the DAD analysis shown in Fig. 9 and Fig. 10
1
Korea Meteorological Administration
2
The Ministry of Construction and Technology
3
Korea Water Resources Corporation
HESSD
3, 3147–3182, 2006 Typhoon RUSA N. W. Kim et al. Title Page Abstract Introduction Conclusions References Tables Figures J I J I Back CloseFull Screen / Esc
Printer-friendly Version
Interactive Discussion
EGU represents comparisons with PMP value of the Gangneung area with previous studies
(MOCT, 2000b).
With the limitation of 1 km2 for the representative area of point rainfall, the result of the DAD analysis (solid line) of the heavy rainstorm by RUSA was smaller than the PMP (dotted line) from the PMP diagram, and it was close to the PMP for 24 h duration, 5
but not more than that value (Table 4).
4.3 Evaluation of the magnitude and scale of the Typhoon RUSA
To evaluate the magnitude and scale of rainfall of typhoon RUSA, comparisons were made with the DAD analysis result of 132 other heavy rainstorms which occurred during 1969 to 1999 with daily precipitation levels that exceeded 150 mm. Table 5 shows 10
the order of magnitude of the storm of RUSA with duration and area from the DAD analysis results of the 132 heavy rainstorms. As shown in the table, the rainstorm by RUSA ranked first to fourth for an area of 2000 km2 and ranked at the top for an area of 1000 km2for 24 h duration. Thus the heavy rainfall of this typhoon was concentrated on a relatively small area.
15
According to the DAD analysis results shown in the Table 5, little movement and geographical concentration of rain caused a large amount of precipitation in terms of its size and scale. It may be possible that the application of maximum rainfall might affect the design guideline of dam and nuclear- power stations in Korea. Therefore, it is necessary to reevaluate the PMP of this rainfall using established procedure (World 20
Meteorological Organization, 1986). A 1000 mb maximum dew station has to be se-lected out of the dew stations of Daegwallyeong on August 30 to estimate the PMP of this rainfall in the Gangneung area. Likewise, the average altitude of Gangneung and Donghae has been used as representing 1000 mb average altitude to consider average altitude of the heavy rainfall area. The moisture maximization ratio of heavy rainfall is 25
approximately 1.29 for this typhoon (Table 6).
Based on the multiplication of the DAD results of heavy rainfall of RUSA (Table 4) with the moisture maximization ratio (Table 6), PMP has been estimated and compared
HESSD
3, 3147–3182, 2006 Typhoon RUSA N. W. Kim et al. Title Page Abstract Introduction Conclusions References Tables Figures J I J I Back CloseFull Screen / Esc
Printer-friendly Version
Interactive Discussion
EGU with the existing PMP, which is extracted from the PMP diagram in Table 7. In case of
a 6 h duration, the PMP from the PMP diagram was larger than the estimated PMP of this heavy rainfall, but the estimated PMP was higher if we extended duration up to 12∼48 h within a smaller area. In particular, for 24 h duration, the estimated PMP exceeds the existing PMP within 2000 km2, and exceeds the existing PMP for 12 and 5
24 h durations within 200 km2. As noted earlier, the heavy rainfall of this typhoon shows large size and scale for the 24 h duration, and exceeded PMP within a smaller area for approximately 12 to 48 h durations.
5 Conclusions
In Yeongdong, Gangwon province, an extreme storm was recorded by moisture supply 10
from typhoon RUSA on 31 August and additional geographical reasons. Rainfall data have been analyzed to understand the characteristics, and magnitude and scale of the heavy rainstorm of the typhoon from 30 August to 1 September. The results are as follows;
1. Low and high humid east wind continuously supplied much moisture into Yeong-15
dong, Gangwon province, and frontal precipitation was created by cold air in this area joining the warm air of typhoon RUSA. Additionally, the northeastern air containing much moisture was lifted by Taebaek Mountain and brought a large amount of precipitation in Yeongdong, Gangwon province.
2. In Yeongdong, Gangwon province, local precipitation of the event exceeded a 20
return period of 200-years. This rainfall does not exceed existing PMP values (MOCT, 2000b), but the magnitude and scale of rainfall was ranked first through fourth for smaller areas. Most importantly, it is the highest observed rainfall for areas smaller than 1000 km2during a 24 h duration.
3. The PMP moisture maximization ratio of rainfall is approximately 1.29 for this 25
HESSD
3, 3147–3182, 2006 Typhoon RUSA N. W. Kim et al. Title Page Abstract Introduction Conclusions References Tables Figures J I J I Back CloseFull Screen / Esc
Printer-friendly Version
Interactive Discussion
EGU Additionally, these values exceed the PMP diagram for 12 and 24 h durations
within 200 km2. These results indicate that the PMP can increase within small area, if storm movement is considered.
Acknowledgement. This research was supported by a grant (code 2-2-2) from Sustainable
Water Resources Research Center of 21st Century Frontier Research Program.
5
References
World Meteorological Organization: Manual for Depth-Area-Duration Analysis of Storm Precip-itation, WMO No. 237, Technical Paper 129, 130p., Geneva, Switzerland, 1969.
World Meteorological Organization: Manual for Estimation of Probable Maximum Precipita-tion, Second EdiPrecipita-tion, Operational Hydrology Report No. 1(WMO No. 332),190p., Geneva,
10
Switzerland, 1986.
Ministry of Construction & Transportation, Main Storms in Korea, Report of Water Resources Management Techniques Research in 1999, Vol. 2, separate Vol. 1, KICT, 289p., 2000a. Ministry of Construction & Transportation: Estimation of Probable Maximum Precipitation in
Korea, Report of Water Resources Management Techniques Research in 1999, Vol. 2, KICT,
15
440p., 2000b.
Ministry of Construction & Transportation: Creation of Probability Rainfall Map in Korea, Report of Water Resources Management Techniques Research in 1999, Vol. 1, KICT, 330p., 2000c.
HESSD
3, 3147–3182, 2006 Typhoon RUSA N. W. Kim et al. Title Page Abstract Introduction Conclusions References Tables Figures J I J I Back CloseFull Screen / Esc
Printer-friendly Version
Interactive Discussion
EGU
Table 1. The center of rainfall of 6 h duration.
Strom Duration 1stStation Rainfall (mm) 2ndStation Rainfall (mm) 06:00 a.m. 30 Aug. – Jeju 41.0 Daeheuksan Island 23.5
12:00 p.m. 30 Aug.
00:00 a.m. 31 Aug. – Singi-Myeon 107.0 Miro-Myeon 95.0 06:00 a.m. 31 Aug.
06:00 a.m. 31 Aug. – Gangneung 237.5 Daegwallyeong 180.0 12:00 p.m. 31 Aug.
12:00 a.m. 31 Aug. – Ssanggye 261.0 Jungsanri 252.5 06:00 a.m. 31 Aug.
06:00 p.m. 31 Aug. – Gangneung 397.5 Seo-Myeon 368.0 12:00 p.m. 31 Aug.
00:00 a.m. 1 Sep. – Yangyang 139.0 Sokcho 119.0 06:00 a.m. 1 Sep.
HESSD
3, 3147–3182, 2006 Typhoon RUSA N. W. Kim et al. Title Page Abstract Introduction Conclusions References Tables Figures J I J I Back CloseFull Screen / Esc
Printer-friendly Version
Interactive Discussion
EGU
Table 2. The center of maximum rainfall according to the duration.
Strom Duration 1stStation Rainfall 2nd (mm) Station Rainfall (mm) 6-hr Duration 8 p.m. 31 Aug. – Yangyang 403.0 Gangneung 274.5 12-hr Duration 12 a.m 31 Aug. – Gangneung 576.0 Miro-Myeon 529.0 24-hr Duration 1 a.m. 31 Aug. – Gangneung 880.0 Daegwallyeong 739.0 48-hr Duration 5 a.m 30 Aug. – Gangneung 897.5 Daegwallyeong 758.8
HESSD
3, 3147–3182, 2006 Typhoon RUSA N. W. Kim et al. Title Page Abstract Introduction Conclusions References Tables Figures J I J I Back CloseFull Screen / Esc
Printer-friendly Version
Interactive Discussion
EGU
Table 3. Comparison of rainfall frequencies by locality.
Station Division Duration (hr)1 6 12 24 48
Chupungnyeong Frequency <5- yr >200- yr >200- yr >200- yr >200- yr Rainfall
(mm)
32.5 170.0 252.5 280.0 287.0
Miro-Myeon FrequencyRainfall >200- yr >200- yr >200- yr >200- yr >200- yr (mm)
100.0 386.0 537.0 739.0 742.0
Gangneung FrequencyRainfall >200-yr >200-yr > 200−yr >200-yr >200- yr (mm)
98.0 399.5 576.0 880.0 897.5
Yangyang FrequencyRainfall > 200-yr > 200-yr > 200-yr > 200-yr > 200- yr (mm)
HESSD
3, 3147–3182, 2006 Typhoon RUSA N. W. Kim et al. Title Page Abstract Introduction Conclusions References Tables Figures J I J I Back CloseFull Screen / Esc
Printer-friendly Version
Interactive Discussion
EGU
Table 4. Comparison between rainfall from the DAD analysis and PMP.
Area (km2) Division Duration (hr)6 12 24 48
25 RUSA-DAD ∗ 342 505 771 790 PMP 490 646 840 990 100 RUSA-DAD ∗ 315 470 718 738 PMP 445 585 765 925 200 RUSA-DAD ∗ 302 446 676 697 PMP 425 560 725 900 1000 RUSA-DAD ∗ 255 377 570 588 PMP 385 510 645 845 2000 RUSA-DAD ∗ 220 340 504 520 PMP 360 485 610 810
HESSD
3, 3147–3182, 2006 Typhoon RUSA N. W. Kim et al. Title Page Abstract Introduction Conclusions References Tables Figures J I J I Back CloseFull Screen / Esc
Printer-friendly Version
Interactive Discussion
EGU
Table 5. The order of magnitude of heavy rainfall by RUSA.
Area (km2) Duration (hr)6 12 24 48 25 2 2 1 2 100 2 2 1 2 200 2 2 1 2 1000 2 3 1 4 2000 2 3 2 4
HESSD
3, 3147–3182, 2006 Typhoon RUSA N. W. Kim et al. Title Page Abstract Introduction Conclusions References Tables Figures J I J I Back CloseFull Screen / Esc
Printer-friendly Version
Interactive Discussion
EGU
Table 6. Moisture maximization ratio of heavy rainfall for RUSA.
Mean Representative Representative Representative Maximum Maximum Maximum Ratio of
Elevation Dew Point at Precipitable Precipitable Dew Point at Precipitable Precipitable Moisture
1000 hPa (◦C) Water at MSL Water at Mean Elevation 1000 hPa Water at MSL Water at Maximization
(mm) (mm) (◦C) (mm) Mean Elevation (mm)
HESSD
3, 3147–3182, 2006 Typhoon RUSA N. W. Kim et al. Title Page Abstract Introduction Conclusions References Tables Figures J I J I Back CloseFull Screen / Esc
Printer-friendly Version
Interactive Discussion
EGU
Table 7. Comparison between estimated PMP of heavy rainfall of RUSA and existing PMP in
Gangneung (Unit: mm).
Area (km2) Division Duration (hr)6 12 24 48
25 RUSA-PMP ∗ 441 651 995 1019 PMP 490 645 840 990 100 RUSA-PMP ∗ 406 606 926 952 PMP 445 585 765 925 200 RUSA-PMP ∗ 390 575 872 899 PMP 425 560 725 900 1000 RUSA-PMP ∗ 329 486 735 759 PMP 385 510 645 845 2000 RUSA-PMP ∗ 284 439 650 671 PMP 360 485 610 810
HESSD
3, 3147–3182, 2006 Typhoon RUSA N. W. Kim et al. Title Page Abstract Introduction Conclusions References Tables Figures J I J I Back CloseFull Screen / Esc
Printer-friendly Version
Interactive Discussion
EGU
(a) 6 PM August 30 (b) 5 AM August 31
(c) 12 AM August 31 (d) 6 PM August 31
(e) 1 AM September 1 (f) 6 AM September 1 Figure 1. A GMS satellite image and moisture vector (data: KMA1)
1 Korea Meteorological Administration
4
Fig. 1. A GMS satellite image and moisture vector (data: Korea Meteorological Administration) (a) 6 p.m. 30 August (b) 5 a.m. 31 August (c) 12 a.m. 31 August (d) 6 p.m. 31 August (e) 1 a.m.
HESSD
3, 3147–3182, 2006 Typhoon RUSA N. W. Kim et al. Title Page Abstract Introduction Conclusions References Tables Figures J I J I Back CloseFull Screen / Esc
Printer-friendly Version
Interactive Discussion
EGU Figure 2. Path of typhoon in South Korea
Fig. 2. Path of typhoon in South Korea.
HESSD
3, 3147–3182, 2006 Typhoon RUSA N. W. Kim et al. Title Page Abstract Introduction Conclusions References Tables Figures J I J I Back CloseFull Screen / Esc
Printer-friendly Version
Interactive Discussion
EGU
Fig. 3. The spatial distribution of rainfall of 6 h duration. (Iso. Interval: 20 mm) (a) 0 a.m. 31
August–(b) 3 a.m. 31 August –(c) 6 a.m. 31 August–(d) 9 a.m 31 August–(e) 12 a.m 31 August– (f) 3 p.m. 31 August–(g) 6 p.m. 31 August–(h) 9 p.m. 31 August–(i) 12 p.m. 1 September–.
HESSD
3, 3147–3182, 2006 Typhoon RUSA N. W. Kim et al. Title Page Abstract Introduction Conclusions References Tables Figures J I J I Back CloseFull Screen / Esc
Printer-friendly Version
Interactive Discussion
EGU
Fig. 4. The spatial distribution of maximum rainfall by duration (Iso. Interval: 30 mm). (a) 6-hr (b) 12-hr (c) 24-hr (d) 48-hr.
HESSD
3, 3147–3182, 2006 Typhoon RUSA N. W. Kim et al. Title Page Abstract Introduction Conclusions References Tables Figures J I J I Back CloseFull Screen / Esc
Printer-friendly Version Interactive Discussion EGU 0 20 40 60 80 100 08 /3 0 0 0 :00 08 /3 0 0 3 :00 08 /3 0 0 6 :00 08 /3 0 0 9 :00 08 /3 0 1 2 :00 08 /3 0 1 5 :00 08 /3 0 1 8 :00 08 /3 0 2 1 :00 08 /3 1 0 0 :00 08 /3 1 0 3 :00 08 /3 1 0 6 :00 08 /3 1 0 9 :00 08 /3 1 1 2 :00 08 /3 1 1 5 :00 08 /3 1 1 8 :00 08 /3 1 2 1 :00 09 /0 1 0 0 :00 09 /0 1 0 3 :00 09 /0 1 0 6 :00 09 /0 1 0 9 :00 09 /0 1 1 2 :00 09 /0 1 1 5 :00 09 /0 1 1 8 :00 09 /0 1 2 1 :00 09 /0 2 0 0 :00 R a in fa ll (mm) a (a) Chupungnyeong 0 20 40 60 80 100 08 /3 0 0 0 :00 08 /3 0 0 3 :00 08 /3 0 0 6 :00 08 /3 0 0 9 :00 08 /3 0 1 2 :00 08 /3 0 1 5 :00 08 /3 0 1 8 :00 08 /3 0 2 1 :00 08 /3 1 0 0 :00 08 /3 1 0 3 :00 08 /3 1 0 6 :00 08 /3 1 0 9 :00 08 /3 1 1 2 :00 08 /3 1 1 5 :00 08 /3 1 1 8 :00 08 /3 1 2 1 :00 09 /0 1 0 0 :00 09 /0 1 0 3 :00 09 /0 1 0 6 :00 09 /0 1 0 9 :00 09 /0 1 1 2 :00 09 /0 1 1 5 :00 09 /0 1 1 8 :00 09 /0 1 2 1 :00 09 /0 2 0 0 :00 R a inf a ll (mm) a (b) Gimcheon (a) Fig. 5. Time distribution of rainfall in Gimcheon area (a) Chupungnyeong.
HESSD
3, 3147–3182, 2006 Typhoon RUSA N. W. Kim et al. Title Page Abstract Introduction Conclusions References Tables Figures J I J I Back CloseFull Screen / Esc
Printer-friendly Version Interactive Discussion EGU 0 20 40 60 80 100 08 /3 0 0 0 :00 08 /3 0 0 3 :00 08 /3 0 0 6 :00 08 /3 0 0 9 :00 08 /3 0 1 2 :00 08 /3 0 1 5 :00 08 /3 0 1 8 :00 08 /3 0 2 1 :00 08 /3 1 0 0 :00 08 /3 1 0 3 :00 08 /3 1 0 6 :00 08 /3 1 0 9 :00 08 /3 1 1 2 :00 08 /3 1 1 5 :00 08 /3 1 1 8 :00 08 /3 1 2 1 :00 09 /0 1 0 0 :00 09 /0 1 0 3 :00 09 /0 1 0 6 :00 09 /0 1 0 9 :00 09 /0 1 1 2 :00 09 /0 1 1 5 :00 09 /0 1 1 8 :00 09 /0 1 2 1 :00 09 /0 2 0 0 :00 R a in fa ll (mm) a (a) Chupungnyeong 0 20 40 60 80 100 08 /3 0 0 0 :00 08 /3 0 0 3 :00 08 /3 0 0 6 :00 08 /3 0 0 9 :00 08 /3 0 1 2 :00 08 /3 0 1 5 :00 08 /3 0 1 8 :00 08 /3 0 2 1 :00 08 /3 1 0 0 :00 08 /3 1 0 3 :00 08 /3 1 0 6 :00 08 /3 1 0 9 :00 08 /3 1 1 2 :00 08 /3 1 1 5 :00 08 /3 1 1 8 :00 08 /3 1 2 1 :00 09 /0 1 0 0 :00 09 /0 1 0 3 :00 09 /0 1 0 6 :00 09 /0 1 0 9 :00 09 /0 1 1 2 :00 09 /0 1 1 5 :00 09 /0 1 1 8 :00 09 /0 1 2 1 :00 09 /0 2 0 0 :00 R a inf a ll (mm) a (b) Gimcheon 10 (b) Fig. 5. Time distribution of rainfall in Gimcheon area (b) Gimcheon.
HESSD
3, 3147–3182, 2006 Typhoon RUSA N. W. Kim et al. Title Page Abstract Introduction Conclusions References Tables Figures J I J I Back CloseFull Screen / Esc
Printer-friendly Version Interactive Discussion EGU 0 50 100 150 200 250 300 350 08/ 30 18:00 08/ 30 21:00 08/ 31 00:00 08/ 31 03:00 08/ 31 06:00 08/ 31 09:00 08/ 31 12:00 08/ 31 15:00 08/ 31 18:00 08/ 31 21:00 09/ 01 00:00 09/ 01 03:00 09/ 01 06:00 09/ 01 09:00 09/ 01 12:00 09/ 01 15:00 09/ 01 18:00 09/ 01 21:00 09/ 02 00:00 R a inf a ll ( m m) a Gimcheon Chupungnyeong Oksan Dadga (c) Cumulative rainfall
Figure 5. Time distribution of rainfall in Gimcheon area
0 20 40 60 80 100 08 /3 0 0 0 :00 08 /3 0 0 3 :00 08 /3 0 0 6 :00 08 /3 0 0 9 :00 08 /3 0 1 2 :00 08 /3 0 1 5 :00 08 /3 0 1 8 :00 08 /3 0 2 1 :00 08 /3 1 0 0 :00 08 /3 1 0 3 :00 08 /3 1 0 6 :00 08 /3 1 0 9 :00 08 /3 1 1 2 :00 08 /3 1 1 5 :00 08 /3 1 1 8 :00 08 /3 1 2 1 :00 09 /0 1 0 0 :00 09 /0 1 0 3 :00 09 /0 1 0 6 :00 09 /0 1 0 9 :00 09 /0 1 1 2 :00 09 /0 1 1 5 :00 09 /0 1 1 8 :00 09 /0 1 2 1 :00 09 /0 2 0 0 :00 R a inf a ll (mm) a (a) Miro-Myeon (c) Fig. 5. Time distribution of rainfall in Gimcheon area (c) Cumulative rainfall.
HESSD
3, 3147–3182, 2006 Typhoon RUSA N. W. Kim et al. Title Page Abstract Introduction Conclusions References Tables Figures J I J I Back CloseFull Screen / Esc
Printer-friendly Version Interactive Discussion EGU 11 0 50 100 150 200 250 300 350 08/ 30 18:00 08/ 30 21:00 08/ 31 00:00 08/ 31 03:00 08/ 31 06:00 08/ 31 09:00 08/ 31 12:00 08/ 31 15:00 08/ 31 18:00 08/ 31 21:00 09/ 01 00:00 09/ 01 03:00 09/ 01 06:00 09/ 01 09:00 09/ 01 12:00 09/ 01 15:00 09/ 01 18:00 09/ 01 21:00 09/ 02 00:00 R a inf a ll ( m m) a Gimcheon Chupungnyeong Oksan Dadga (c) Cumulative rainfall
Figure 5. Time distribution of rainfall in Gimcheon area
0 20 40 60 80 100 08 /3 0 0 0 :00 08 /3 0 0 3 :00 08 /3 0 0 6 :00 08 /3 0 0 9 :00 08 /3 0 1 2 :00 08 /3 0 1 5 :00 08 /3 0 1 8 :00 08 /3 0 2 1 :00 08 /3 1 0 0 :00 08 /3 1 0 3 :00 08 /3 1 0 6 :00 08 /3 1 0 9 :00 08 /3 1 1 2 :00 08 /3 1 1 5 :00 08 /3 1 1 8 :00 08 /3 1 2 1 :00 09 /0 1 0 0 :00 09 /0 1 0 3 :00 09 /0 1 0 6 :00 09 /0 1 0 9 :00 09 /0 1 1 2 :00 09 /0 1 1 5 :00 09 /0 1 1 8 :00 09 /0 1 2 1 :00 09 /0 2 0 0 :00 R a inf a ll (mm) a (a) Miro-Myeon (a) Fig. 6. Time distribution of rainfall in the Donghae/Samcheok area (a) Miro-Myeon.
HESSD
3, 3147–3182, 2006 Typhoon RUSA N. W. Kim et al. Title Page Abstract Introduction Conclusions References Tables Figures J I J I Back CloseFull Screen / Esc
Printer-friendly Version Interactive Discussion EGU 0 20 40 60 80 100 08 /3 0 0 0 :00 08 /3 0 0 3 :00 08 /3 0 0 6 :00 08 /3 0 0 9 :00 08 /3 0 1 2 :00 08 /3 0 1 5 :00 08 /3 0 1 8 :00 08 /3 0 2 1 :00 08 /3 1 0 0 :00 08 /3 1 0 3 :00 08 /3 1 0 6 :00 08 /3 1 0 9 :00 08 /3 1 1 2 :00 08 /3 1 1 5 :00 08 /3 1 1 8 :00 08 /3 1 2 1 :00 09 /0 1 0 0 :00 09 /0 1 0 3 :00 09 /0 1 0 6 :00 09 /0 1 0 9 :00 09 /0 1 1 2 :00 09 /0 1 1 5 :00 09 /0 1 1 8 :00 09 /0 1 2 1 :00 09 /0 2 0 0 :00 R a inf a ll (mm) a (b) Donghae 0 100 200 300 400 500 600 700 800 08/30 18:00 08/30 21:00 08/31 00:00 08/31 03:00 08/31 06:00 08/31 09:00 08/31 12:00 08/31 15:00 08/31 18:00 Rainfall (mm) a 08/31 21:00 09/01 00:00 09/01 03:00 09/01 06:00 09/01 09:00 09/01 12:00 09/01 15:00 09/01 18:00 09/01 21:00 09/02 00:00 Donghae(KMA) Donghae-Si Samcheok-Si Miro-Myeon Singi-Myeon (c) Cumulative rainfall
Figure 6. Time distribution of rainfall in the Donghae/Samcheok area
(b) Fig. 6. Time distribution of rainfall in the Donghae/Samcheok area (b) Donghae.
HESSD
3, 3147–3182, 2006 Typhoon RUSA N. W. Kim et al. Title Page Abstract Introduction Conclusions References Tables Figures J I J I Back CloseFull Screen / Esc
Printer-friendly Version Interactive Discussion EGU 0 20 40 60 80 100 08 /3 0 0 0 :00 08 /3 0 0 3 :00 08 /3 0 0 6 :00 08 /3 0 0 9 :00 08 /3 0 1 2 :00 08 /3 0 1 5 :00 08 /3 0 1 8 :00 08 /3 0 2 1 :00 08 /3 1 0 0 :00 08 /3 1 0 3 :00 08 /3 1 0 6 :00 08 /3 1 0 9 :00 08 /3 1 1 2 :00 08 /3 1 1 5 :00 08 /3 1 1 8 :00 08 /3 1 2 1 :00 09 /0 1 0 0 :00 09 /0 1 0 3 :00 09 /0 1 0 6 :00 09 /0 1 0 9 :00 09 /0 1 1 2 :00 09 /0 1 1 5 :00 09 /0 1 1 8 :00 09 /0 1 2 1 :00 09 /0 2 0 0 :00 R a inf a ll (mm) a (b) Donghae 0 100 200 300 400 500 600 700 800 08/30 18:00 08/30 21:00 08/31 00:00 08/31 03:00 08/31 06:00 08/31 09:00 08/31 12:00 08/31 15:00 08/31 18:00 Rainfall (mm) a 08/31 21:00 09/01 00:00 09/01 03:00 09/01 06:00 09/01 09:00 09/01 12:00 09/01 15:00 09/01 18:00 09/01 21:00 09/02 00:00 Donghae(KMA) Donghae-Si Samcheok-Si Miro-Myeon Singi-Myeon (c) Cumulative rainfall
Figure 6. Time distribution of rainfall in the Donghae/Samcheok area
12
(c) Fig. 6. Time distribution of rainfall in the Donghae/Samcheok area (c) Cumulative rainfall.
HESSD
3, 3147–3182, 2006 Typhoon RUSA N. W. Kim et al. Title Page Abstract Introduction Conclusions References Tables Figures J I J I Back CloseFull Screen / Esc
Printer-friendly Version Interactive Discussion EGU 0 20 40 60 80 100 08 /3 0 0 0 :00 08 /3 0 0 3 :00 08 /3 0 0 6 :00 08 /3 0 0 9 :00 08 /3 0 1 2 :00 08 /3 0 1 5 :00 08 /3 0 1 8 :00 08 /3 0 2 1 :00 08 /3 1 0 0 :00 08 /3 1 0 3 :00 08 /3 1 0 6 :00 08 /3 1 0 9 :00 08 /3 1 1 2 :00 08 /3 1 1 5 :00 08 /3 1 1 8 :00 08 /3 1 2 1 :00 09 /0 1 0 0 :00 09 /0 1 0 3 :00 09 /0 1 0 6 :00 09 /0 1 0 9 :00 09 /0 1 1 2 :00 09 /0 1 1 5 :00 09 /0 1 1 8 :00 09 /0 1 2 1 :00 09 /0 2 0 0 :00 R a inf a ll (mm) a (a) Gangneung 0 20 40 60 80 100 08 /3 0 0 0 :00 08 /3 0 0 3 :00 08 /3 0 0 6 :00 08 /3 0 0 9 :00 08 /3 0 1 2 :00 08 /3 0 1 5 :00 08 /3 0 1 8 :00 08 /3 0 2 1 :00 08 /3 1 0 0 :00 08 /3 1 0 3 :00 08 /3 1 0 6 :00 08 /3 1 0 9 :00 08 /3 1 1 2 :00 08 /3 1 1 5 :00 08 /3 1 1 8 :00 08 /3 1 2 1 :00 09 /0 1 0 0 :00 09 /0 1 0 3 :00 09 /0 1 0 6 :00 09 /0 1 0 9 :00 09 /0 1 1 2 :00 09 /0 1 1 5 :00 09 /0 1 1 8 :00 09 /0 1 2 1 :00 09 /0 2 0 0 :00 R a inf a ll (mm) a (b) Daegwallyeong (a) Fig. 7. Time distribution of rainfall in the Gangneung area (a) Gangneung.
HESSD
3, 3147–3182, 2006 Typhoon RUSA N. W. Kim et al. Title Page Abstract Introduction Conclusions References Tables Figures J I J I Back CloseFull Screen / Esc
Printer-friendly Version
Interactive Discussion
EGU Fig. 7. Time distribution of rainfall in the Gangneung area (b) Daegwallyeong.
(b) Fig. 7. Time distribution of rainfall in the Gangneung area (b) Daegwallyeong.
HESSD
3, 3147–3182, 2006 Typhoon RUSA N. W. Kim et al. Title Page Abstract Introduction Conclusions References Tables Figures J I J I Back CloseFull Screen / Esc
Printer-friendly Version Interactive Discussion EGU 0 100 200 300 400 500 600 700 800 900 1000 08 /30 18 :00 08 /30 21 :00 08 /31 00 :00 08 /31 03 :00 08 /31 06 :00 08 /31 09 :00 08 /31 12 :00 08 /31 15 :00 08 /31 18 :00 08 /31 21 :00 09 /01 00 :00 09 /01 03 :00 09 /01 06 :00 09 /01 09 :00 09 /01 12 :00 09 /01 15 :00 09 /01 18 :00 09 /01 21 :00 09 /02 00 :00 Ra infall (mm) a Gangneung Daegwallyeong (c) Cumulative rainfall
Figure 7. Time distribution of rainfall in the Gangneung area
(c) Fig. 7. Time distribution of rainfall in the Gangneung area (c) Cumulative rainfall.
HESSD
3, 3147–3182, 2006 Typhoon RUSA N. W. Kim et al. Title Page Abstract Introduction Conclusions References Tables Figures J I J I Back CloseFull Screen / Esc
Printer-friendly Version Interactive Discussion EGU 0 20 40 60 80 100 08 /3 0 0 0 :00 08 /3 0 0 3 :00 08 /3 0 0 6 :00 08 /3 0 0 9 :00 08 /3 0 1 2 :00 08 /3 0 1 5 :00 08 /3 0 1 8 :00 08 /3 0 2 1 :00 08 /3 1 0 0 :00 08 /3 1 0 3 :00 R a inf a ll (mm) a 08 /3 1 0 6 :00 08 /3 1 0 9 :00 08 /3 1 1 2 :00 08 /3 1 1 5 :00 08 /3 1 1 8 :00 08 /3 1 2 1 :00 09 /0 1 0 0 :00 09 /0 1 0 3 :00 09 /0 1 0 6 :00 09 /0 1 0 9 :00 09 /0 1 1 2 :00 09 /0 1 1 5 :00 09 /0 1 1 8 :00 09 /0 1 2 1 :00 09 /0 2 0 0 :00 (a) Yangyang 0 20 40 60 80 100 08 /3 0 0 0 :00 08 /3 0 0 3 :00 08 /3 0 0 6 :00 08 /3 0 0 9 :00 08 /3 0 1 2 :00 08 /3 0 1 5 :00 08 /3 0 1 8 :00 08 /3 0 2 1 :00 08 /3 1 0 0 :00 08 /3 1 0 3 :00 08 /3 1 0 6 :00 08 /3 1 0 9 :00 08 /3 1 1 2 :00 08 /3 1 1 5 :00 08 /3 1 1 8 :00 08 /3 1 2 1 :00 09 /0 1 0 0 :00 09 /0 1 0 3 :00 09 /0 1 0 6 :00 09 /0 1 0 9 :00 09 /0 1 1 2 :00 09 /0 1 1 5 :00 09 /0 1 1 8 :00 09 /0 1 2 1 :00 09 /0 2 0 0 :00 R a inf a ll (mm) a (b) Sokcho (a) Fig. 8. Time distribution of rainfall in the Yangyang/Sokcho area (a) Yangyang.
HESSD
3, 3147–3182, 2006 Typhoon RUSA N. W. Kim et al. Title Page Abstract Introduction Conclusions References Tables Figures J I J I Back CloseFull Screen / Esc
Printer-friendly Version Interactive Discussion EGU 0 20 40 60 80 100 08 /3 0 0 0 :00 08 /3 0 0 3 :00 08 /3 0 0 6 :00 08 /3 0 0 9 :00 08 /3 0 1 2 :00 08 /3 0 1 5 :00 08 /3 0 1 8 :00 08 /3 0 2 1 :00 08 /3 1 0 0 :00 08 /3 1 0 3 :00 R a inf a ll (mm) a 08 /3 1 0 6 :00 08 /3 1 0 9 :00 08 /3 1 1 2 :00 08 /3 1 1 5 :00 08 /3 1 1 8 :00 08 /3 1 2 1 :00 09 /0 1 0 0 :00 09 /0 1 0 3 :00 09 /0 1 0 6 :00 09 /0 1 0 9 :00 09 /0 1 1 2 :00 09 /0 1 1 5 :00 09 /0 1 1 8 :00 09 /0 1 2 1 :00 09 /0 2 0 0 :00 (a) Yangyang 0 20 40 60 80 100 08 /3 0 0 0 :00 08 /3 0 0 3 :00 08 /3 0 0 6 :00 08 /3 0 0 9 :00 08 /3 0 1 2 :00 08 /3 0 1 5 :00 08 /3 0 1 8 :00 08 /3 0 2 1 :00 08 /3 1 0 0 :00 08 /3 1 0 3 :00 08 /3 1 0 6 :00 08 /3 1 0 9 :00 08 /3 1 1 2 :00 08 /3 1 1 5 :00 08 /3 1 1 8 :00 08 /3 1 2 1 :00 09 /0 1 0 0 :00 09 /0 1 0 3 :00 09 /0 1 0 6 :00 09 /0 1 0 9 :00 09 /0 1 1 2 :00 09 /0 1 1 5 :00 09 /0 1 1 8 :00 09 /0 1 2 1 :00 09 /0 2 0 0 :00 R a inf a ll (mm) a (b) Sokcho 15 (b) Fig. 8. Time distribution of rainfall in the Yangyang/Sokcho area (b) Sokcho.
HESSD
3, 3147–3182, 2006 Typhoon RUSA N. W. Kim et al. Title Page Abstract Introduction Conclusions References Tables Figures J I J I Back CloseFull Screen / Esc
Printer-friendly Version Interactive Discussion EGU 0 100 200 300 400 500 600 700 800 08 /30 1 8 :00 08 /30 2 1 :00 08 /31 0 0 :00 08 /31 0 3 :00 08 /31 0 6 :00 08 /31 0 9 :00 08 /31 1 2 :00 08 /31 1 5 :00 08 /31 1 8 :00 08 /31 2 1 :00 09 /01 0 0 :00 09 /01 0 3 :00 09 /01 0 6 :00 09 /01 0 9 :00 09 /01 1 2 :00 09 /01 1 5 :00 09 /01 1 8 :00 09 /01 2 1 :00 09 /02 0 0 :00 Rai n fall (mm) a Yangyang Seo-Myeon Sokcho Hyeonbuk-Myeon Hyeonnam_Myeon (c) Cumulative rainfall
Figure 8. Time distribution of rainfall in the Yangyang/Sokcho area
4. Size and Scale of typhoon RUSA 4.1 Maximum Rainfall by Locality
Among the 8 observation stations of figure 5, one station that has the largest rainfall is chosen. Probable rainfall and observed rainfall by duration is presented for this station in table 3. Except for the peak of Chupungnyeong, which shows a 5-year return period for 1-hour duration, more than 200 year return periods have been observed at four stations. In other words, it is hard to evaluate the scale of heavy rainfall for each station by probable rainfall.
4.2 DAD Analysis
The rainfall data from 850 stations have been collected; 508 stations of KMA and AWS, 294 stations of MOCT2 and KOWACO3 and 18 stations of MOGAHA4. A station was excluded if there were missing data or if the deviations from other observation stations were too large. A station would also be excluded if it had a different distribution of cumulative rainfall compared to neighboring observation stations. Such examples can be seen in figures 5 to 8. In the final analysis 73 data from KMA, 239 from AWS, 266 from MOCT and KOWACO and 13 from MOGAHA were used. Due to the severe damage caused by RUSA, there were few or no T/M rainfall measurement stations for MOCT and KOWACO in Gangneung. The data
2 The Ministry of Construction and Technology 3 Korea Water Resource Corporation
4 Ministry of Government Administration and Home Affairs
(c) Fig. 8. Time distribution of rainfall in the Yangyang/Sokcho area (c) Cumulative rainfall.
HESSD
3, 3147–3182, 2006 Typhoon RUSA N. W. Kim et al. Title Page Abstract Introduction Conclusions References Tables Figures J I J I Back CloseFull Screen / Esc
Printer-friendly Version Interactive Discussion EGU 0 100 200 300 400 500 600 700 800 900 1000 1 10 100 1000 10000 100000 Area(km2) M e a n P e rc ip ita tio n (m m ) a 01 hr 02 hr 04 hr 06 hr 08 hr 12 hr 18 hr 24 hr 48 hr
Figure 9. DAD analysis result of the rainfall of RUSA
0 100 200 300 400 500 600 700 800 900 1000 1100 1 10 100 1000 10000 100000 Area(km2) Me an P re c ip it a ti o n (m m ) a 6 hr 12 hr 24 hr 48 hr
Figure 10. Comparison between PMP of Gangneung and rainfall from the DAD analysis
Table 4. Comparison between rainfall from the DAD analysis and PMP
Duration (hr) Area (km2) Division 6 12 24 48 RUSA-DAD* 342 505 771 790 25 PMP 490 646 840 990 RUSA-DAD* 315 470 718 738 100 PMP 445 585 765 925 RUSA-DAD* 302 446 676 697 200 PMP 425 560 725 900 RUSA-DAD* 255 377 570 588 1,000 PMP 385 510 645 845 RUSA-DAD* 220 340 504 520 2,000 PMP 360 485 610 810 * Indicates the result of DAD analysis of the RUSA storm
Fig. 9. DAD analysis result of the rainfall of RUSA.
HESSD
3, 3147–3182, 2006 Typhoon RUSA N. W. Kim et al. Title Page Abstract Introduction Conclusions References Tables Figures J I J I Back CloseFull Screen / Esc
Printer-friendly Version Interactive Discussion EGU 0 100 200 300 400 500 600 700 800 900 1000 1 10 100 1000 10000 100000 Area(km2) M e a n P e rc ip ita tio n (m m ) a 01 hr 02 hr 04 hr 06 hr 08 hr 12 hr 18 hr 24 hr 48 hr
Figure 9. DAD analysis result of the rainfall of RUSA
0 100 200 300 400 500 600 700 800 900 1000 1100 1 10 100 1000 10000 100000 Area(km2) Me an P re c ip it a ti o n (m m ) a 6 hr 12 hr 24 hr 48 hr
Figure 10. Comparison between PMP of Gangneung and rainfall from the DAD analysis
Table 4. Comparison between rainfall from the DAD analysis and PMP
Duration (hr) Area (km2) Division 6 12 24 48 RUSA-DAD* 342 505 771 790 25 PMP 490 646 840 990 RUSA-DAD* 315 470 718 738 100 PMP 445 585 765 925 RUSA-DAD* 302 446 676 697 200 PMP 425 560 725 900 RUSA-DAD* 255 377 570 588 1,000 PMP 385 510 645 845 RUSA-DAD* 220 340 504 520 2,000 PMP 360 485 610 810 * Indicates the result of DAD analysis of the RUSA storm
Fig. 10. Comparison between PMP of Gangneung and rainfall from the DAD analysis.