Application of Modelling Techniques to Test
Hypotheses Concerning the Migration of
Aviation Gasoline from A Surface Spill
by
Theresa Hutchings
B.A. in Engineering, Cambridge University, 1992
Submitted to the Department of Civil and Environmental Engineering in partial fulfillment of the requirements for the degree of
Master of Science in Civil and Environmental Engineering
at the
Massachusetts Institute of Technology
February 1995
@Massachusetts Institute of Technology 1995. All rights reserved.
A
uthor...
.
."
•...... ...
DeparA4 t of Ci-i and Environmental Engineering
December 23, 1994
Certified by.../. ...
...
David Marks
Professor, Department of Civil and Environmental Engineering
Thesis Supervisor
'In
Accepted by
...
...
...
Joseph M. Sussman
Chairman, Departmental Committee on Graduate Students
Application of Modelling Techniques to Test Hypotheses
Concerning the Migration of Aviation Gasoline from a
Surface Spill
by
Theresa Hutchings
B.A. in Engineering, Cambridge University, 1992
Submitted to the Department of Civil and Environmental Engineering on December 23, 1994, in partial fulfillment of the
requirements for the degree of
Master of Science in Civil and Environmental Engineering
Abstract
Models are widely accepted as useful tools in the understanding of the groundwater environment. This study uses a physically based computer model to investigate vari-ous hypotheses concerning the migration of aviation gasoline from a surface spill. The site considered is the FS-1 site at the Massachusetts Military Reservation, Cape Cod, Massachusetts. Between 1955 and 1970, aircraft maintainance at the FS-1 site caused between 400,000 and 1 million gallons of aviation gasoline to be released into the soil. Field investigation has detected a relatively small area that has been impacted by this source. Uncertainty exists over many of the factors which would govern the fate and transport of contaminant from such a spill. These were investigated using the model developed for the site. Biodegradation was found to be the predominant factor in influencing the extent of contamination emanating from this source area. It was concluded that the development of a model for this site was useful in two ways: it enabled examination of various assumptions, and the model predictions can be used to help direct future field investigations.
Thesis Supervisor: David Marks
Acknowledgments
As I finish up this thesis my mind drifts through the crowd of people I'd like to thank for their help in making it possible. This includes not only people who have been directly involved, but all of those who have helped me on my path towards MIT: teachers at school who had enough foresight to see that women could be engineers too, and all those who taught and encouraged me at Cambridge. Particular thanks are due to the British Kennedy Memorial Trust. The generous scholarship awarded to me not only enabled me to undertake this master's program at MIT, but has also given me the opportunity of exploring America.
Studying at MIT can be a tough experience, and it can be difficult to find a niche that suits you. I'd like to thank my advisor, Professor David Marks, for giving me the freedom to explore a project and find what was right for me. My first exposure to groundwater modelling came from Dr. Fernando Miralles-Wilhelm - his lectures were a real inspiration to me. I have also greatly appreciated all the help he has provided over the last year in the use of the DYN system. I would also like to thank Shawn Morrissey for his help and guidance in this project, and for his never ending enthusiasm. This thesis would not have been possible without the involvement of the IRP staff at the Massachusetts Military Reservation. Their continual willingness to help and provide information was greatly appreciated, and the opportunity to become involved in an on-going investigation was invaluable. I hope the MIT-MMR links continue to be productive.
My thanks go to all the people who have helped me cope with the stress of having a thesis deadline fast approaching - in particular I'd like to thank Rachel for sharing that wonderful late night Athena experience, Heidi for being on the other end of the phone at 4am, Rob for letting me take out my anguish on his hair, Ida for being the perfect deskmate (now I've gone you can get some work done!), and Cris for, well, just being there. Last, but definitely not least, I think of my parents. Without their love and support I wouldn't have even been at MIT to write this thesis. I thank them for always encouraging me in everything I have wanted to do, no matter how insane it seemed at the time.
Contents
1 Introduction 10
1.1 Site Background ... 11
1.2 FS-1 Study Area ... 13
1.2.1 Location and History ... .... 13
1.2.2 Previous Investigations ... ... 13
1.3 Purpose and Scope ... 17
2 Study Area Characterization 18 2.1 C lim ate . . . .. . 18
2.2 G eology . . . .. . 18
2.3 Regional Hydrogeology ... . . . . ... ... . . .. 19
2.4 Local Geology and Hydrogeology . ... . 24
2.5 Aquifer Characteristics ... 25
3 Contaminant Assessment 26 3.1 Contaminants of interest ... 26
3.2 Observed distributions ... 30
4 Migration of AVGAS from FS-1 32 4.1 Source Assessment ... 33
4.2 Migration from the Source ... 33
4.2.1 Contaminant Present on the Surface . ... 35
4.2.3 Migration in the Saturated Zone . ... 39
4.3 Sum m ary . . . 40
5 Numerical Models 43 5.1 Dynflow, Dyntrack and Dynplot ... 44
5.2 M odel Parameters ... 46 6 Model of FS-1 47 6.1 Conceptual M odel ... 47 6.1.1 Flow Field . . . 47 6.1.2 Contaminant Migration ... 48 6.2 Model Development ... 52 6.2.1 Discretization . . . 52 6.2.2 Flow Simulation ... 52
6.2.3 Contaminant Transport Simulation . ... 56
7 Assessment of Model Results 67 7.1 Toluene . . . .. .. . 67
7.2 B enzene . . . .. .. . 68
8 Conclusions 73 8.1 Plume Characterization ... 73
8.2 Usefulness of a Modelling Approach . ... . . . 75
8.3 Recommendations ... ... .. 76
A Observed Distributions 78 B Estimation Methods 85 B.1 Vapour Pressure ... . ... . . . ... 85
B.2 Aqueous Solubility ... 85
B.3 Henry's Law Constant ... 87
C Calculations 89
C.1 AVGAS released during testing ... .. 89
C.2 Evaporation of Spill ... ... 89
C.3 Dissolved Fraction of AVGAS ... 90
C.4 Source Area Recharge Rate ... 90
List of Figures
1-1 Location of Massachusetts Military Reservation . . . 1-2 Location of FS-1 Study Area . . . .
1-3 Results from the Particle Tracking Model . . . .
2-1 Regional Surficial Geologic Map . . . . 2-2 Interpretive Geologic Profile A-A' . . . . 2-3 Interpretive Geologic Profile B-B' . . . . 2-4 Regional Water Table Map . . . .
4-1 Potential Routes of Migration of the Contaminant . 4-2 Dominant migration pathways of AVGAS from FS-1 .
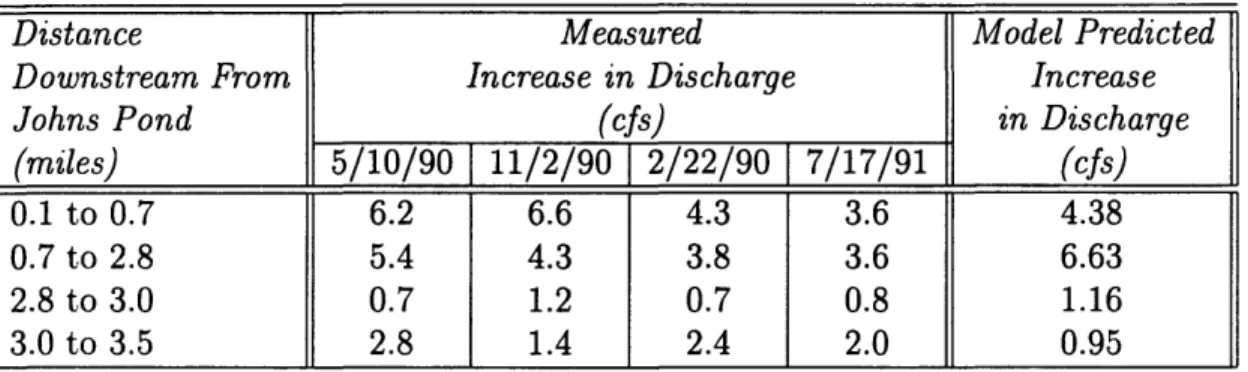
Streamflow measured at selected sites along the Quashnet Horizontal Grid Used in Dynflow and Dyntrack . . . . . Piezometric Head Contours Produced By Dynflow . . . .
Effect of Quashnet River on Piezometric Head . . . . Model Predicted Toluene Plume in 1994 . . . . Model Predicted Benzene Plume - Run 2 . . . . Model Predicted Benzene Plume - Run 3 . . . . Model Predicted Benzene Plume - Run 4 . . . . Model Predicted Benzene Plume - Run 5 . . . . Model Predicted Benzene Plume - Run 6 . . . .
River, 1990-91 49 53 . . . . . 57 . . . . . 58 . . . . . 61 . . . . . 62 . . . . . 63 . . . . . 64 . . . . . 65 . . . . . 66
7-1 Effect of Continuing Source on Benzene Plume . 7-2 Effect of Biodegradation on Benzene Plume .
12 14 16 20 21 22 23 6-1 6-2 6-3 6-4 6-5 6-6 6-7 6-8 6-9 6-10
7-3 Effect of Sorption on Benzene Plume ...
A-1 Interpretive Soil Analytical Results, FS-1 Study Area . ... 79 A-2 Interpretive Groundwater Analytical Results, Western Aircraft Turnaround,
FS-1 Study Area ... 80 A-3 Interpretive Groundwater Analytical Results, Eastern Aircraft Turnaround,
FS-1 Study Area ... 81 A-4 Interpretive Downgradient Groundwater Analytical Results, FS-1 Study
A rea . . . .. .. . 82 A-5 Interpretive Dissolved BTEX Impact Zone, FS-1 Study Area .... . 83 A-6 FS-1 Interpretive Groundwater Contamination Profile ... . 84
List of Tables
3.1 Major Components of one JP-4 Sample - Chemical Properties . . . . 27
3.2 Estimated Degradation Rates of Selected AVGAS Constituents . . . . 30
6.1 Model Stratigraphy ... ... 54
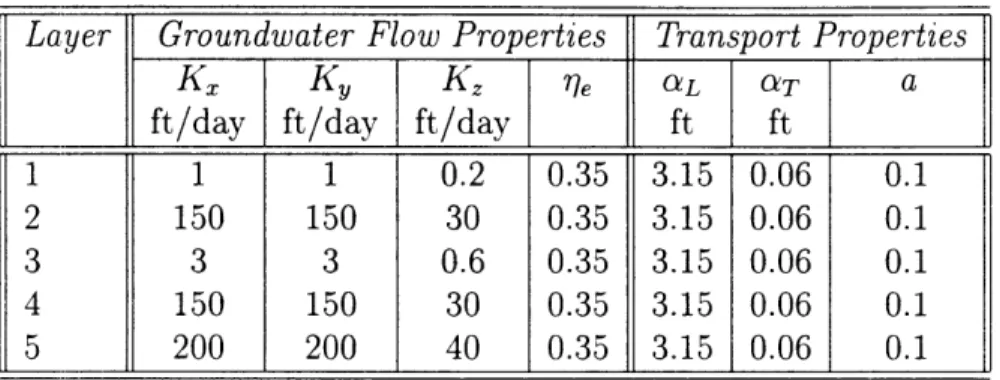
6.2 Flow and Transport Properties ... . . . . 55
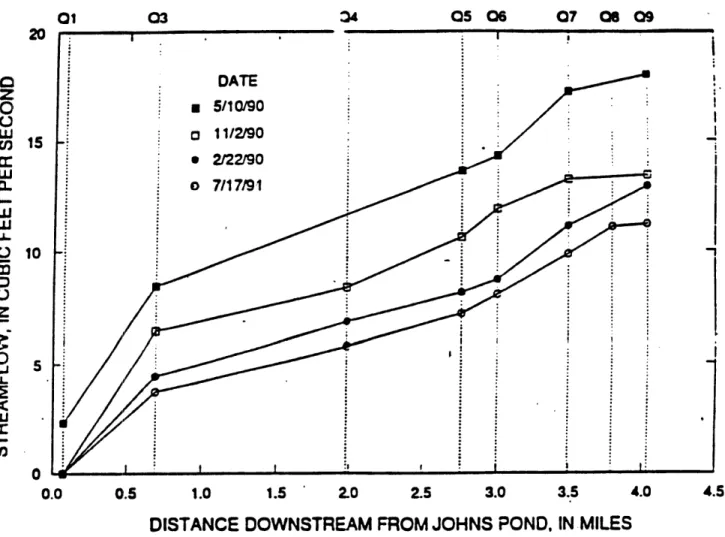
6.3 Measured and Model Predicted Discharge into the Quashnet River with Distance Downstream from Johns Pond . ... 56
6.4 Inputs to Contaminant Transport Model . ... 59
B.1 Regression Constants ... ... . ... 86
B.2 Fragment Constants Used in Estimation of logKow . . . .. . 88
Chapter 1
Introduction
Over recent years mathematical models, implemented in computer code, have emerged as a useful tool to help us understand and predict the processes occurring in the subsurface environment. The most widely accepted have been physically based models which combine conservation principles with constitutive relationships such as Darcy's and Fick's laws[17]. This type of model has been used extensively in a wide variety of applications from water management studies to groundwater contaminant assessment.
The complex nature of the subsurface environment presents the greatest challenge in the development of successful groundwater models. Although the classical ground-water flow and solute transport equations are reasonably accurate representations of the actual processes, problems are encountered when trying to apply them to real-world situations. Uncertainties arise due to the inaccessibility of this environment and the ensuing scarcity of data, heterogeneity over scales smaller than those con-sidered in a typical groundwater model, physical and chemical interactions among the various phases present, the long time scales involved, and the difficulty of ex-tending laboratory results to the field. However McLaughlin et al.[17] conclude that, although models may not be able to give us completely accurate predictions, they can give us a qualitative insight into a particular situation. This in turn can better our understanding of the processes occurring.
One particular application of models has been in the area of groundwater contami-nation. Models have been used to assess the migration of contaminants from a source, both to test hypotheses about the processes occurring and to predict future plume migration. This study uses modelling techniques to investigate a case study of this type. The problem addressed is one where there is comprehensive data on groundwa-ter flow, but very little about the actual extent of contamination and factors affecting the fate of pollutants in the groundwater. Various hypotheses concerning these fac-tors are considered, and a numerical model is used to test their respective outcomes. Consideration of this case study will enable us to comment on the widely accepted view that a modelling approach can be useful in such a situation.
The site to be considered is one of the many sites of potential environmental con-cern at the Massachusetts Military Reservation (MMR) on Cape Cod. This site, referred to as the FS-1 Study Area, has been identified as potential source of envi-ronmental impact due to the aircraft maintenance activities which were performed at the site between 1955 and 1967. These activities resulted in the release of aviation gasoline(AVGAS) into the soil, which is thought to have migrated down to the water table and contaminated the groundwater. This study uses the DYN modelling pack-ages developed by Camp Dresser and McKee[3][4] to gain an insight into the fate of the AVGAS released at this site.
1.1
Site Background
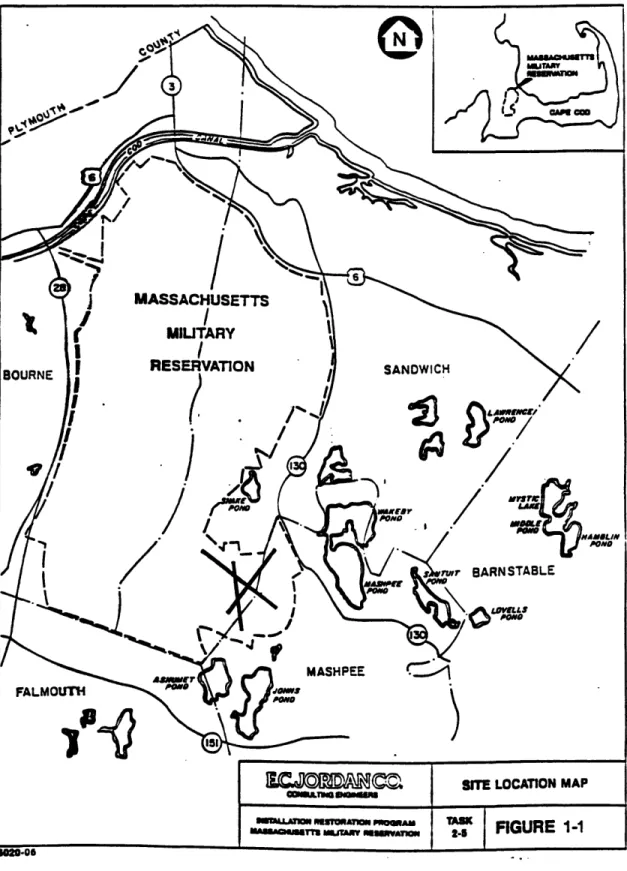
MMR occupies approximately 22,000 acres on western Cape Cod (see Figure 1-1). Military activity at MMR dates back to 1911, with the heaviest use being since 1935. Operations have been of two general types: (1) mechanized army training and maneu-vers; and (2) military aircraft operations, maintenance, and support. An Installation Restoration Program has been instigated at MMR as part of the U.S. Department of Defense program to investigate and remediate potential problems related to suspected past releases of toxic and hazardous materials at its facilities.This program has
iden-MASSACHUSETTS MIUTARY
/
RESERVATION
/
SANDWICH/
MASHPEE FALMOUThtified a total of 77 sites at MMR as possible sources of environmental contamination. The sites that have been identified are typical of military bases, including fire training areas, landfills, chemical spills, and fuel spills. The FS-1 Study Area is one such site.
1.2
FS-1 Study Area
1.2.1
Location and History
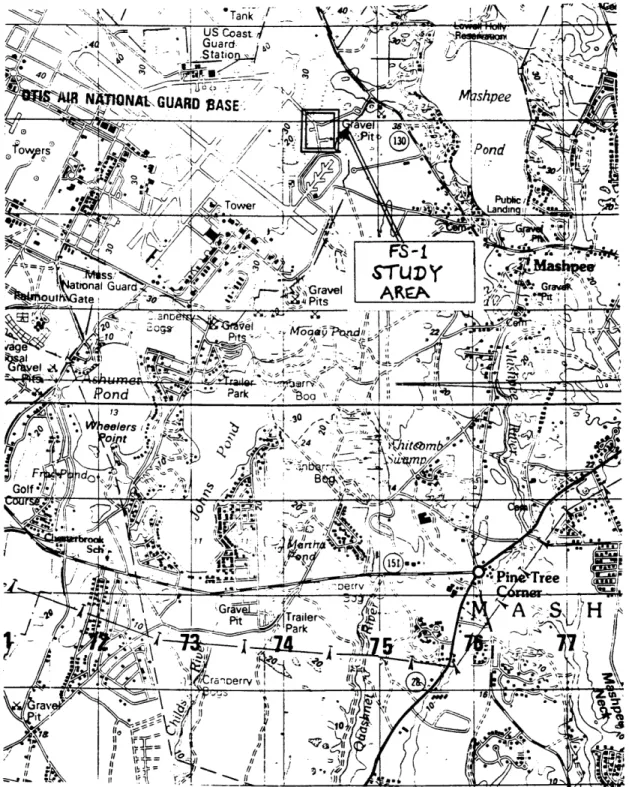
The FS-1 Study Area is located along the southeastern boundary of the base, east of the main aircraft runways (see Figure 1-2). The study area consists of two concrete paved aircraft turnarounds branching one to the east, and one to the west of Taxiway E. From 1955 to 1967, the 551st Airborne Early Warning and Control Wing (AEW&C) assigned to MMR was responsible for maintaining EC-121 Constel-lation Aircraft in the air at all times. Maintainance activities included testing aircraft fuel dump valves at this site. During the test, the aircraft's four dump valves were opened, which resulted in the dumping of an estimated 100 to 250 gallons of AVGAS per episode. Firefighting crews who witnessed the tests washed the dumped AVGAS into the soils around the pavement so that fuel vapours would not be present when the tow vehicle returned to remove the aircraft. As the aircraft aged, the frequency of the testing was increased. Later, in an effort to limit the quantity of wasted fuel, barrels were used to collect the dumped fuel. Records of AEW&C fuel management practices have since been lost; therefore, a complete inventory of the amount of AV-GAS discharged is unknown. It was estimated that fuel dump valve testing released a maximum of 400,000 to 1 million gallons of AVGAS at the FS-1 Study Area.
1.2.2
Previous Investigations
Following the identification of FS-1 as a site of potential environmental concern through a record search by Metcalf and Eddy (1983), the site has been explored by test pitting and borings performed by R.F. Weston (1985) and by Jordan (1989 and 1990). These investigations confirmed the presence of groundwater contamination
• "Tank */
Figure 1-2: Location of FS-1 Study Area
extending from the study area, with benzene, toluene, xylene and lead being detected. The Remedial Investigation conducted by E.C. Jordan Co.[7] further characterized the groundwater contamination. Impact to downgradient groundwater quality was evident at least up to a distance of 1,800ft from the Western Aircraft Turnaround, although the maximum downgradient extent of the regulated fuel volatile organic compounds (i.e., BTEX) was only approximately 500ft downgradient. Beyond this other chemical indicators of AVGAS impact were detected, including the presence of lead, tentatively identified fuel-related compounds, and reduced dissolved oxygen levels.
The Remedial Investigation raised various questions about the fate of the AVGAS released at the FS-1 Study Area. The extent of contamination detected was small compared to the amount of AVGAS thought to have been released into the soil. It has been suggested that a significant amount of biodegradation has been occurring, as indicated by the low dissolved oxygen concentrations detected at the study area, and that this is limiting the extent of the plume. However, there is also the possibility that under anoxic conditions, biodegradation may slow, and "slugs" of degradable chemicals may be transported by advection within the aquifer. A particle tracking model for a conservative contaminant was developed to determine the direction a detached slug may be transported. The result is shown in Figure 1-3. Further stud-ies were suggested into the biodegradation of fuel-related compounds at FS-1. At present an extensive groundwater sampling program using the GeoprobeTM is being
implemented. The objectives of this study are to confirm the vertical and horizontal extent of groundwater contamination and low DO concentrations known to exist near the FS-1 source area, and to determine the presence or absence and extent of low DO concentration downgradient of FS-1 and evaluate low DO zones for BTEX and total petroleum hydrocarbons.
Figure 1-3: Results from the Particle Tracking Model
1.3
Purpose and Scope
This project attempts to model the transport of AVGAS from the FS-1 source area using the DYN modelling packages developed by Camp Dresser and McKee Inc. Various hypotheses concerning the uncertain factors affecting this migration are considered. It is hoped that this analysis will help us determine the relative importance of these factors, and that the conclusions reached will help guide future field investigations.
In preparation for attempting to model this site, a study area characterization (Chapter 2), and assessment of the chemicals of concern (Chapter 3) are carried out. Chapter 4 discusses the processes which determine the fate and transport of the AVGAS, and attempts to determine the dominant migration pathways. The numerical model used in the study is introduced in Chapter 6, and Chapter 7 outlines the development of the model for this site. Finally the results are assessed, and various conclusions made.
Chapter 2
Study Area Characterization
2.1
Climate
Cape Cod has a temperate climate with precipitation distributed year round. The average annual precipitation is about 48 inches, and annual groundwater recharge is reported as being in the range of 17 to 23 inches/year[2]. The one year 24-hour rainfall event is about 2.7 inches. These figures indicate a high potential for runoff and erosion, however this is minimized due to the highly permeable surface soils and low topographic gradient. Hence the contamination migration from the site is primarily via groundwater pathways.
2.2
Geology
The surficial geology of Western Cape Cod is dominated by depositional processes associated with glacial activity during the Wisconsin period (7,000 to 85,000 years ago). A series of glacial advances and retreats resulted in the deposition of the Buzzards Bay Moraine and the Sandwich Moraine along the western and northern edges of this area. Between the two moraines lies a broad outwash plain. It is on this plain that the FS-1 Study Area is located. Sediments which form this outwash plain were carried by rivers flowing off the ice sheet, and hence tend to have a uniform grain-size. Thus the area is characterized by highly permeable soils. Fine-grained,
glaciolacustrine sediments and basal till are present below the outwash plain at the base of the unconsolidated sediments. Figures 2-1 through 2-3 show the horizontal
and vertical distribution of glacial sediments.
2.3
Regional Hydrogeology
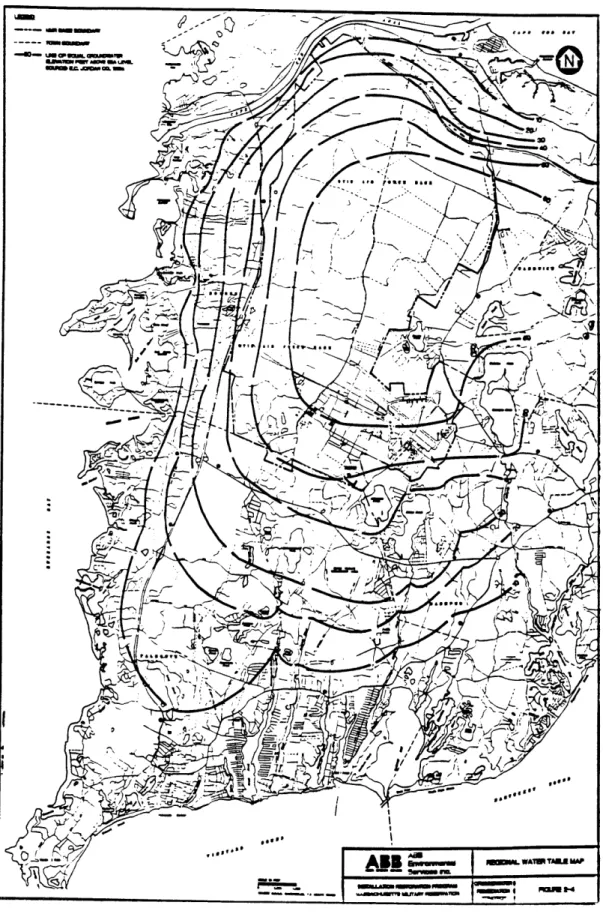
MMR is located over a U.S. Environmental Protection Agency-designated sole source aquifer. The aquifer is unconfined, and is recharged by infiltration from pre-cipitation. The top of the groundwater mound within the western Cape Cod ground-water system is located beneath the northern portion of MMR. Groundground-water flow is generally radial from this mound. The lateral boundary of the aquifer is formed by the ocean on three sides, with groundwater discharging into Nantucket Sound on the south, Buzzards Bay on the west, and Cape Cod Bay on the north. The eastern boundary is formed by the Bass River which is at some distance from the areas of interest. The interpretive map of groundwater surface produced from water level data gathered in March 1988 is shown in Figure 2-4.
The aquifer is characterized by highly permeable, stratified glacial deposits. There is a gradual transition from coarse- to fine-grained sediments with depth. In the southern part of MMR, the highly permeable sediments extend to about 200ft be-low ground surface (BGS), bebe-low which significantly finer-grained sediments which may be of the lacustrine origin are present to a depth of approximately 350 ft BGS. Although the Groundwater Remediation Strategy Report[2] suggests that this finer material may be considered the bottom of the aquifer, this study will include all ma-terial down to the bedrock in the aquifer. In the southern portion of MMR hydraulic conductivities in the coarser-grained sediments vary between 160 to 380ft/day[2]. The hydraulic conductivity of the lacustrine sediments is 10 to 50 times lower then the outwash[2]. Due to the stratification of the sediments horizontal hydraulic conduc-tivity is likely to be greater than the vertical hydraulic conducconduc-tivity. However, the degree of anisotropy is typically influenced by the presence of fine-grained sediments
CAPE
NANTUCKET SOUND
SCALE IN MILES
0 3 6 MILES
A IS II ASS Envronmental
J"lWEl Swe s• m.c- I REGIONAL SURFICIALGEOLOGIC MAP
INSTALLATIow RSTOTAION PROGRAM FIGURE 2-1 uAssacmusarrs muTIARY E·sRVA1ION TRATEGY I
is
II
II;
II1
IsIl
3II2U5
I
'~I
'i
Us sa~mmm asmimpif1meýLAW
SOURM ar. J=" C06 INI
· 3P- OIY~PIL · ·· ~- 31) ~r~amu""00
folkes
pag
---&tflo*$
A
L
6
\ IL \?C~~s 3
1··14 N~rARK·
caFigure 2-4: Regional Water Table Map
within the strata. Because of the paucity of silt in the outwash sediments, anisotropy may not be as high as would be expected from the observed stratification.
Kettle hole ponds, depressions of the land surface below the groundwater table, are common on the outwash plain. These ponds influence the direction of the groundwater flow in a manner similar to large-scale aquifer heterogeneities. This is evident in the strong changes in the slope and direction of the regional water table in the vicinity of such ponds.
Field studies have shown that piezometric head varies little with depth, apart from in the vicinity of a kettle hole pond. Here the vertical hydraulic gradients are of a similar or greater magnitude than the horizontal hydraulic gradient in the aquifer. These vertical gradients are sufficient to cause groundwater flowing at depth below the water table to discharge to the pond.
Rainfall recharge is observed to cause groundwater flow to have a slight downward component, although the flow is predominantly horizontal.
2.4
Local Geology and Hydrogeology
The local groundwater flow direction at the FS-1 study area is predominantly from north to south. However Johns pond, Ashumet pond, and the Quashnet River all significantly affect the general flow regime. The effect of the Quashnet River and the neighbouring cranberry bogs is of particular interest since the upper reaches of the river lie directly downgradient from the FS-1 source area. Its effect on the groundwater flow regime is considered in the Southeast Region Groundwater Operable Unit Remedial Investigation Report[1]. The river drains water from Johns Pond, however this outlet is controlled by a man-made structure, and is commonly blocked for months when water is not needed for cranberry bog operations. The river is thus primarily groundwater fed along nearly its entire length. The river induces upward
vertical head gradients in the groundwater, which produces a flux into the stream. This flux is approximately 0.2 ft2/s in the upper reaches (first 0.7 miles) of the river.
2.5
Aquifer Characteristics
Hydraulic Conductivity To assess hydraulic conductivity at the FS-1 source area,
rising-head tests were performed at seven monitoring wells by Jordan (1989)[7]. Hy-draulic conductivities were calculated using the Horslev method, and ranged between 136 and 240ft/day. Well screens were located between 60 and 80ft BGS, hence these conductivities are applicable to the coarse-grained sediments at shallow depths. No tests were made at greater depths. In-situ tests for hydraulic conductivity were also performed at several monitoring wells further downgradient near the Quashnet River[l]. These tests characterized the hydraulic conductivity throughout a signifi-cant portion of the aquifer. Hydraulic Conductivity was found to vary between 18 and 123ft/day, with a noticeable decrease of conductivity with depth. The ratio of horizontal to vertical hydraulic conductivities has been found to be between 2:1 and 5:1[14].
Porosity The effective porosity of the outwash material is estimated to be between
0.35[1] and 0.39[14] which is typical of sandy, stratified glacial deposits.
Dispersivity The large-scale natural gradient tracer tests performed in this aquifer
by Le Blanc et al.[14][8] yielded field-scale values of dispersivity for a non-reactive contaminant. The movement of the tracer was monitored using a three-dimensional sampling network for about 280m of travel distance. Spatial moments were used to calculate the mass, mean position, and variance for 16 views of the spatial distribution of the non-reactive tracer (bromide). Although there appeared to be a developing dis-persion process in the first 26m of distance traveled, the longitudinal dispersivity then remained constant at a limiting value of 0.96m. The calculated transverse horizontal dispersivity was 1.8cm, and transverse vertical dispersivity was 0.15cm.
Chapter 3
Contaminant Assessment
3.1
Contaminants of interest
Aviation gasoline, the contaminant released at the FS-1 Study Area, is made by blending various proportions of distillate stocks such as naphtha, gasoline and kerosene. It is very similar in composition to the later JP-4 Jet Fuel. The individual major components representing at least 0.1% by weight in one JP-4 sample are given in Table 3.1. The predominant organic chemical structures present include aromatic hydrocarbons, straight-chained alkanes, and cyclic hydrocarbons. The gasoline may also contain traces of species containing nitrogen, oxygen or sulphur, and also some trace inorganic elements. Additives may also be added to the fuel as anti-oxidants, metal deactivators, corrosion or icing inhibitors, or electrical conductivity agents. AV-GAS differs from JP-4 in that tetraethlyl lead is often added to increase the octane number of AVGAS. Due to the lack of available data for AVGAS, this study shall assume the composition of AVGAS is approximately as given in Table 3.1, with the inclusion of tetraethyl lead.
The factors affecting the fate of contamination, that is solubility, volatility, sorption, and degradation, will vary between constituents, and hence the relative concentrations of the constituents will vary with time and distance from the source. In general, the aromatic compounds tend to preferentially partition into a liquid phase, while more
8 8 808 o c0 00 800800 8000 800000000
S S o 28 -I ON... ... N N...• -....
00000 Cr-I r-t 8OQ Itl .Ic 00088 ED VM 00008 R pq t' ! 00000 -q 8888 000 10 Lg 000 qC l 00 OLO O 000 0 W 8000"N10 UNNI000 .... .. . . . . . . . a
0 0C NO n m-Mi 0 * 1 0 0 cn 00 w10 N 4 N 8i 0o N N N N N InN0NN N -: 0 N N00)N 0 NO) N0P Oa N a-. -ON 0 0In~(D0In0 0•M,,
0 oce c2 0 o r5-C -4i 0.) H: ~N.N...N.NN.... N. .N.NNNNNNNNNNNN ... .. " C NN.. . ... Inr-nnww0 N~n 00 Inr~rnrnOi-in Cd6 i6 6( V 81WS C-4w vrivr4C4 ' -4*CWC -~ w~ow044 ccwco OCDo 0ooc~iNN- NN-N 0ONNNNNONNN NNNNNN
3555iiii55555 00 : -t 000 0 COUC0 wON o CO v " C v w -tCO N cO MN 0 I I co ID 0 CCCNC(CC(C I I CC~ NN 0 UU CO o v 0 u nx c') X U U r r I 2 Lqo c .C(Cj.5 -T o * I C C NONU U 0N 0 A 9Ln'a 2. E r: ~ w r~IIMc b is Oo Uc~ ~I~Uc c4 cU N EU a S CL E % 0 ELL C6x o A5c co .--1.m •.E a I XX ujj CL x, • - n N&&N N
·-volatile constituents favour a vapour phase. Compounds which will dissolve easily in water will tend to migrate faster from the source area, and hence the compounds which present the most likely hazard to downgradient water supply wells are the aromatics, in this case benzene, toluene, ethylbenzene and xylene (BTEX).
Table 3.1 gives estimated values for the chemical properties of each of the ma-jor constituents. From this we can see that the least retarded constituents (lowest
octanol-water partition coefficients) while be Isobutane and then Benzene. Isobu-tane is a gas at ambient temperature, and so we can assume that any present will vaporize as soon as the AVGAS is released. Hence it is benzene which will migrate furthest from the source, due to it's relatively high solubility in water. Other rela-tively mobile constituents are toluene (Kow=2.69), ethylbenzene (Ko,,=3.15) and the
xylenes(Kow=3.13 to 3.20).
Any tetraethyl lead present in the AVGAS will be highly immobile since it sorps strongly to soil. Any lead that has been solubilized is expected to be predominantly in the lead (II) species.
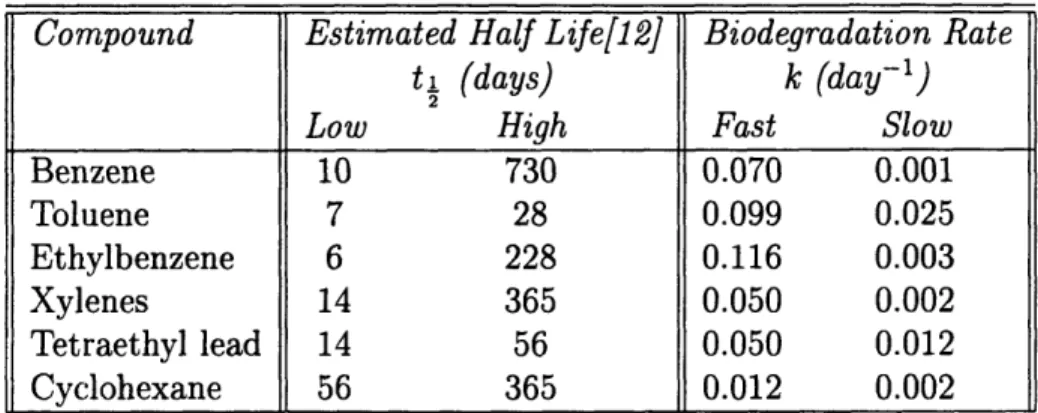
The degradation rates will also vary between the constituents of AVGAS, depending on their chemical structure. For hydrocarbons in groundwater, the primary mecha-nism of degradation will be by microorgamecha-nisms. Estimates of degradation rates are not available for all the constituents of AVGAS. However, Table 3.2 gives a range of estimates for several of the constituents. It can be seen that the aromatics exhibit a wide range of biodegradation rates, with benzene tending to be the least rapidly degraded. Tetraethyl lead is rapidly degraded. Information on the growth rate of bac-terial species can lead us to a qualitative understanding of the biodegradation rates of other constituents. The shorter-chained alkanes (up to C8) are utilized by relatively
few bacterial species and so will tend not to be biodegraded. Conversely, utilization of long-chained alkanes is widespread among microorganisms, and n-alkanes with 10-18 carbons are utilized with the greatest frequency and rapidity. Hence biodegradation rates of these compounds will tend to be high[9]. The cyclic alkanes are also subject
Compound Estimated Half Life[12] Biodegradation Rate
t I (days) k (day-')
Low High Fast Slow
Benzene 10 730 0.070 0.001 Toluene 7 28 0.099 0.025 Ethylbenzene 6 228 0.116 0.003 Xylenes 14 365 0.050 0.002 Tetraethyl lead 14 56 0.050 0.012 Cyclohexane 56 365 0.012 0.002
Table 3.2: Estimated Degradation Rates of Selected AVGAS Constituents
to biodegradation. The most persistent compounds will be those that are least sus-ceptible to biodegradation. This assessment of the relative biodegradability of the constituents of AVGAS leads to the conclusion that the most persistent compounds will be benzene, and the short-chained alkanes. The short-chained alkanes, however, are not considered as great a threat to downgradient water supplies since they are much less soluble, and hence less mobile.
Hence we can conclude that the constituent of AVGAS that is of most concern will be benzene, due to its high solubility and relatively low susceptibility to biodegrada-tion.
3.2
Observed distributions
The most extensive field investigation of FS-1 was undertaken during the Remedial Investigation[7]. Both the residual contamination in the soil near the source, and the groundwater contamination at the source and downgradient were investigated. Sum-maries of the results, along with an interpretive groundwater contamination profile from the Groundwater Remediation Strategy Report[2], are included in Appendix A.
The results indicate that there is residual fuel-related contamination of the soil at both turnarounds, although a different set of compounds was found at each source
area. The soils beneath the Western Aircraft Turnaround exhibit greater residual contamination with lead, tetraethyl lead, and total petroleum hydrocarbons being detected in deep soils just above the water table. At the Eastern Aircraft Turnaround several tentatively identified (that is, non-regulated and therefore not specifically tested for) alkane isomers commonly related with fuel products were detected in the soil just below the water table. The compounds detected included methylated isomers of octane, hexane, cyclohexane, and pentane, and heptane. Except in these deep soils, there was no evidence of residual contamination due to AVGAS in the unsaturated sands.
Fuel-related compounds were detected in groundwater samples from both source ar-eas, though to a much lesser extent at the Eastern Aircraft Turnaround. Toluene and xylene were detected up to 200ft downgradient of the Western Aircraft Turnaround,
and benzene was detected in one monitoring well, 500ft downgradient. The detection of lead, fuel-related tentatively identified compounds (including methylated isomers of butane, pentane, hexane, heptane, octane, cyclohexane, and cyclopentane), and low dissolved oxygen levels indicating biodegradation has taken place, suggest a zone extending up to 1,800ft downgradient that has been impacted.
The Remedial Investigation concludes that the Western Aircraft Turnaround is the major source area, with significant amounts of fuel-related constituents still persist-ing in the capillary zone and high levels of regulated fuel-related compounds bepersist-ing detected in the groundwater.
Chapter 4
Migration of AVGAS from FS-1
This chapter will consider the processes which determine the fate and transport of the AVGAS released at the FS-1 Study Area. The migration of AVGAS away from the source area can be described by considering the processes occuring at three distinct stages. These are:
* contaminant present on the surface
* transport through the unsaturated zone
* transport in the saturated zone
The fate of each constituent of AVGAS in each of these stages will vary depending on the physical and chemical properties of the compound, and the characteristics of the environment it is in. The model developed by this study will quantatively assess the migration of AVGAS within the groundwater. However we must also assess the behaviour of the AVGAS prior to reaching the water table in order to predict the rate in which contaminant arrives at the water table to determine the input into this model. This assessment will also help us determine the likely composition of the contaminant which reaches the groundwater.
4.1
Source Assessment
AVGAS was released at the FS-1 Study Area as a result of testing the fuel dump valves of the aircraft being maintained at the site. During this test the valves were opened for a short time, and fuel was dumped directly onto the ground below. In assessing the probable extent of contamination from the source area it is necessary to ascertain how much fuel was dumped in this procedure, and how often aircraft were tested at this site. As previously mentioned, records of this procedure have been lost, and so we must infer this information from the interviews with personnel involved in the testing, and from known specifications of the aircraft. Each aircraft is known to have had 3 dump valves per wing, the flow rate through which was 37.5 gpm. From the interviews it was judged that approximately one aircraft was tested per day during the period testing took place at this site (1955 to 1967). Using this information, and the assumption that the valves were left open for 30 seconds (consistent with the description of the vavles being left open for a minimum amount of time), the volume of AVGAS dumped per episode is estimated as 112.5 gallons. Hence over the 12 years of testing a total of about 500,000 gallons of AVGAS was released at FS-1. This is judged to be the most logical case scenario. Other more conservative calculations yield an estimate of the total amount of AVGAS released to be up to about 1 million gallons.
4.2
Migration from the Source
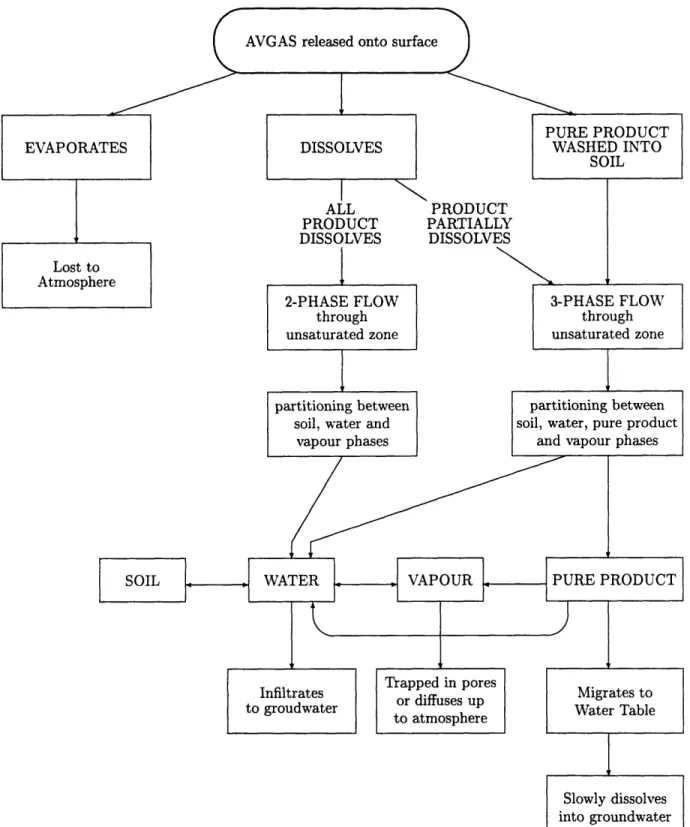
Once the AXVGAS has been released into the environment there are several potential migration routes the constituents may follow. Figure 4-1 summarizes these routes. It is not necessarily true that all the contaminant will follow one particular route, in fact it is likely that there will be some partitioning between the different routes. To fully quantify the exact partitioning between these routes would require a detailed model of each stage of migration. This is beyond the scope of this study. However we can qualitatively determine the likely partitioning by considering the physical properties
PRODUCT
3-PHASE FLOW through unsaturated zone
partitioning between soil, water, pure product
and vapour phases
Figure 4-1: Potential Routes of Migration of the Contaminant
On release into the environment there are several potential routes the constituents of A VGAS may follow. Partitioning between these routes will depend on the chemical properties of the constituents.
of the various constituents.
4.2.1
Contaminant Present on the Surface
AVGAS released during the testing would probably have landed on the asphalt of the aircraft turnarounds. This is a reasonable assumption given the size of the turnarounds, and also the presence of the firefighters, whose task was to prevent the fuel evaporating by washing it away from the testing area. If the AVGAS had fallen onto the dirt surrounding the turnarounds this task would have been unnecessary since infiltration into the soil would prevent significant evaporation. If the AVGAS did fall onto asphalt, there would have been no immediate infiltration, and hence the potential for rapid evaporation is high. In fact if the released AVGAS had been left undisturbed on the asphalt, it would only take in the order of an hour for the entire slick to evaporate (see calculation in Appendix C). This was not the case, however, since firefighters were on hand specifically to prevent this occuring.
Water added by the firefighters would have had the dual effect of dissolving a por-tion of the AVGAS , whilst washing the remaining pure product towards the soil. The process is also likely to induce some increased evaporation since it will increase the surface area of the contaminant (both dissolved and pure product) and the relative wind speed to this surface. Hence there will be an initial partitioning between con-taminant which evaporates, and thus escapes to the atmosphere, concon-taminant which is dissolved, and pure product which is washed into the soil along with the water. This partitioning will depend on the physical properties of the constituents, given in Table 3.1. The highly volatile constituents, such as butane and isobutane which are gases at atmospheric temperatures, are likely to evaporate more rapidly than they would dissolve, and hence will not migrate to the groundwater. The detection of dimethylbutane (one of the more volatile constituents) in the groundwater suggests that the application of water was successful in it's attempt to limit the occurrence of evaporation, and in fact most of the constituents will have been washed into the soils before significant evaporation could take place. Thus we conclude that the loss
of contaminant due to evaporation from the surface is a relatively small effect.
The partitioning between contaminant that dissolves and that which remains as pure product will depend on the solubilities of each of the constituents. The more soluble constituents, such as the aromatic hydrocarbons (benzene, toluene, ethylben-zene and xylene), will tend to dissolve readily, whereas the less soluble constituents, such as the longer chained alkanes (octane, nonane etc.) may remain as pure product. The fraction of AVGAS which dissolves will depend on the quantity of water added by the firefighters. Unfortunately the exact procedure followed by the firefighters during the testing is not known. A possible scenario is that four hoses were used to wash down the area for a period of 10 minutes during and after the time when the dump valves were open. This would result in a total of 10,000 gallons being added to the area (see calculation in Appendix C). This would dissolve approximately 3.6% of the spilt AVGAS. The more soluble constituents would be preferentially dissolved.
Contaminant entering the unsaturated zone is thus likely to be both pure product and in an aqueous solution. The majority of the contaminant will exist as pure product, consisting of the less soluble constituents such as the longer-chained alkanes and cyclic alkanes. The dissolved fraction of the contaminant will primarily consist of the aromatic hydrocarbons and the short-chained alkanes.
4.2.2
Migration through the Unsaturated Zone
As the contaminant migrates through the unsaturated zone there is a continuous exchange of contaminant between the different possible phases as shown in Figure 4-1. Pure product may dissolve or evaporate. Dissolved contaminant may evaporate or undergo adsorption. Contaminant that has evaporated and is thus existing in a vapour phase may redissolve, and finally contaminant that has become sorped to the soil particles may desorp as water continues to flush past. The movement of the contaminant through this zone is thus a three-phase problem, with pure product, and contaminated water and air all free to migrate. To quantify this process a model
would not only have to consider the relative motions of each of these three phases, but also the partitioning kinetics. A frequent assumption is that an equilibrium partitioning between each of these phases is reached within a much shorter timescale than the migration process. Hence the fraction of the contaminant present in each phase would remain relatively constant.
The presence of pure product will have the effect of increasing the time it takes for contaminant, both in aqueous and non-aqueous phases, to reach the water table. In this three-phase flow, water is the wetting fluid, AVGAS is the non-wetting fluid with respect to water, but the wetting fluid with respect to air, and air is the non-wetting fluid. As they move the three phases will interfere with one another thus inhibiting flow to a certain degree. The relative permeability of the soil matrix, and hence the velocity of flow, will depend on the relative saturations of each phase. Flow of aqueous or non-aqueous phase liquid will only occur once the residual saturation has been exceeded.
As the contaminant travels downwards through the unsaturated zone, sorption to the soil particles will occur. This partitioning will depend on the properties of the constituent considered. Constituents with a high octanol-water partitioning coeffi-cient (Ko) will tend to sorp more readily onto the soil particles. Table 3.1 gives values of Ko for each of the constituents. This sorption has the effect of retarding the rate of transport of contaminant down to the water table. This process will also reduce the rate at which contaminant is added to the groundwater, since the sorption reduces the concentration in the infiltrating water. Sorption is noncompetitive[6], with many nonpolar chemicals able to partition between water and the available vol-ume of natural organic matter at the same time without interfering with each other. However, the soil underlying the FS-1 source area has been found to have a very low organic carbon content (foc = 0.0001), and hence it is likely that there is a limit to the amount of contaminant that can sorp onto this soil. The source at FS-1 is contin-uous over a long period of time, and hence a state may be reached where no further
sorption is possible. In this case, the dissolved contaminant will migrate through the unsaturated zone unretarded. After testing has ceased contaminant will undergo des-orption from the soil as uncontaminated rainwater seeps through this zone. Also, the recharge due to precipitation will mobilize the residual pure product present in the soil pores. This is consistent with the lack of detection of hydrocarbons in the soils of much of the unsaturated zone, which indicates that there is no longer any AVGAS sorped onto these soil particles. These two processes will have caused a continuing source after the testing ceased.
Contaminant will also be removed from the infiltrating water and pure product via the process of evaporation. Contaminant existing in the vapour phase may get trapped between the soil particles, however, it's eventual fate will be to escape up-wards to the atmosphere. Following the same reasoning described in the consideration of evaporation from the surface, we can conclude that the amount of contaminant lost by this process is likely to be relatively small.
On reaching the water table, contaminant that is in the aqueous phase will en-ter the groundwaen-ter directly, whereas the pure product will form a layer of floating non-aqueous phase liquid in the capillary fringe. This floating product may then be dissolved into the groundwater beneath it, acting as a secondary source of contami-nation. It will result in a slower addition of contaminant to the groundwater than if the contaminant were already in the aqueous phase when it reached the water table. As previously discussed the fraction of contaminant arriving at the water table in the aqueous phase is likely to consist of the most soluble constituents of AVGAS such as the aromatics, whereas the pure product will consist of the less soluble constituents. Hence the more soluble constituents will contaminate the groundwater immediately, whilst there is a delay before the groundwater becomes contaminated by the less soluble constituents.
Hence the dominant migration pathway of the constituents of AVGAS from FS-1 is as a non-aqueous phase liquid seeping downwards through the unsaturated zone,
forming layer of floating product in the capillary fringe, and subsequently dissolving into the groundwater. Of more concern, however, is the fraction of contaminant that was dissolved on the surface and hence reached the water table as an aqueous solution. This fraction will contaminate the groundwater directly and so will have had longer to migrate from the source area. After testing ceased, contaminant that had sorped onto the soil particles of this zone will desorp as clean rainwater infiltrates, and provide a continuing source. The continuing source will also be contributed to by residual contamination being flushed out of the pores by recharge.
4.2.3
Migration in the Saturated Zone
Once the contaminant is dissolved within the groundwater it will migrate as dic-tated by the flow field at the point of injection. At the FS-1 Study Area the direction of groundwater flow is from north to south, and so contaminant will migrate in a southerly direction. Recharge due to precipitation will induce a slight downwards drift of the contaminant plume with distance from the source. As in the unsaturated zone, there will be some partitioning of contaminant between the groundwater and the soil particles. Again, this sorption will cause the migration of AVGAS to be retarded, and so reduce the current extent of contamination.
Biodegradation of the contaminant may occur at any of the stages of migration of AVGAS after its release into the atmosphere. The rate of biodegradation will vary for each constituent, and will depend on that constituent's chemical structure. It will also depend on the amount of oxygen available to support the process. This can often be a limiting factor of biodegradation within groundwater. For example, Chiang et al.[5] found that if the dissolved oxygen level drops below about 2 mg, aerobic biodegradation of BTEX will cease. Field results show, however, that in this aquifer the average dissolved oxygen level is well above this limiting value. Oxygen deficiency will only become a limiting factor in areas where significant biodegrada-tion has occurred, consuming the dissolved oxygen, as was found at the FS-1 source area. Biodegradation will have the effect of reducing the total volume of contaminant
present in the aquifer at the current time.
The dissolved oxygen level is also a good indicator of whether biodegradation has occurred in particular part of the aquifer. The process of biodegradation consumes oxygen, and hence if the DO level is found to be below the average level detected in the aquifer, it can be inferred that biodegradation has occurred there. Chiang et al.[5] found there to be an inverse correlation between contaminant concentration and biodegradation. A similar inverse correlation was found within the plume emanating from FS-1. Hence we can infer that biodegradation has been occuring to some extent.
4.3
Summary
The above discussion qualitatively describes the likely migration routes of AVGAS after release at the FS-1 Study Area. It is thought that loss of contaminant by evap-oration both from the surface and whilst migrating through the unsaturated zone will be a relatively small effect. Contaminant is likely to enter the unsaturated zone both as pure product and as an aqueous solution, with both migrating downwards to the water table. Sorption will act to retard the migration through the unsaturated zone. Pure product reaching the water table will form a floating layer and will subse-quently be either biodegraded by microorganisms or slowly dissolved by the moving groundwater. Contaminant that has migrated down through the unsaturated zone in the aqueous phase will enter the groundwater directly, and will hence have longer to migrate downgradient and so is of more concern when considering the safety of the downgradient monitoring wells. After testing has ceased, desorption from the soil par-ticles in the unsaturated zone and mobilization of residual contamination will act as a continuing source. Migration away from the source area will follow the groundwater flow field, with the contaminant undergoing sorption and biodegradation.
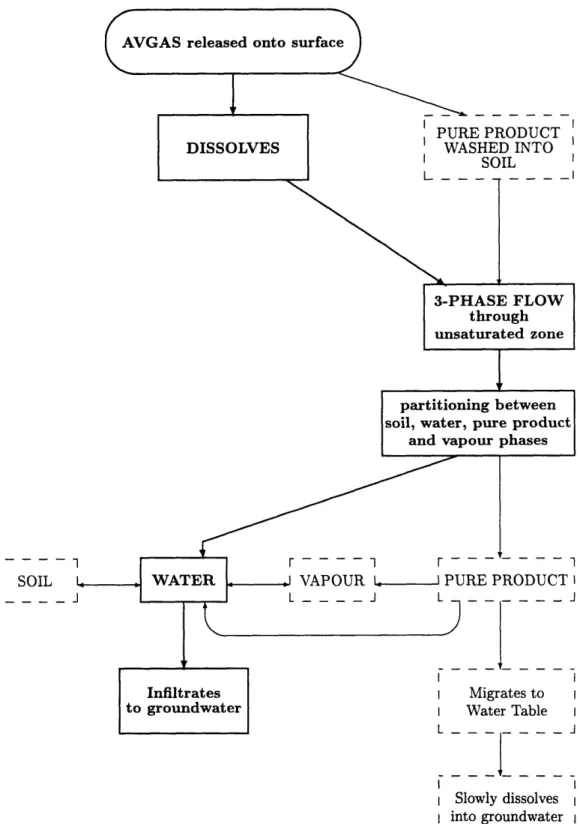
Figure 4-2 shows the dominant migration pathways from the initial release of AV-GAS onto the surface. The initial partitioning of AVAV-GAS is between dissolved and pure product, both of which enter the soil. This partitioning will depend on the
amount of water added by the firefighters. The flow through the unsaturated zone is then a three-phase flow with continuous exchange of contaminant between soil, water, pure product and vapour. Contaminant will reach the water table in two ways: ei-ther as an aqueous solution, which enters the groundwater directly, or as pure product which slowly dissolves into the groundwater.
The greatest hazard to downgradient water supplies is presented by the constituents which migrate through the unsaturated zone in an aqueous solution,and therefore enter the groundwater directly. These will be the more soluble constituents. As we saw in Chapter 3, the most soluble constituent that is not a gas at atmospheric temperature (and therefore is not lost by evaporation) is benzene. Consideration of the extent of the benzene plume will thus reveal the furthest extent of contaminant from the source area. The most likely migration pathway of benzene is shown by the bold lines on Figure 4-2. It is thought that all the benzene in the AVGAS is completely dissolved at the surface due to its high solubility. Thus it enters the soil as an aqueous solution. Uncertainties arise at every stage of its migration. However, the uncertainty in its migration once it reaches the groundwater can be reduced to three factors: the strength and duration of the source of benzene at the water table, which will be determined by its migration through the unsaturated zone; the rate at which biodegradation occurs; and the amount by which it undergoes sorption out of the groundwater. These three factors will determine the extent of the benzene plume.
AVGAS released onto surface
PURE PRODUCT
DISSOLVES WASHED INTO
SOIL 3-PHASE FLOW through unsaturated zone
IF
partitioning between soil, water, pure productand vapour phases
S----L
I SOIL _
L - - - - J
I
VAPOUR - I PURE PRODUCT I
L
J
L
---Infiltrates
to groundwater I I Water Table Migrates to II
L _ _ _- _
__-I Slowly dissolves
I into groundwater I
L --- __- _J
Figure 4-2: Dominant migration pathways of AVGAS from FS-1
Consideration of the testing procedures, chemical properties of AVGAS constituents, and processes occurring at each stage on migration lead to the conclusion that some migration pathways are more important than others. Likely migration pathway for benzene is shown in bold face.
1
Chapter 5
Numerical Models
The governing equations of groundwater flow, and of contaminant transport are formulated by considering the conservation of mass, along with constitutive relation-ships such a Darcy's and Fick's laws. The classical groundwater flow equation may be written as
sOh _0 Oh
S Kij + f (Xi, t) (5.1)
at OXj I aX]
where the piezometric head, h, is the dependent variable, and the specific storage
S and hydraulic conductivity tensor K are coefficients which describe the aquifer's
capacity to store and conduct water. The function f(Xi, t) accounts for point
singu-larities, such as pumping from a well.
Contaminant transport can be described by the Advection-Dispersion-Reaction (ADR) Equation, which can be written as
S+ vi a v + r (5.2) where r is taken symbolically as the mass produced (or consumed) per unit volume of water per unit time, C is the solute concentration, ce is the dispersivity coefficient, and
v is the local flow velocity. If the only processes contributing to the production term,
model, this equation becomes
C
c -4
vi OC=
-
a[
vOC kC (53)(5.3)
19t
R
-Xi
5X-
R8X3
R
where R is the retardation factor due to sorption, and k is the first-order decay coefficient.
For some simple scenarios these equations can be solved analytically, however most situations are too complex to take this approach, and we must look to a numerical solution. The general motivation behind a model is to approximated the continuous solution of a given differential equation by solving algebraic equations for a finite number of discrete values of the solution. The basic idea underlying most groundwa-ter models is to split the region under consideration into a finite number of discrete sub-regions (elements) and write local equations for flux in terms of the dependent variable (head for groundwater flow, and conconcentration for contaminant transport) at selected points (nodes) on the boundary of the element by making some assump-tions about the variation of the variable across the element. One of two methods can be used to formulate these local equations, either a Finite Difference method, or a Finite Element method. These local equations can then be solve simultaneously to yield values of the dependent variable at each node. This process can be repeated for each timestep in a transient problem. The inputs to this type of model will be the boundary conditions, the parameters of the governing equations and some "initial guess" of the distribution of the dependent variable.
5.1
Dynflow, Dyntrack and Dynplot
This study uses the DYN modelling system to develop a model of the contaminant transport from the FS-1 source area. This system consists of three components, Dynflow, Dyntrack and Dynplot. Dynflow is a three-dimensional flow code based on the governing equations of flow in a porous media, Dyntrack provides a simulation of three-dimensional contaminant transport driven by the flow field generated by
Dynflow, and Dynplot is an interactive visualization tool used in both model creation and to view the results generated by Dynflow and Dynplot.
Dynflow uses the finite element method to solve the groundwater flow equations. This method is seen to be preferable to the finite difference method since the element geometry is more flexible and hence it enables us to cope with irregular boundary geometries. However, this method can prove to be more complicated to apply, and requires more sophisticated grid generation capacity.
Dyntrack does not solve the governing equations of contaminant transport directly, but rather utilizes the "Random Walk" method, which follows discrete amounts of contaminant mass as they move through the aquifer. This Lagrangian method consid-ers a statistically significant number of particles injected into the groundwater, each with an associated weight, decay rate, and retardation rate. At each timestep the
translation of a particle has two components. The first component is deterministic, and simulates the advection of the particle as driven by the groundwater flow field. If the particle is retarded, this factor is included into the deterministic translation. The second component is probabilistic, and simulates the dispersion of the particles. The weight of the particle is also decreased over the timestep if biodegradation is occurring. The weight of the particle at the end of the timestep is given by
W(t+6t) = Wtexp(-k6t) (5.4)
where 6t is the length of the timestep. The probability density function for the location of a particle yields the concentration distribution. At any time, the concen-tration in a given element can be calculated by summing the mass of all the particles in that element and dividing by the volume of the element.
The advantages of using this particle tracking method over the more traditional Eulerian methods are that the solution is stable, there is no numerical dispersion, and no "overshoot" (negative concentrations) can occur. Above all it is often a much
quicker method since there is no large system of equations to solve, and coarser discretization in space is allowed. It does, however, have two disadvantages in that it does not solve for concentrations directly, and that there are no "hard" criteria to select the number of particles used to model a particular plume. The number of particles must be selected by a trial and error method and relies upon the experience of the modeller.
5.2
Model Parameters
The success of a model depends largely on the selection of suitable values for the parameters introduced in the governing equations. These parameters vary over scales smaller than those considered in a typical groundwater flow problem. It is, however, impossible to fully characterize this small-scale variability of the parameters and hence we use regionalised effective parameters[17]. This method accounts for large-scale spatial variations by separating the region under consideration into smaller regions of constant effective parameters which average out the effects of local variability.
Chapter 6
Model of FS-1
6.1
Conceptual Model
Prior to developing the numerical model of transport of AVGAS within the sat-urated zone, it is helpful to consider a conceptual model of the processes that are occuring. This section outlines the conceptual model of both the flow field and the contaminant migration, developed from the discussion of aquifer characteristics, chemicals of concern, history of the spill, and migration of the contaminant from the surface discussed in Chapters 2 through 4. In particular, it is necessary to determine the migration pathway of the constituents to be modelled, in order to quantify the source strength of these constituents at the water table.
6.1.1
Flow Field
Extensive field investigation of the western part of Cape Cod led to the interpretive water table profile presented in Figure 2-4. This study will refer to this map, rather than the original field data, in its assessment of the flow field. This is judged to be more accurate than using a small subset of the data that this map was created from. Consideration of the full data set is beyond the scope of this study.
From Figure 2-4 we see flow is predominantly north to south in the area of FS-1. The average head gradient for the region of interest is approximately 0.0025. Most