HAL Id: hal-02950353
https://hal.inria.fr/hal-02950353v2
Submitted on 2 Feb 2021
HAL is a multi-disciplinary open access
archive for the deposit and dissemination of
sci-entific research documents, whether they are
pub-lished or not. The documents may come from
teaching and research institutions in France or
abroad, or from public or private research centers.
L’archive ouverte pluridisciplinaire HAL, est
destinée au dépôt et à la diffusion de documents
scientifiques de niveau recherche, publiés ou non,
émanant des établissements d’enseignement et de
recherche français ou étrangers, des laboratoires
publics ou privés.
Multivariate analysis is sufficient for lesion-behaviour
mapping
Lucas Martin, Julie Josse, Bertrand Thirion
To cite this version:
Lucas Martin, Julie Josse, Bertrand Thirion. Multivariate analysis is sufficient for lesion-behaviour
mapping. MICCAI BrainLes 2020 workshop, Oct 2020, Lima, Peru. �hal-02950353v2�
lesion-behaviour mapping
Lucas Martin?, Julie Josse†, Bertrand Thirion?
? Inria, CEA, Universit´e Paris Saclay, † Inria
Abstract. Lesion-behaviour mapping aims at predicting individual be-havioural deficits, given a certain pattern of brain lesions. It also brings fundamental insights on brain organization, as lesions can be under-stood as interventions on normal brain function. We focus here on the case of stroke. The most standard approach to lesion-behaviour mapping is mass-univariate analysis, but it is inaccurate due to correlations be-tween the different brain regions induced by vascularisation. Recently, it has been claimed that multivariate methods are also subject to lesion-anatomical bias, and that a move towards a causal approach is necessary to eliminate that bias. In this paper, we reframe the lesion-behaviour brain mapping problem using classical causal inference tools. We show that, in the absence of additional clinical data and if only one region has an effect on the behavioural scores, suitable multivariate methods are sufficient to address lesion-anatomical bias. This is a commonly encoun-tered situation when working with public datasets, which very often lack general health data. We support our claim with a set of simulated ex-periments using a publicly available lesion imaging dataset, on which we show that adequate multivariate models provide state-of-the art results. Keywords: Lesion-behaviour mapping· Multivariate methods · Causal inference
1
Introduction
Lesion-behaviour mapping aims at predicting individual behavioural impacts of brain lesions, such as those induced by stroke. Based on large-scale datasets including brain images and corresponding deficits, this mapping can be used to assess the critical impact of brain territories on behaviour. Yet, this remains a complex endeavour [14]. Traditionally, univariate methods, such as voxel-based lesion-symptom mapping, have been used for this purpose [2]. However, such methods are subject to the topographical bias induced by brain vascularization, i.e. brain regions that are irrigated by the same artery often die together in the case of stroke. In turn, this induces a correlation between the lesion status of different brain regions, which can lead to spurious effects being detected [12].
Later on, multivariate methods that incorporate the lesion status of every brain region in a single model have been introduced [16]. While these methods were thought to be able to overcome topographical bias, this notion has recently
been challenged [17], based on numerical experiments involving support vector regression. It has also been argued that only causal inference methods would be able to overcome topographical bias.
In this work, we tackle the question of which multivariate methods are suited for this type of inference. First, we notice that inference based on multivariate models is hard due to the high dimensionality of the problem, and the covari-ance structure between different brain regions [14]. Specific methods, such as desparsified Lasso [19], are required for accurate inference. Second, we point out the possible inadequacy of linear models, given that deficits can result from a complex combination of lesions [7].
We then discuss in detail the expected benefits of causal inference tools: those are limited unless additional clinical data are available together with the lesion data. Numerical experiments are performed by simulating behavioral deficits based on a publicly available lesion database [15]. These support our claims, and also replicate the results reported in [17].
2
Multivariate methods considered
Let us consider the case where the only data available to us are segmented le-sion maps, typically reduced to lele-sion occurrence in a predefined set of regions of interest (ROIs) of a given brain atlas, together with behavioural scores highlight-ing some deficits, but no other clinical data. This is a commonly encountered situation when working with public datasets.
The outcome is a given behavioural score y, observed in n subjects, and the potential causes are the lesion status of the different brain regions (Xj)j=1..p.
Multivariate statistical inference consists in finding which variables are predictive of the deficit, given the status of the other regions.
If we assume a linear model, the reference method is the desparsified LASSO [19], namely a de-biased version of the lasso, in which the model weights βDLASSO(λ) are computed from the regular Lasso weights βLASSO(λ) as follows :
βDLASSO(λ) = βLASSO(λ) + 1 nΣd
−1XT(y − Xβ
LASSO(λ))
where λ is the regularization parameter of the LASSO, and dΣ−1is an estimate of
the inverse covariance matrix of the model. Explicit formulae for the covariance matrix of βDLASSO(λ), allowing the computation of reliable confidence intervals. The desparsified LASSO is well-suited to the problem of lesion-behaviour mapping, because it gives reliable confidence intervals on model weights. More-over, it takes into account the correlations between brain regions, while allowing inference in the case where p ≥ n.
We also consider non-linear multivariate models, such as random forests with permutation feature importance [3], and random forests with approximated Shapley values [11]. Support vector regression is investigated as well, in order to relate our findings to those of [17], and as a baseline commonly used in the literature [20].
3
Causal analysis of the problem
Causal analysis imposes to first split the problem into several cases, depending on whether only a single, or multiple ROIs affect the behavioural scores.
Confounding bias and backdoor paths Confounding variables are variables that have a causal effect on potential causes and outcome. Those can spuriously en-hance the performance of predictive machine learning algorithms, but hamper their usefulness when trying to infer brain-behaviour (or in our case, lesion-behaviour) relationships [4]. The type of bias induced by these confounding variables is called confounding bias.
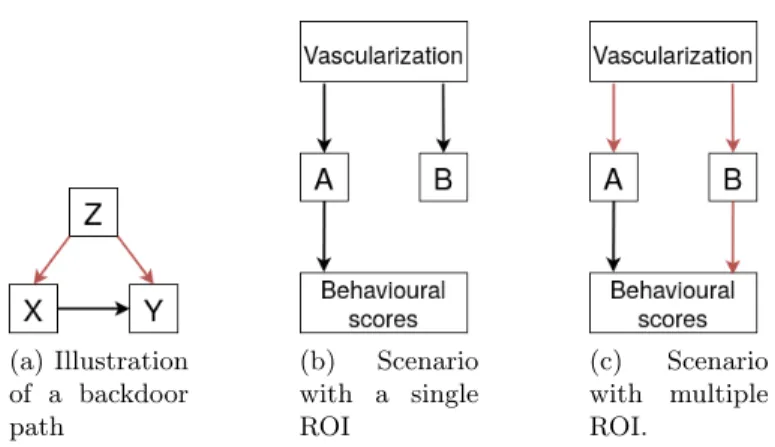
Confounding bias occurs whenever there exists an unblocked backdoor path between the cause and the outcome. A backdoor path is a path in the undirected causal graph that does not include the direct edge from the cause to the outcome. See the graph in Fig.1(a) for a token example. Backdoor paths are blocked by colliders, that are vertices with two incoming edges : →Z ←, or by conditioning on vertices that are not colliders.
Classical causal inference methods aim at eliminating confounding bias by conditioning on an appropriate set of observed variables. For a more in-depth presentation of this topic, the reader can consult section 3.3 of [13]. In particular, these methods make the assumption that no unobserved confounding variable exists. Therefore, in the absence of observed confounders, classical causal in-ference methods should not have any advantage over appropriate multivariate methods.
Single ROI case In Fig. 1(b), the middle causal graph links the observed or known variables in a simplified situation with only two brain regions denoted A and B. As brain vascularization induces correlations between regions, we choose to represent it in the causal graph. As can be seen from the middle graph, there are no observed confounding variables in this case, because there are no backdoor paths between the behavioural scores and region A. Causal inference methods should not yield improved performance over proper multivariate inference meth-ods.
Multiple ROI case In the case where multiple brain regions linked by vasculature have a causal effect on behavioural scores, a backdoor path opens up as shown on the right causal graph in Fig. 1(c), hence causal inference methods may be necessary. However, the magnitude of the confounding bias induced by this backdoor path is unknown, and may be small. In turn, this may confer limited performance improvements with respect to causal inference methods.
4
Experiments
It is important to notice that there is no ground truth available for such problems, hence we have to rely on simulations to control the behavior of inference tools.
(a) Illustration of a backdoor path (b) Scenario with a single ROI (c) Scenario with multiple ROI.
Fig. 1: The sample causal graph on the left illustrates the concept of a backdoor path. X is the cause, Y the outcome, and Z the confounding variable. The middle causal graph represents the known variables in the single ROI case. The right causal graph represents the multiple ROI case. A and B are two different brain regions irrigated by the same artery. Backdoor paths are highlighted in red.
Dataset used Similar to the experiments done in [17], we used lesion maps from the publicly available LESYMAP dataset (https://github.com/dorianps/ LESYMAP) [15], which includes left hemisphere stroke lesions from 131 pa-tients. We partition the brain volumes into 403 regions using the parcellation atlas provided with the LESYMAP dataset.
Generative model of simulated outcomes We simulate behavioural scores using the status of several regions pairs of the provided atlas. We considered regions to be lesioned if more than 60 % of their voxels were lesioned. The figures in this paper showcase the results obtained using regions 100 and 101. The same experiments were performed on several other region pairs ({100, 101}, {108, 114}, {109, 114}, {79, 108}, {80, 108}), and similar results were obtained. These are available in the supplementary materials. We partition the brain volumes into 403 regions using the parcellation atlas provided with the LESYMAP dataset. Because the LESYMAP dataset only contains left hemisphere stroke lesions, of the 403 previously mentioned regions, only 179 present a lesion in at least one patient. We keep these regions and discard the rest. The region pairs with the highest number of subjects showing a lesion in both regions were picked. The rationale behind this is to pick the regions most susceptible to topographical bias. Indeed, in the 131 subjects, 49 had a lesion in region 100, 45 a lesion in region 101, and 41 a lesion in both. Figure2 shows the location of these regions in the brain.
We then simulate behavioural scores using a simple linear model with additive Gaussian noise.
yi= φ(Xi) + εi
where yi is the behavioural score for subject i, Xi represents the lesion status across regions for subject i, φ is a function mapping this lesion status to deficits, and εi∼ N (0, σ).
In all our experiments, σ = 1. All random variables εi are i.i.d. We use four
scenarii of simulation for behavioural scores, that are based upon real lesion-behaviour interactions documented in the literature [7]
1. Single ROI scenario : φ(X) = Xj, the jthbrain region lesion status (e.g., j
= 101), i.e. φ(X) = Xj= 1 if region j is lesioned, 0 otherwise.
2. OR scenario : φ(X) = OR(Xj, Xk), with e.g. j=100, k=101.
3. AND scenario : φ(X) = AND(Xj, Xk), with e.g. j=100, k=101.
4. Sum scenario : φ(X) = Xj+ Xk, with e.g. j=100, k=101.
Models We compare two causal models to various multivariate models. For the first causal model, we use Bayesian Additive Regression Trees (abbrevi-ated BART) [8], which is a state-of-the-art model for the estimation of average treatment effects [6]. We fit one BART model per atlas region, using the le-sion status of that region as the treatment variable, and the lele-sion status of other regions as potential confounding covariates. We then take the estimated average treatment effect output by each BART model to be the effect on the behavioural scores of lesion presence in each region. We use the bartCause R package (https://rdrr.io/github/vdorie/bartCause/) for our experiments.
The second causal model is a doubly robust AIPW model (abbreviated DR) [9], where the two response surfaces were modeled by random forests. Following the same procedure as BART, we fit one model per region, and get the average treatment effect as output from the DR model.
The multivariate models we use are :
1. Support vector regression (SVR), using the scikit-learn package
2. Desparsified LASSO [19] (DLASSO), using a custom Python implementation 3. Random forests with permutation feature importance (RF), using the scikit-learn
package
4. Random forests with Shapley additive explanations [11] (abbreviated RF+SHAP), using the SHAP package (https://github.com/slundberg/shap)
Fig. 2: Location in the brain of the two ROIs used in our simulations. Region 101 is colored red and re-gion 100 is colored blue.
Assessing model performance Each model gives a score per ROI correspond-ing to its effect on the behavioural scores. The scores are the model weights for SVR and DLASSO, average treatment effects for BART and DR, feature impor-tance for RF, and approximated Shapley values for RF+SHAP. For the models that give standard deviation estimates on their score (BART and DLASSO), we compute Z-scores using these values, and calculate precision-recall curves from the Z-scores.
For the other models, we robustly fit a Gaussian distribution to their scores (denoted (wj, j = 1 . . . p)), by taking m = median(wj) as a mean parameter, and
σ2∝ mad(w
j)2) (where mad() stands for mean absolute deviation) as variance
parameter. We then compute the following statistic Zj =wjσ−m , which we call
pseudo-Z-scores, and calculate precision-recall curves from the pseudo Z-scores. Finally, we take the area under each precision-recall curve (AUC) as a final measure of model performance. The hyperparameters of each model are opti-mized using grid search and cross-validation, and the hyperparameters which yield the best predictive performance are picked.
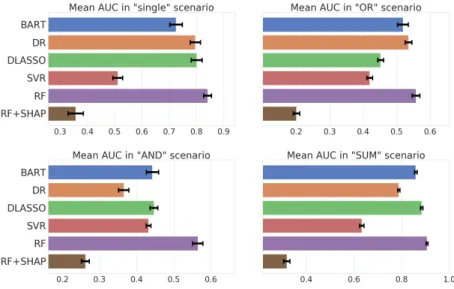
This procedure is repeated over 50 bootstrap runs to obtain figure3. We also provide results averaged over all considered region pairs in Table1.
Fig. 3: Area under the precision-recall curve for our 6 models under the four simulation scenarii. Signal to noise ratio is equal to 1. Results are averaged over 50 bootstrap runs.
BART DR DLASSO SVR RF RF+SHAP Single ROI 0.69 0.75 0.81 0.46 0.81 0.28 OR 0.50 0.53 0.50 0.34 0.53 0.17 AND 0.42 0.37 0.34 0.36 0.45 0.24 SUM 0.83 0.80 0.86 0.60 0.85 0.26
Table 1: Mean AUC for each model under each scenario, averaged across all region pairs. The winning model in each scenario is highlighted in bold.
Results The RF model performs very well across all scenarii, being either the best or very close to the best. In each scenario, we see that SVR performs worse than the other models. This is consistent with the findings of [17], and suggests that support vector regression is not a good model for inference. We also see that RF+SHAP perform poorly across all scenarii. The SHAP approximation method makes the hypothesis that model features are independent, and it is well known that it does not perform adequately when this hypothesis is violated [1]. In our case, the model features are the brain regions, which are heavily correlated because of topographical bias. Therefore the poor performance of RF+SHAP is unsurprising. It is worth noting that other approximations for Shapley values exist, but are prohibitively computationally expensive when con-sidering the size of our problem.
While the DLASSO model performs very well in the single ROI and SUM scenarii, it performed significantly worse in the AND and OR scenarii. This is because DLASSO is a linear model, and fails to accurately represent the non-linear interactions between lesions and behavioural scores in the AND and OR scenarii.
For the region pair {100, 101} displayed in Fig.3, causal models underperform in the AND scenario when compared to RF. However, this is not necessarily the case across all region pairs, as shown in the supplementary materials (see region pair {108, 114}). Both causal models (DR and BART) posit an underlying additive model, where y = f (X)+τ W +ε where τ is the causal effect and W the treatment variable (here, the lesion status of the region investigated for causal effect). However, in the AND and OR scenario, the underlying causal model is effectively y = f (X) + τ φ(W, W0) + ε, where (W, W0) represents treatments on two regions and φ is not additive, which hampers causal models.
Additionally, the strength of the confounding introduced by the presence of multiple ROIs may vary between region pairs and scenarii, and may compensate more or less well for this impairment. Overall, we notice that causal models were not always the best-performing ones. These numerical experiments suggest that multivariate models are still sufficient for lesion-behaviour mapping in the proposed framework.
5
Discussion
5.1 Outlook
Through a simple causal analysis of the lesion-behaviour mapping problem, we show that in the case where a single region affects behavioural scores, and no other clinical data is observed, there are no observed confounding variables. Therefore, traditional causal inference methods that assume no unobserved con-founders should not perform better than multivariate methods that have good inference capabilities (random forests, desparsified LASSO). We illustrate this through our experiments based on documented lesion-behaviour interactions. although confounding variables exist in the case where multiple regions affect behavioural scores, we also show empirically that appropriate multivariate meth-ods still perform adequately. As the absence of clinical data is almost always the case when working with public brain lesion datasets, appropriate multivariate methods are good enough in the cases created through standard simulations. The generalization to more complex scenarii, where non-linear combinations of several regions would cause the deficits, is an important future direction.
5.2 Future work
Causal inference with unobserved confounders Among recent developments in the causal inference literature, methods that deal with unobserved confounders and do away with the assumption of strong ignorability have been proposed. Examples include [10] and [18]. Although some of these methods are still the subject of debate [5], we believe that they could be an interesting basis for a causal approach to lesion-behaviour mapping when no other clinical data are observed, as is the case in publicly available datasets.
Causal inference with additional clinical data In the case where additional clin-ical data are available, additional confounding variables such as age might be observed. In that case, we conjecture that traditional causal inference meth-ods that make the assumption of strong ignorability would perform better than multivariate methods, as they could effectively eliminate confounding bias.
Acknowledgements
This project has received funding from the European Union’s Horizon 2020 re-search and innovation programme under grant agreement No 826421 (TVB-Cloud).
[1] Aas, K., Jullum, M., Løland, A.: Explaining individual predictions when features are dependent: More accurate approximations to shapley values (2019)
[2] Bates, E., Wilson, S., Saygin, A.P., Dick, F., Sereno, M., Knight, R., Dronkers, N.: Voxel-based lesion–symptom mapping. Nature neuroscience 6, 448–50 (06 2003).https://doi.org/10.1038/nn1050
[3] Breiman, L.: Random forests. Machine Learning 45(1), 5–32 (2001) [4] Chyzhyk, D., Varoquaux, G., Thirion, B., Milham, M.: Controlling a
con-found in predictive models with a test set minimizing its effect. pp. 1–4 (06 2018).https://doi.org/10.1109/PRNI.2018.8423961
[5] D’Amour, A.: Comment: Reflections on the deconfounder (2019), https: //arxiv.org/abs/1910.08042
[6] Dorie, V., Hill, J., Shalit, U., Scott, M., Cervone, D.: Automated ver-sus do-it-yourself methods for causal inference: Lessons learned from a data analysis competition. Statist. Sci. 34(1), 43–68 (02 2019).
https://doi.org/10.1214/18-STS667,https://doi.org/10.1214/18-STS667
[7] Godefroy, O., Duhamel, A., Leclerc, X., Saint Michel, T., H?non, H., Leys, D.: Brain-behaviour relationships. Some models and related statistical pro-cedures for the study of brain-damaged patients. Brain 121 ( Pt 8), 1545– 1556 (Aug 1998)
[8] Hill, J.: Bayesian nonparametric modeling for causal inference. Jour-nal of ComputatioJour-nal and Graphical Statistics 20, 217–240 (03 2011).
https://doi.org/10.1198/jcgs.2010.08162
[9] Kang, J.D.Y., Schafer, J.L.: Demystifying double robustness: A comparison of alternative strategies for estimating a population mean from incomplete data. Statistical Science 22(4), 523–539 (Nov 2007)
[10] Louizos, C., Shalit, U., Mooij, J.M., Sontag, D., Zemel, R., Welling, M.: Causal effect inference with deep latent-variable models. In: Guyon, I., Luxburg, U.V., Bengio, S., Wallach, H., Fergus, R., Vishwanathan, S., Gar-nett, R. (eds.) Advances in Neural Information Processing Systems 30, pp. 6446–6456. Curran Associates, Inc. (2017), http://papers.nips.cc/paper/ 7223-causal-effect-inference-with-deep-latent-variable-models.pdf
[11] Lundberg, S.M., Lee, S.I.: A unified approach to interpreting model predictions. In: Guyon, I., Luxburg, U.V., Bengio, S., Wal-lach, H., Fergus, R., Vishwanathan, S., Garnett, R. (eds.) Ad-vances in Neural Information Processing Systems 30, pp. 4765– 4774. Curran Associates, Inc. (2017), http://papers.nips.cc/paper/ 7062-a-unified-approach-to-interpreting-model-predictions.pdf
[12] Mah, Y.H., Husain, M., Rees, G., Nachev, P.: Human brain lesion-deficit inference remapped. Brain 137(Pt 9), 2522–2531 (Sep 2014)
[13] Pearl, J.: Causality: Models, Reasoning and Inference. Cambridge Univer-sity Press, USA, 2nd edn. (2009)
[14] Price, C.J., Hope, T.M., Seghier, M.L.: Ten problems and solutions when predicting individual outcome from lesion site after stroke. Neuroimage 145(Pt B), 200–208 (01 2017)
[15] Pustina, D., Avants, B., Faseyitan, O.K., Medaglia, J.D., Coslett, H.B.: Improved accuracy of lesion to symptom mapping with multivariate sparse canonical correlations. Neuropsychologia 115, 154–166 (07 2018)
[16] Smith, D.V., Clithero, J.A., Rorden, C., Karnath, H.O.: Decoding the anatomical network of spatial attention. Proceedings of the National Academy of Sciences 110(4), 1518–1523 (2013)
[17] Sperber, C.: Rethinking causality and data complexity in brain lesion-behaviour inference and its implications for lesion-lesion-behaviour modelling. Cortex 126, 49–62 (05 2020)
[18] Wang, Y., Blei, D.M.: The blessings of multiple causes. Journal of the Amer-ican Statistical Association 114(528), 1574–1596 (2019)
[19] Zhang, C.H., Zhang, S.: Confidence intervals for low-dimensional pa-rameters in high-dimensional linear models. Journal of the Royal Statistical Society: Series B (Statistical Methodology) 76 (10 2011).
https://doi.org/10.1111/rssb.12026
[20] Zhang, Y., Kimberg, D., Coslett, H., Schwartz, M., Wang, Z.: Multivari-ate lesion-symptom mapping using support vector regression. Human Brain Mapping 35 (07 2014).https://doi.org/10.1002/hbm.22590
Supplementary materials
We provide in these supplementary materials the results of our experiments on four other brain region pairs.
These region pairs are {108, 114} (figure4), {109, 114} (figure5), {79, 108} (figure 6), and {80, 108} (figure7).
Fig. 4: Location of regions 108 and 114 in the brain and results of our experi-ments on this region pair. Area under the precision-recall curve for our 6 models under the four simulation scenarii. Signal to noise ratio is equal to 1. Results are averaged over 50 bootstrap runs.
Fig. 5: Location of regions 109 and 114 in the brain and results of our experi-ments on this region pair. Area under the precision-recall curve for our 6 models under the four simulation scenarii. Signal to noise ratio is equal to 1. Results are averaged over 50 bootstrap runs.
Fig. 6: Location of regions 79 and 108 in the brain and results of our experiments on this region pair. Area under the precision-recall curve for our 6 models un-der the four simulation scenarii. Signal to noise ratio is equal to 1. Results are averaged over 50 bootstrap runs.
Fig. 7: Location of regions 80 and 108 in the brain and results of our experiments on this region pair. Area under the precision-recall curve for our 6 models un-der the four simulation scenarii. Signal to noise ratio is equal to 1. Results are averaged over 50 bootstrap runs.