HAL Id: hal-01517419
https://hal.sorbonne-universite.fr/hal-01517419
Submitted on 3 May 2017
HAL is a multi-disciplinary open access
archive for the deposit and dissemination of sci-entific research documents, whether they are pub-lished or not. The documents may come from teaching and research institutions in France or abroad, or from public or private research centers.
L’archive ouverte pluridisciplinaire HAL, est destinée au dépôt et à la diffusion de documents scientifiques de niveau recherche, publiés ou non, émanant des établissements d’enseignement et de recherche français ou étrangers, des laboratoires publics ou privés.
Crustal structure of western Hispaniola (Haiti) from a
teleseismic receiver function study
Jordane Corbeau, Frédérique Rolandone, Sylvie Leroy, K. Guerrier, D. Keir,
G. Stuart, V. Clouard, R. Gallacher, S. Ulysse, D. Boisson, et al.
To cite this version:
Jordane Corbeau, Frédérique Rolandone, Sylvie Leroy, K. Guerrier, D. Keir, et al.. Crustal structure of western Hispaniola (Haiti) from a teleseismic receiver function study. Tectonophysics, Elsevier, 2017, 709, pp.9-19. �10.1016/j.tecto.2017.04.029�. �hal-01517419�
Crustal structure of western Hispaniola (Haiti) from a
teleseismic receiver function study
Corbeau J.1,2, Rolandone F.1, Leroy S.1, Guerrier K.3, Keir D.4,5, Stuart G.6, Clouard V.2, Gallacher R.4, Ulysse S.3, Boisson D.3, Bien-aimé Momplaisir R.3, Saint Preux F.7, Prépetit
C.7, Saurel J-M.2, Mercier de Lépinay B.8 and Meyer B.1
1Sorbonne Universités, UPMC Univ Paris 06, CNRS, Institut des Sciences de la Terre de Paris (ISTeP), 4 place Jussieu, 75005 Paris, France
2Now at Observatoire Volcanologique et Sismologique de Martinique (OVSM), Institut de Physique du Globe de Paris (IPGP), UMR 7154, CNRS Sorbonne Paris Cité, Paris, France
3URGeo, Faculté des Sciences, Université d'Etat d'Haiti, Port-au-Prince, Haiti
4Ocean and Earth Science, National Oceanography Center Southampton, University of Southampton, Southampton, SO14 3ZH, UK
5 Dipartimento di Scienze della Terra, Universita degli Studi di Firenze, Florence 50121, Italy
6 Institute of Geophysics and Tectonics, School of Earth and Environment, University of Leeds, Leeds, LS2 9JT, UK
7 Bureau des Mines et de l’Energie, Unité Technique de Sismologie, Port-au-Prince, Haiti 8 Université Côte d'Azur, CNRS/IRD/OCA, Géoazur, Valbonne, France
Abstract
1
Haiti, located at the northern Caribbean plate boundary, records a geological history
2
of terrane accretion from Cretaceous island arc formations to the Eocene to Recent oblique
3
collision with the Bahamas platform. Little is presently known about the underlying crustal
4
structure of the island. We analyze P-waveforms arriving at 27 temporary broadband
5
seismic stations deployed over a distance of 200 km across the major terrane boundaries in
6
Haiti to determine the crustal structure of western Hispaniola. We compute teleseismic
7
receiver functions using the Extended-Time Multi-Taper method and determine crustal
8
thickness and bulk composition (Vp/Vs) using the H-k stacking method. Three distinctive and
9
fault-bounded crustal domains, defined by their characteristic Moho depth distributions and
10
bulk crustal Vp/Vs, are imaged across Haiti. We relate these domains to three crustal
11
terranes that have been accreted along the plate boundary during the northeastwards
12
displacement of the Caribbean plate and are presently being deformed in a localized fold
13
and thrust belt. In the northern domain, made up of volcanic arc facies, the crust has a
14
thickness of ~23 km and Vp/Vs of 1.75 +/- 0.1 typical of average continental crust. The
15
crust in the southern domain is part of the Caribbean Large Igneous Province (Caribbean
16
LIP), and is ~22 km thick with Vp/Vs of 1.80 +/- 0.03 consistent with plume-related rocks of
17
late Cretaceous age. Significantly thicker, the crust in central Haiti has values of Moho
18
depths averaging ~41 km and with Vp/Vs of 1.80 +/- 0.05. We propose that the central
19
domain is likely constructed of an island arc upper crust with fragments of dense material
20
originating from mafic lavas or LIP material. We produce a crustal profile along a N-S
21
transect across Haiti accounting for the surface geology, shallow structural history, and new
22
seismological constraints provided by variations of crustal thickness and bulk composition.
24 25
Keywords: Receivers Function, Haiti, crustal structure
26 27 1- Introduction 28 1.1- Overview 29
One of the keys to understanding the transpressive northern Caribbean plate
30
boundary and its geodynamic evolution is constraining crustal thickness and composition.
31
Several geological field studies have led to a description of the shallow structure and
32
stratigraphy of the island of Hispaniola (e.g., Mann et al., 1995; Pubellier et al., 2000). The
33
Mw 7.0 2010 Haiti earthquake prompted several geological and geophysical studies to
34
constrain the fault geometry and the crustal structure in the area of the mainshock (e.g.,
35
Douilly et al., 2013). However, our knowledge of the mid- and lower-crustal tectonics
36
remains very limited in the absence of whole crustal geophysical studies in Haiti. In
37
Dominican Republic, the eastern part of Hispaniola Island, interpretation of crustal
38
thickness from gravity data shows thick crust below the southern flank of the Dominican
39
Central Cordillera (Bowin, 1976). From April 2013 for nearly 14 months, a temporary
40
seismic network consisting of 27 stations was deployed in Haiti (Trans-Haiti project) to
41
determine its crustal thickness and bulk composition using teleseismic P-wave data. In
42
addition, we analyze seismograms from 3 permanent stations of the Canadian National
43
network (2010-2015) operated by the Bureau des Mines et de l'Energie and UTS. This paper
44
is the first one about works on temporary deployment of seismometers cross-cutting the
45
whole of the island.
The purpose of the present study is to determine crustal structure across Haiti from
47
receiver function (RF) analysis below Haiti so as to better constrain plate scale tectonic
48
evolution of the region responsible for the development of the current fold-thrust belt
49
(Mann et al., 1995; Pubellier et al., 2000; Hernaiz Huerta et al., 2007). The receiver
50
function analysis technique is an appropriate approach to image major discontinuities
51
within the crust and upper mantle from incoming teleseismic P-waveforms (e.g. Ammon,
52
1991).
53 54
1.2- Geological and tectonic setting of Haiti
55
Haiti, the western part of the Hispaniola island, is located on the Northern Caribbean
56
plate boundary, which separates the Caribbean plate from the North American plate (Fig.
57
1). Currently, the Caribbean plate moves in a east-northeast direction at about 20 mm/yr
58
relative to the North American plate (Symithe et al., 2015). As the plate boundary is
59
oriented E-W and the displacement vector of the Caribbean plate is about N70°, the area
60
undergoes oblique collision and transpression at a large restraining bend in the
strike-61
slip plate boundary. The deformation of the Northern Caribbean plate boundary in Haiti is
62
partitioned and two major E-W left-lateral strike-slip faults, the Septentrional-Oriente
63
Fault Zone (SOFZ) in the North and the Enriquillo-Plantain-Garden Fault Zone (EPGFZ) in
64
the south with both faults accommodating the strike-slip component of the displacement
65
(Fig. 1). GPS geodesy shows that compression is mainly accommodated by Miocene to
66
recent folding and thrusting in the North-Haitian thrust fault and the Massif de la Selle
67
in southern Haiti (Symithe and Calais, 2016). The Trans-Haitian fold-and-thrust belt in
68
central Haiti (Fig. 1) was active until the late Neogene (Mann et al., 1995) but does not
appear to accommodate significant shortening today.
70
The geological and geodynamical history of Haiti is complex, however, two distinct
71
domains have been identified. Haiti is part of the Cretaceous volcanic island arc constituted
72
at the boundary of the Pacific realm (Pindell et al., 2006) called the Greater Antilles arc.
73
The Greater Antilles volcanic arc was initiated by an eastward dipping subduction in Central
74
America (Pindell et al., 2012; Van der Lelij, 2013; Hastie et al., 2013). The Greater Antilles
75
arc now consists of a part of Cuba, Hispaniola and Puerto Rico islands (Mann et al., 1995).
76
This island arc constitutes two thirds of Hispaniola Island, and is mainly made up of arc
77
magmatic facies (Boisson, 1987; Escuder Viruete et al., 2006). The southern part of Haiti
78
has been interpreted to be part of the Caribbean Large Igneous Province (LIP), formed
79
during the Cretaceous on the Pacific Farallon plate, over the Galapagos hotspot (Duncan
80
and Hargraves, 1984). The LIP outcrops as a tholeitic substratum associated with Upper
81
Cretaceous sediments in the Southern Peninsula of Haiti (Calmus, 1983), and has been
82
imaged south and west of Haiti with refraction and reflection data (Leroy et al., 2000;
83
Mauffret et al., 2001; Corbeau et al., 2016a). The volcanic island arc and the LIP
84
subsequently moved north- and eastwards from their Pacific position between the North
85
and South American plates, thus partitioning the current Caribbean plate (Pindell, 2012).
86
The Greater Antilles arc became an inactive intra-oceanic arc at the end of the Upper
87
Cretaceous when it collided with the Bahamas carbonate platform (Leroy et al., 2000;
Cruz-88
Orosa et al., 2012; Iturralde-Vinent et al., 2006). Between the island arc and the LIP lies
89
the Quaternary Cul-de-Sac sedimentary basin (Fig. 1), which is bounded to the North by the
90
thrusts of the Trans-Haitian belt, also called Haiti fold and thrust belt. This belt is formed
91
of NW-SE thrusts having propagated towards the SW since the Lower Miocene (Pubellier et
al., 2000).
93 94
1.3- Previous geophysical work
95
Previous geophysical studies have placed crude constraints on crustal structure in the
96
south and in the vicinity of Haiti that help place our results in context and aid
97
interpretation.
98
A compilation of seismic refraction data acquired in the Caribbean plate shows that
99
the thickness of the crust is not uniform (Diebold et al., 1981; Mauffret and Leroy, 1997;
100
Mauffret et al., 2001). The Caribbean oceanic crust is 5-km thick in Haitian sub-basin,
101
Colombia and Venezuela basins (Fig. 1). In the middle of the Caribbean plate, the original
102
oceanic crust is underplated by ultra-mafic material (Leroy et al., 2000), forming a LIP of
103
~10 to 15 km in thickness. The Beata Ridge (Fig. 1), 20-30 km thick, is composed of oceanic
104
crust underplated by an ~15-20 km higher velocity (6 to 8 km/s) ultra-mafic magmatic
105
material and covered by a thin volcanic layer of ~2 km (basaltic with a P-wave velocity of
106
4.5 to 6 km/s). Submersible sampling along the Beata Ridge to the South of Haiti (Mauffret
107
et al., 2001) confirmed the deep origin of the underplated materials that are ultra-mafic
108
rocks such as picrites or komatiites (Revillon et al., 2000).
109
In addition, Douilly et al. (2013) provide a velocity model for the crust in the
110
southern part of Haiti, and show that the mean Vp/Vs in this area is 1.80, which is typical
111
for oceanic crust mafic rocks (Christensen, 1996). Velocity model and receiver functions
112
studies made by Moreno et al. (2002) and Gonzalez et al. (2012) show that the depth of the
113
Moho is approximately 20 km in the south of Cuba. In eastern Hispaniola, a seismic
114
refraction study shows that the Moho is at approximately 24 km depth, and reaches roughly
30 km deep in the central part of Hispaniola (Nuñez et al., 2015). The S- and Lg-wave study
116
of McNamara et al. (2012) implies that the Moho in the southwestern part of Hispaniola is
117
20.6 km depth.
118 119
2- Data and Method
120
2.1- Data
121
We use data from the 27 broadband stations of the temporary Trans-Haiti network
122
deployment (April 2013 – June 2014), spanning Haiti from North to South (Fig. 2). This
123
unique data set used SEIS-UK and iSTeP UPMC instruments that included 15 CMG-40TD and
124
12 CMG-6TD seismometers (30s natural period, 100 sps sampling rate). Additionally, we use
125
data from 3 broadband permanent stations of the Canadian National Seismic network
126
installed in Haiti after the 2010 Mw 7.0 earthquake and co-operated by the Bureau des
127
Mines et de l'Energie – UTS (Fig. 2).
128
To construct receiver functions we use seismograms from teleseismic earthquakes of
129
magnitudes Mw > 5.0, with epicentral distances between 30° and 90°. The initial data set
130
includes a total of 580 events recorded by the Trans-Haiti stations between April 2013 and
131
June 2014, and 2473 events for the Canadian stations between February 2010 and August
132
2015. The data are generally noisy, due to cultural noise sources, and a second order
133
Butterworth filter with corner frequencies of 0.03 and 2 Hz is applied to the data prior to
134
analysis. A visual quality control is subsequently performed on all the data such that only
135
seismograms that have clear direct-P arrivals are used to produce receiver functions. This
136
results in a reduced data set of 149 event records, with a range of between 2 and 13 per
137
station. A map showing the epicentral distribution of the analyzed earthquakes is given in
Fig. 3. Note that the majority of the events arrive from the south of the seismic network.
139 140
2.2- Receiver function technique
141
To image the crustal structure beneath Haiti we use the receiver function (RF)
142
method (e.g. Ammon, 1991), which is a deconvolution technique for isolating the P-to-S
143
converted phases (Ps) and associated reverberations (PpPs and PsPs + PpSs) of an incoming
144
P-waveform beneath a seismic station. The incident P-wave on the vertical component is
145
deconvolved from the radial and tangential components to remove source complexity and
146
leave a series of pulses that represent the P-to-S phase conversions (the so-called receiver
147
function).
148
Several deconvolution methods have been developed with different noise
149
stabilization processes: deconvolution in the frequency domain (Langston, 1979; Owens et
150
al., 1983; Ammon, 1991); deconvolution in the time domain by least squares estimation
151
(Abers et al., 1995); iterative deconvolution in the time domain (Gurrola et al., 1995;
152
Ligorria and Ammon, 1999) and multi-taper frequency domain cross-correlation (MTRF)
153
(Park and Levin, 2000; Helffrich, 2006). The advantage of the last method is that it works
154
on the correlated signal and mitigates against noise on the RFs. It has been recommended
155
in the case of oceanic island studies, such as the Cape Verde islands (Helffrich et al., 2010),
156
the Seychelles islands (Hammond et al., 2013), and the Canary islands (Lodge et al., 2012;
157
Martinez-Arevalo et al., 2013), and in our case we choose it for its capacity to remove
158
anthropic noise.
159
To estimate the Moho depth below the island of Haiti, we use the Extended-Time
160
Multitaper Frequency domain Cross-Correlation Receiver-Function (ETMTRF) technique of
Helffrich (2006), which is based on the MTRF method of Park and Levin (2000). The ETMTRF
162
method uses a series of short and overlapping multiple tapers which window the time series
163
across its full length, and sum the individual Fourier transformed signals to produce a RF
164
estimate.
165 166
2.3- Moho depth and Vp/Vs estimation
167
We use a receiver function stacking technique (H-к stacking) developed by Zhu and
168
Kanamori (2000) to estimate the Moho depth (H) and the bulk crust ratio Vp/Vs (к). This 169
method uses the following equations (1), (2), (3), and (4) for stacking the RFs, and gives the
170
results on a 10,000 point grid which shows the plausible range of values for H on increments
171
of 0.4 km between 10 and 50 km and к on increments of 0.004 between 1.6 and 2.0
172 (Christensen, 1996): 173 s( H , к)=
∑
j= 1 N w1rj( t1)+ w2rj(t2)− w3rj(t3) , (1) 174 t1= H[
√
1 V2s − p2−√
1 V2p − p2]
, (2) 175 t2= H[
√
1 Vs 2− p 2+√
1 Vp 2− p 2]
, (3) 176 t3= 2 H√
1 Vs2− p 2 , (4) 177where w1 , w2 , w3 are weights, rj( ti) are the amplitudes at the arrival times for each of 178
the raypaths evaluated, N is the number of receiver functions, and p is the ray
179
parameter determined from the IASPEI travel time tables (Kennet, 1991). The weights were
chosen as w1 = 0.5, w2 = 0.3 and w3 = 0.2 as suggested by Zhu and Kanamori (2000). The
181
errors in the results were calculated by taking the maximum axes of the 95% confidence
182
interval of the grid plotted using the Zhu and Kanamori (2000) stacking method. The H-к
183
stack was performed assuming a mean crustal P-wave velocity (Vp) of 6.6 km/s. This mean 184
crustal P-wave velocity comes from a study of the Pg seismic phase over Hispaniola
185
(McNamara et al., 2012). Crustal thickness, H, and average Vp/Vs determination is not very
186
sensitive to variations in the average Vp, as pointed out by Zhu and Kanamori (2000), and
187
testing Vp within the range 6.4-6.7 km/s on increments of 0.1 km/s provides very similar
188
results of H and Vp/Vs ratio.
189
Our final analysis uses the RFs computed from 149 earthquakes, from which one or
190
more reverberant Moho phases (PpPs or PpSs + PsPs) were clearly identifiable.
191 192
3- Results
193
Of the 30 stations, 27 yielded receiver functions with coherent P-to-S arrivals. Of
194
these, 19 displayed PpPs and PpSs + PsPs arrivals as well as Ps, enabling H-к analysis (Table
195
1). Examples of stacked receiver functions and H-к plots for stations PIGN, LGNH, and
196
MGOA are shown in Figure 4. For the 8 stations at which no clear reverberant phases were
197
found automatically by the program, RFs were combined to form single station stacks and
198
enhance the signal of the reverberations. At these stations, a clear Ps arrival is identifiable
199
and can be picked manually, but the H-к stacking technique cannot be performed. We can
200
still however estimate the Moho depth using equation (2) and by assuming a Vp/Vs ratio
201
after several tests. Final Vp/Vs ratios chosen are the values providing arrival times for the
202
PpPs and PpSS + PsPs reverberations that match the signal stacks, and which are coherent
with the Vp/Vs of the surrounding stations (Table 2).
204
The results show large but systematic variations in Moho depth and Vp/Vs ratio 205
throughout Haiti (Figures 5 and 6). The Moho depths can be split into three main groups
206
shown in Fig. 5 and based on location and values (in latitudinal order GGIL, MEND, STRA,
207
PIGN and CAYH in the northern part of Haiti; BOIS, DROU, GADC, THOM, CANG, DUFF, MIRB,
208
ARCH, GIMB, BMCA, CBOQ, BMES, PAPH and LGNH in the central part, and MGOA, PETG,
209
GRBO, JAKH, JACM, FERM, FURC, and MARG in the southern part of Haiti).
210 211
3.1- Moho depths in Haiti
212
Results from the H-K stacking method in the northern domain of Haiti are well
213
resolved, with the stations STRA, PIGN and CAYH particularly well constrained. Results are
214
also consistent across this domain giving Moho depths of between 20.1 km and 28.2 km
215
(Table 1, Fig. 5).
216
Results in the southern part of Haiti are also well resolved, with the stations MGOA,
217
JACM and PETG particularly well constrained. Results across the domain give Moho depths
218
ranging between 16.1 km and 29.8 km, increasing in the center of the area at the stations
219
GRBO, MARG, FURC (Table 1, Fig. 5). The stations MARG and JAKH have clearly identifiable
220
Ps arrivals, but due to the lack of observable multiples the H-K stacking technique cannot
221
be performed. However, we can still estimate the depth of the Moho by using equation (2)
222
(Table 2, Fig. 5).
223
Our results show that the central part of Haiti exhibits greater Moho depths than in
224
the northern and southern parts, with a Moho discontinuity always deeper than 30 km. The
225
RFs of the stations located in this part of Haiti are more complicated due to intracrustal
reverberations, probably due to sediments layers. However, consistent values are found for
227
the stations THOM, CANG, DUFF, BMCA, CBOQ, DROU, LGNH and BOIS with Moho depths
228
ranging between 34.6 km and 45.2 km (Table 1, Fig. 5). We estimate the Moho depth for
229
the stations GADC, MIRB, GIMB, BMES, ARCH, and PAPH by assuming a Vp/Vs ratio from the
230
closest stations (Table 2, Fig. 5). Transect A in Fig. 7 shows the abrupt change in Moho
231
depth of ~10 km between the southern part and the central part of Haiti.
232 233
3.2- Vp/Vs ratio
234
The average crustal Vp/Vs ratio is sensitive to the bulk composition of the crust
235
(Zandt and Ammon, 1995; Chevrot and Van der Hilst, 2000, Stuart et al., 2006). Mineralogy
236
is an important factor influencing Vp/Vs ratio (Christensen, 1996): For felsic quartz-rich
237
rocks, such as granite, Vp/Vs ratio is ~1.71; for intermediate rocks, such as diorite, Vp/Vs
238
ratio is typically ~1.78; and for mafic rocks, such as gabbro Vp/Vs ratio is ~1.87. Higher
239
values of Vp/Vs ratio are associated with the presence of partial melting or fluids
240
(Watanabe, 1993; Thompson et al., 2010).
241
The Vp/Vs ratio over Haiti ranges from 1.64 to 1.99 (Fig. 6) suggesting a wide range
242
of mineral composition lateral variation. In particular, the stations MEND, CANG, BMCA and
243
LGNH show particularly high Vp/Vs ratios of 1.94, 1.99, 1.98 and 1.96 respectively (Fig. 6).
244
We observe that these stations are located on or near major tectonic features (Fig. 2), and
245
therefore fluid migration along active faults could feasibly locally increase the Vp/Vs ratio.
246
In order to interpret regional variations in crustal structure and since the interstation
247
variability is relatively high, we calculate the mean Vp/Vs ratio for each of the 3 domains
248
identified in Fig. 5, excluding the four very high values. Regional averages of Vp/Vs seem to
provide more insights than single-station values, excepting for particularly high values that
250
could show fluid migration (Rossi et al., 2006). The mean Vp/Vs ratio is 1.75 ± 0.10 in the
251
northern part of Haiti, 1.80 ± 0.05 in the central part, and 1.80 ± 0.03 in the southern part.
252 253
3.3- Shallow discontinuity
254
In addition to P to S Moho converted phases, one station, CAYH, exhibits another
255
clear shallow discontinuity. The RF plot for station CAYH versus back-azimuth (top of Fig. 8)
256
shows a shallow discontinuity in the first 2 s of the signal, prior to the Ps arrival from the
257
Moho. Clear Moho Ps arrivals are obvious just after 2 s, and are easily identified in the
258
upper RFs (group a, Fig. 8), coming from the south (back-azimuths between 176° and 178°,
259
Fig. 8). The H-K stack method for this group gives a Moho depth of 22.1 km, which is
260
consistent with the closest station PIGN (Fig. 5 and Table 1), and a Vp/Vs ratio of 1.64. We
261
estimate the depth of the shallow discontinuity easily visible in the RFs of the group b
262
assuming that the upper crust has an average Vp of 5.8 km/s and an average Vp/Vs ratio of
263
1.77. These average properties are derived from the P velocity model in Haiti of Douilly et
264
al. (2013). This discontinuity is thus estimated at ~9.7 km depth.
265 266
4- Discussion
267
4.1- Identification of 3 distinct crustal domains
268
The depth distribution of the Moho in Haiti shows 3 distinct regions that we relate to
269
3 distinct geological domains (Fig. 9).
270
The Southern Peninsula of Hispaniola (Fig. 9) is known to be a part of the Caribbean
271
LIP, and to be composed of Cretaceous tholeitic material (Calmus, 1983; Bien-Aimé
Momplaisir, 1986). In this part of the island, the Moho depths from our study vary from 16.1
273
km to 29.8 km along a W-E profile (Fig. 7E) and from 20.5 km to 27.5 km along a N-S profile
274
(Fig. 7A), giving an average crustal thickness of 22 ± 5 km. The variability of the Moho
275
depths we image in the Southern Peninsula may reflect the large differences in the LIP
276
thickness identified in previous studies between the oceanic crust and the areas with more
277
or less of underplated material (Diebold et al., 1981; Mauffret and Leroy, 1997; Leroy et
278
al., 2000; Mauffret et al., 2001). In our results the mean Vp/Vs ratio is 1.80 ± 0.03,
279
consistent with previous studies (Douilly et al., 2013) and the geology of the Southern
280
Peninsula (Calmus, 1983; Bien-Aimé Momplaisir, 1986). The northern limit of the LIP crustal
281
domain is given by the Moho depth calculated at the station LGNH (34.6 km; Fig. 5) and
282
could correspond to the trace of the EPGFZ (Fig. 2) in this area (south of LGNH), as
283
suggested by previous studies (Saint-Fleur et al., 2015).
284
The northern part of Hispaniola (Fig 9) is known to be a part of the Great Arc of the
285
Caribbean (Burke, 1988), an inactive intra-oceanic island arc formed in the Cretaceous at
286
the boundary of the Pacific domain and the proto-Caribbean oceanic crust (Pindell et al.,
287
2006). The Moho depth values we compute are ranging between 20.1 km and 28.2 km,
288
providing an average crustal thickness of 23 ± 3 km in agreement with the values found in
289
southern Cuba (approximately 20 km, Moreno et al., 2002; Gonzalez et al., 2012) and
290
eastern Hispaniola (about 24 km, Nuñez et al., 2015). Furthermore, our results delineate
291
the southwestern limit of the island arc domain. The shift of the Moho depths, from 22.1
292
km (CAYH) to 36.4 km (GADC), occurs across the trace of a major thrust evidenced by
293
geological studies (Figs 5 and 9). Both this major thrust and the sharp offset of the Moho
294
depths outline a distinct crustal domain to the west and south of this feature.
In addition to the southern and northern domains discussed above, we identify a
296
central domain distinct from both the LIP in the South and the island arc in the North (Fig.
297
9), which is characterized by a thicker crust ranging from 32.3 km to 45.4 km, with an
298
average of 41 ± 4 km. The relatively deep Moho is well constrained by 13 stations. In
299
addition, the preliminary results of a recent seismic refraction study by Nuñez et al. (2015)
300
indicate that the thickness of the crust increases from eastern Hispaniola towards the west
301
reaching a value of ~40 km at the boundary between Haiti and the Dominican Republic near
302
our profile. The Cul-de-Sac sedimentary basin (Fig. 1) and the Trans-Haitian belt belong to
303
the same thick domain, where the nature of the crust below these superficial structures has
304
still to be determined. We further discuss the different hypothesis regarding the nature of
305
the crust of this domain.
306 307
4.2 Vp/Vs ratio
308
We find very high Vp/Vs ratios, between 1.94 and 1.99 at four stations, located near
309
major faults: LGNH near the strike-slip EPGFZ and MEND, CANG and BMCA near the main
310
thrust faults (Figs. 2 and 6). High Vp/Vs ratios are often associated with partial melt,
311
basaltic intrusions or the presence of fluids (Stuart et al, 2006; Hammond et al., 2011). We
312
favor an explanation whereby the high Vp/Vs ratios associated with major crustal faults are
313
related to the presence of fluids within the fault zones (Thurber et al., 2003; Zhao et al.,
314
1996). Nevertheless, all the stations located near major faults do not present high Vp/Vs
315
values (e.g. CAYH, fig. 2).
316
The mean Vp/Vs ratio (1.80 ± 0.03) found in the southern domain is in agreement
317
with its late Cretaceous oceanic plateau origin (Christensen, 1996; Douilly et al., 2013). In
the northern domain composed of a late Cretaceous-Eocene, intra-oceanic volcanic arc
319
and forearc-accretionary prism, the Vp/Vs ratio of 1.75 ± 0.10 is close to that expected
320
for the average continental crust, 1.768 (Christensen, 1996). The central part of Haiti is
321
characterized by Vp/Vs ratio of 1.80 ± 0.05, indicating that mafic rocks may be part of the
322
crustal lithology of this domain as in the southern domain.
323 324
4.3- Implications for the tectonic history of Hispaniola
325
We identify three distinct tectonic domains with different crustal thickness and bulk
326
composition. Based on our computed Moho depths and Vp/Vs ratios, and with additional
327
constraints from the major thrusts identified at the surface and the geodynamic
328
reconstructions (Leroy et al., 2000; Pubellier et al., 2000; Calais et al., 2016), we propose a
329
geological model along a N-S profile across Haiti (Fig. 10). This transect shows the LIP in the
330
South, the Cretaceous volcanic arc in the North, and a central thicker domain.
331
The central domain is characterized by relatively thick crust of ~41 km, between two
332
domains with significantly thinner crusts of 20-30 km. Surprisingly, the thick crust of the
333
central domain is not associated with major relief (~1 km). Based on field studies and
334
geodynamic reconstructions proposed for this area (e.g. Stéphan et al., 1990; Meschede and
335
Frisch,1998; Mann et al 1991; Calais et al., 2016), the nature of the crust of the central
336
domain is likely to be island arc and fore-arc type, considered as either back-arc (Mann and
337
Lawrence, 1991) or a Cretaceous-Eocene remnant arc (Heubeck et al., 1991). Other
338
stratigraphic and tectonic studies (e.g. Pubellier et al., 2000) suggest that the
fold-and-339
thrust belt of this crustal domain may be rooted on the continuation of the rifted crust of
340
the eastern Cayman continental passive margin (Fig. 9). However, Vp/Vs ratio of 1.80,
typical for mafic rocks (average of values for this domain; Tables 1 & 2), may indicate that
342
the central crustal domain could not be composed only of island arc crust, and may imply
343
the presence of dense material. This dense material could be either related to
Pliocene-344
Quaternary mafic center of volcanism coming from an ancient continental mantle
345
lithosphere fragment (Kamenov et al., 2011) or associated to LIP material fragment coming
346
from the south and both trapped early in central Haiti. Geochemical studies of the LIP
347
south of Hispaniola from submersible dive samples (Revillon et al., 2000; Mauffret et al.,
348
2001) show indeed that the lower part of the LIP is made of ultra-mafic rocks and
349
geophysical studies (Mauffret and Leroy, 1997; 1999) evidence a high velocity layer
350
composed of dense material (velocity 7.5 to 7.9 km/s; density of 3 to 3.1; Herzberg et al.,
351
1983). The mafic Quaternary rocks are also MgO-rich (Kamenov et al 2011) and give high
352
Vp/Vs ratio.
353
On the transect in Fig. 10 we also draw the intracrustal discontinuity determined
354
from our receiver functions at the station CAYH. The estimated depth of this intracrustal
355
discontinuity (~10 km) may provide information on the possible depth for the
Late-356
Cretaceous to Pleistocene flysch of the Peralta belt (Witschard and Dolan, 1990; Dolan et
357
al., 1991), which outcrops at the front of the Cretaceous volcanic arc (Fig. 10). At the
358
surface, three major thrusts are geologically mapped (the Montagnes Noires, the Chaîne des
359
Matheux and the Gonâve Island; Fig. 1 and 2; Mann et al., 1995; Pubellier et al., 2000;
360
Hernaiz Huerta et al., 2007). In our transect, we propose to extend these thrusts to greater
361
depth along three large crustal slices (Fig. 10). The three major thrusts of the Trans-Haitian
362
belt show small cumulative throws at outcrop and little evidence of strong compressional
363
tectonics (Mann et al 1995; Pubellier et al 2000, Corbeau et al., 2016b). SW-vergent fold
and thrust belt related to the Hispaniola restraining bend and back arc basin collapse
365
(Heubeck et al., 1991) could have contributed to the overall thickening.
366 367
5- Conclusions
368
A receiver function study of 23 stations is used to determine the crustal structure
369
across Haiti, in order to place better constraints on the history and geometry of late
370
Cretaceous to recent terrane accretion. In the northern part of Haiti, consisting of the
371
Cretaceous volcanic island arc and forearc of the Greater Antilles, the Moho discontinuity is
372
imaged at a depth of ~23 km with Vp/Vs ratio of 1.75. In the southern part of Haiti, made
373
of the folded and thrusted Cretaceous oceanic Large Igneous Province (LIP), the Moho
374
depth is imaged at ~22 km, and Vp/Vs ratio is 1.80. In the central part of Haiti,
375
encompassing the Haitian fold-and-thrust belt, the Moho discontinuity is deeper with a
376
mean depth of ~41 km. We propose that this unexpected thick central domain with Vp/Vs
377
ratio of 1.80 corresponds to a distinct crustal domain. This domain is likely to consist of
378
island-arc type crust related to the Great Arc of the Caribbean, or the proximal part of the
379
Cayman Trough eastern passive margin, associated with mafic material coming from
380
fragments of lithospheric mantle from the north or mafic LIP material from the south.
381 382 383 384 385 Acknowledgements 386
The seismological equipment was loaned from the SEIS-UK equipment pool and from the
387
ISTeP facilities. The facilities of SEIS-UK are supported by the Natural Environment
Research Council (NERC) under Agreement R8/H10/64. DK time on the research is funded
389
by NERC grant NE/L013932/1. This work could not have been done without Gérard Laborde
390
and DIGICEL, and without our collaboration with the Bureau des Mines et de l’Energie and
391
the Université d’Etat d’Haiti in Haiti. The paper benefits from fruitful discussions with
392
Nicolas Bellahsen and Claudio Rosenberg. We thank the Editor, the reviewer David
393
Schlaphorst and an anonymous reviewer for their constructive comments that helped
394
improved the manuscript.
References
396
Abers, G. A., X. Hu and L. R. Sykes, 1995. Source scaling of earthquakes in the Shumagin
397
region, Alaska : time-domain inversions of regional waveforms. Geophysical Journal
398
International, vol. 123, no 1, p. 41–58.
399 400
Ammon, C. J., 1991. The isolation of receiver effects from teleseismic P waveforms. Bull.
401
Seismol. Soc. Am, vol. 81, no 6, p. 2504–2510.
402 403
Bien-Aimé Momplaisir, R., 1986. Contribution à l’étude géologique de la partie orientale du
404
Massif de la Hotte (Presqu’île du Sud d’Haïti) : Synthèse structurale des marges de la
405
presqu’île à partir de données sismiques, thèse de doctorat, Ph. D. thesis, 210 pp., Univ.
406
Pierre-et-Marie-Curie (Paris VI), Paris.
407 408
Boisson, D., 1987. Etude geologique du massif du nord d’Haiti (Hispaniola-grandes Antilles),
409
thèse de doctorat, Ph. D. thesis, Univ. Pierre et Marie Curie (Paris VI), Paris.
410 411
Bowin, C.O, 1976. Caribbean Gravity Field and Plate Tectonics, Geological Society of
412
America Special Paper, vol. 169.
413 414
Burke, K.,1988. Tectonic evolution of the Caribbean, Annual Review of Earth and Planetary
415
Sciences, vol. 16, p. 201-230.
416 417
Calais, E. and B. Mercier de Lepinay, 1991. From transtension to transpression along the
418
northern Caribbean plate boundary off Cuba : Implications for the recent motion of the
419
Caribbean plate, Tectonophysics, vol. 186, no 3, p. 329–350.
420 421
Calais, E., S. Symithe, B. Mercier de Lépinay and C. Prépetit, 2016. Plate boundary
422
segmentation in the northeastern Caribbean from geodetic measurements and Neogene
423
geological observations, Comptes Rendus Geoscience, 348(1), 42-51.
424 425
Calmus, T., 1983. Contribution à l’étude géologique du massif de Macaya(sud-ouest d’Haïti,
426
Grandes Antilles) : sa place dans l’évolution de l’orogène Nord-Caraïbe, thèse de doctorat,
427
Univ. Paris VI, Paris.
428 429
Chevrot, S. and R. D. van der Hilst, 2000. The poisson ratio of the australian crust :
430
geological and geophysical implications, Earth and Planetary Science Letters, vol. 183, no
431
1, p. 121–132.
432 433
Christensen, N. I., 1996. Poisson’s ratio and crustal seismology, Journal of Geophysical
434
Research: Solid Earth (1978–2012), vol. 101, no B2, p. 3139–3156.
435 436
Corbeau, J., F. Rolandone, S. Leroy, B. Mercier de Lépinay, B. Meyer, N. Ellouz-
437
Zimmermann and R. Momplaisir, 2016a. The Northern Caribbean plate boundary in the
438
Jamaica Passage: structure and seismic stratigraphy, Tectonophysics,
439
doi:10.1016/j.tecto.2016.03.022.
Corbeau, J., F. Rolandone, S. Leroy, B. Meyer, B. Mercier de Lépinay, N. Ellouz-
441
Zimmermann and R. Momplaisir, 2016b. How transpressive is the Northern Caribbean plate
442
boundary ?, Tectonics, doi:10.1002/2015TC003996.
443 444
Cruz-Orosa, I., F. Sàbat, E. Ramos, L. Rivero and Y. M. Vázquez-Taset, 2012. Structural
445
evolution of the La Trocha fault zone : Oblique collision and strike-slip basins in the Cuban
446
Orogen, Tectonics, vol. 31, no 5.
447 448
Diebold, J., P. Stoffa, P. Buhl and M. Truchan, 1981. Venezuela Basin crustal structure,
449
Journal of Geophysical Research : Solid Earth (1978–2012), vol. 86, no B9, p. 7901–7923.
450 451
Dolan, J., P. Mann, R. de Zoeten, C. Heubeck, J. Shiroma and S. Monechi, 1991.
452
Sedimentologic, stratigraphic, and tectonic synthesis of Eocene-Miocene sedimentary
453
basins, Hispaniola and Puerto Rico, Geological Society of America Special Papers, vol. 262,
454
p.217–264.
455 456
Douilly, R., J. S. Haase, W. L. Ellsworth, M.-P. Bouin, E. Calais, S. J. Symithe, J. G.
457
Armbruster, B. Mercier de Lépinay, A. Deschamps, S.-L. Mildor and collab., 2013. Crustal
458
Structure and Fault Geometry of the 2010 Haiti Earthquake from Temporary Seismometer
459
Deployments, Bulletin of the Seismological Society of America, vol. 103, no 4, p. 2305–
460
2325.
461 462
Duncan, R. and R. Hargraves, 1984. Plate tectonic evolution of the Caribbean region in the
463
mantle reference frame, Geological Society of America Memoirs, vol. 162, p. 81–94.
464 465
Escuder Viruete, J., Contreras F., Stein, G., Urien, P., Joubert, M., Ullrich, T.D.,
466
Mortensen, J., Perez Estaun, A., 2006. Transpression and strike-slip partitioning in the
467
Caribbean island arc: fabric development, kinematics and Ar-Ar ages of syntectonic
468
emplacement of the Loma de Cabrera batholith, Dominican Republic, Journal of Structural
469
Geology, 28, 1496-1519.
470 471
González, O., B. Moreno, F. Romanelli and G. F. Panza, 2012. Lithospheric structure below
472
seismic stations in Cuba from the joint inversion of Rayleigh surface waves dispersion and
473
receiver functions, Geophysical Journal International, vol. 189, p. 1047–1059.
474 475
Granja-Bruña, J., A. Carbó-Gorosabel, P. L. Estrada, A. Muñoz-Martín, U. ten Brink, M. G.
476
Ballesteros, M. Druet and A. Pazos, 2014. Morphostructure at the junction between the
477
Beata ridge and the Greater Antilles island arc (offshore Hispaniola southern slope),
478
Tectonophysics, vol. 618, p. 138–163.
479 480
Gurrola, H., G. E. Baker and J. B. Minster, 1995. Simultaneous time-domain deconvolution
481
with application to the computation of receiver functions, Geophysical Journal
482
International, vol. 120, no 3, p. 537–543.
483 484 485
Hammond, J., J.-M. Kendall, G. Stuart, D. Keir, C. Ebinger, A. Ayele and M. Belachew,
486
2011. The nature of the crust beneath the Afar triple junction : Evidence from receiver
487
functions, Geochemistry, Geophysics, Geosystems, vol. 12, no 12.
488 489
Hammond, J., J.-M. Kendall, G. Stuart, C. Ebinger, I. Bastow, D. Keir, A. Ayele, M.
490
Belachew, B. Goitom, G. Ogubazghi and collab., 2013. Mantle upwelling and initiation of
491
rift segmentation beneath the Afar Depression, Geology, vol. 41, no 6, p. 635–638.
492 493
Hastie, A. R., S. F. Mitchell, P. J. Treloar, A. C. Kerr, I. Neill and D. N. Barfod, 2013.
494
Geochemical components in a Cretaceous island arc : The Th/La-(Ce/Ce*)Nd diagram and
495
implications for subduction initiation in the inter-American region, Lithos, vol. 162, p. 57–
496
69.
497 498
Helffrich, G., 2006. Extended-time multitaper frequency domain cross-correlation
receiver-499
function estimation, Bulletin of the Seismological Society of America, vol. 96, no 1, p. 344–
500
347.
501 502
Helffrich, G., B. Faria, J. F. Fonseca, A. Lodge and S. Kaneshima, 2010. Transition zone
503
structure under a stationary hot spot: Cape Verde, Earth and Planetary Science Letters,
504
vol. 289, no 1, p. 156–161.
505 506
Hernaiz Huerta, P.P., Diaz de Neira, J.A., Garcia Senz, J. Deschamps, I., Genna, A., Nicole,
507
N., Lopera, E., Escuder Virruete, J., Ardevol Oro, Ll., Perez Estaun, A., 2007. La estructura
508
del suroeste de la Republica Dominicana: un ejemplo de deformacion en regimen
509
transpresivo, Boletin Geologico y Minero, 118(2) : 337-358.
510 511
Herzberg, C., W. Fyfe and M. Carr, 1983. Density constraints on the formation of the
512
continental Moho and crust, Contributions to Mineralogy and Petrology, vol. 84, no 1, p. 1–
513
5.
514 515
Heubeck, C., P. Mann, J. Dolan and S. Monechi, 1991. Diachronous uplift and recycling of
516
sedimentary basins during cenozoic tectonic transpression, northeastern caribbean plate
517
margin, Sedimentary geology, vol. 70, no 1, p. 1–32.
518 519
Iturralde-Vinent, M. A., 2006. Meso-Cenozoic Caribbean paleogeography : implications for
520
the historical biogeography of the region, International Geology Review, vol. 48, no 9, p.
521
791–827.
522 523
Kamenov, G. D. et al., 2011. Ancient lithospheric source for Quaternary lavas in Hispaniola.
524
Nature Geoscience, vol. 4, p. 554–557.
525 526
Kennet, B., 1991. IASPEI 1991 seismological tables, Terra Nova, vol. 3, no 2, p. 122–122.
527 528
Langston, C. A., 1979. Structure under Mount Rainier, Washington, inferred from
529
teleseismic body waves, Journal of Geophysical Research : Solid Earth (1978–2012), vol. 84,
530
no B9, p. 4749–4762.
Leroy, S., B. Mercier de Lépinay, A. Mauffret and M. Pubellier, 1996. Structural and
532
tectonic evolution of the eastern Cayman Trough (Caribbean Sea) from seismic reflection
533
data, AAPG bulletin, vol. 80, no 2, p. 222–247.
534 535
Leroy, S., A. Mauffret, P. Patriat and B. Mercier de Lépinay, 2000. An alternative
536
interpretation of the Cayman trough evolution from a reidentification of magnetic
537
anomalies, Geophysical Journal International, vol. 141, no 3, p. 539–557.
538 539
Leroy, S., N. Ellouz-Zimmermann, J. Corbeau, F. Rolandone, B. Mercier de Lépinay, B.
540
Meyer, R. Momplaisir, J. L. Granja Bruna, A. Battani, C. Baurion, E. Burov and collab.,
541
2015. Segmentation and kinematics of the North America-Caribbean plate boundary
542
offshore Hispaniola, Terra Nova.
543 544
Ligorría, J. P. and C. J. Ammon, 1999. Iterative deconvolution and receiver-function
545
estimation, Bulletin of the seismological Society of America, vol. 89, no 5, p. 1395–1400.
546 547
Lodge, A., S. Nippress, A. Rietbrock, A. García-Yeguas and J. Ibáñez, 2012. Evidence for
548
magmatic underplating and partial melt beneath the canary islands derived using
549
teleseismic receiver functions, Physics of the Earth and Planetary Interiors, vol. 212, p. 44–
550
54.
551 552
Mauffret, A. and S. Leroy, 1997. Seismic stratigraphy and structure of the Caribbean
553
igneous province, Tectonophysics, vol. 283, no 1, p. 61–104.
554 555
Mauffret, A., Leroy, S., 1999. Neogene intraplate deformation of the Caribbean plate at the
556
Beata Ridge. Sedimentary Basins of the World 4, 627–669.
557 558
Mauffret, A., S. Leroy, É. d’Acremont, A. Maillard, B. Mercier de Lépinay, A. T. Dos Reis, N.
559
Miller, A. Nercessian, R. Pérez-Vega and D. Perez, 2001. Une coupe de la province
560
volcanique Caraïbe : premiers résultats de la campagne sismique Casis 2, Comptes Rendus
561
de l’Académie des Sciences-Series IIA-Earth and Planetary Science, vol. 333, no 10, p. 659–
562
667.
563 564
Mann, P., G. Draper and J. F. Lewis, 1991. An overview of the geologic and tectonic
565
development of Hispaniola, Geological Society of America Special Papers, vol. 262, p. 1–28.
566 567
Mann, P. and S. Lawrence, 1991. Petroleum potential of southern Hispaniola, Journal of
568
Petroleum Geology, vol. 14, no 2, p. 291–308.
569 570
Mann, P., F. Taylor, R. L. Edwards and T.-L. Ku, 1995. Actively evolving microplate
571
formation by oblique collision and sideways motion along strike-slip faults : An example
572
from the northeastern Caribbean plate margin, Tectonophysics, vol. 246, no 1, p. 1–69.
573 574
Martinez-Arevalo, C., F. de Lis Mancilla, G. Helffrich and A. Garcia, 2013. Seismic evidence
575
of a regional sublithospheric low velocity layer beneath the Canary islands, Tectonophysics,
vol. 608, p. 586–599.
577 578 579
McNamara, D., M. Meremonte, J. Maharrey, S.-L. Mildore, J. Altidore, D. Anglade, S.
580
Hough, D. Given, H. Benz, L. Gee and collab., 2012. Frequency-dependent seismic
581
attenuation within the Hispaniola Island region of the Caribbean Sea, Bulletin of the
582
Seismological Society of America, vol. 102, no 2, p. 773–782.
583 584
Meschede, M. and W. Frisch, 1998. A plate-tectonic model for the Mesozoic and Early
585
Cenozoic history of the Caribbean plate, Tectonophysics, vol. 296, no 3, p. 269–291.
586 587
Moreno, B., M. Grandison and K. Atakan, 2002. Crustal velocity model along the southern
588
Cuban margin : implications for the tectonic regime at an active plate boundary,
589
Geophysical Journal International, vol. 151, no 2, p. 632–645.
590 591
Nuñez, D., D. Cordoba, F. J. Nuñez-Cornu and M. O. Cotilla, 2015. Lithosphere structure
592
from Cordillera Central to Cordillera Oriental (Dominican Republic), EGU General Assembly
593
Conference Abstracts, vol. 17, p. 14467.
594 595
Owens, T., S. Taylor and G. Zandt, 1983. Isolation and enhancement of the response of
596
local seismic structure from teleseismic P-waveforms, cahier de recherche, Lawrence
597
Livermore National Lab., CA (USA).
598 599
Park, J. and V. Levin, 2000. Receiver functions from multiple-taper spectral correlation
600
estimates, Bulletin of the Seismological Society of America, vol. 90, no 6, p. 1507–1520.
601 602
Pindell, J., L. Kennan, K. P. Stanek, W. Maresch and G. Draper, 2006. Foundations of Gulf
603
of Mexico and Caribbean evolution: eight controversies resolved, Geologica Acta, vol. 4, no
604
1-2, p. 303.
605 606
Pindell, J., W. V. Maresch, U. Martens and K. Stanek, 2012. The Greater Antillean Arc :
607
Early Cretaceous origin and proposed relationship to Central American subduction mélanges
608
: implications for models of Caribbean evolution, International Geology Review, vol. 54, no
609
2, p. 131–143.
610 611
Pubellier, M., A. Mauffret, S. Leroy, J. M. Vila and H. Amilcar. 2000, «Plate boundary
612
readjustment in oblique convergence : Example of the Neogene of Hispaniola, Greater
613
Antilles», Tectonics, vol. 19, no 4, p. 630–648.
614 615
Revillon, S., E. Hallot, N. Arndt, C. Chauvel and R. Duncan, 2000. A complex history for the
616
Caribbean Plateau: petrology, geochemistry, and geochronology of the Beata Ridge, South
617
Hispaniola, The Journal of Geology, vol. 108, no 6, p. 641–661.
618 619
Rossi, G., Abers, G. A., Rondenay, S., & Christensen, D. H., 2006. Unusual mantle Poisson's
620
ratio, subduction, and crustal structure in central Alaska, Journal of Geophysical Research:
621
Solid Earth, vol. 111, no B9.
623 624 625
Saint Fleur, N., N. Feuillet, R. Grandin, E. Jacques, J. Weil-Accardo and Y. Klinger, 2015.
626
Seismotectonics of southern Haiti: A new faulting model for the 12 january 2010 M7
627
earthquake, Geophysical Research Letters.
628 629
Symithe, S. and E. Calais, 2016. Present-day shortening in Southern Haiti from GPS
630
measurements and implications for seismic hazard, Tectonophysics, 679, 117-124.
631 632
Symithe, S., E. Calais, J. B. Chabalier, R. Robertson and M. Higgins, 2015. Current block
633
motions and strain accumulation on active faults in the Caribbean, Journal of Geophysical
634
Research: Solid Earth, 120(5), 3748-3774.
635 636
Stéphan, J.-F., B. Mercier de Lépinay, E. Calais and M. Tardy, 1990. Paleogeodynamic maps
637
of the Caribbean: 14 steps from Lias to Present, Bull. Soc. géol. Ft, p. 0–6.
638 639
Stuart, G., I. Bastow and C. Ebinger, 2006. Crustal structure of the northern Main Ethiopian
640
Rift from receiver function studies, Geological Society, London, Special Publications, vol.
641
259, no 1, p. 253–267.
642 643
Thompson, D., I. Bastow, G. Helffrich, J. Kendall, J. Wookey, D. Snyder, and D. Eaton,
644
2010. Precambrian crustal evolution: Seismic constraints from the Canadian Shield, Earth
645
Planet. Sci. Lett., 297, 655–666, doi:10.1016/j.epsl.2010.07.021.
646 647
Thurber, C., S. Roecker, K. Roberts, M. Gold, L. Powell and K. Rittger, 2003. Earthquake
648
locations and three-dimensional fault zone structure along the creeping section of the San
649
Andreas fault near Parkfield, CA : Preparing for SAFOD, Geophysical Research Letters, vol.
650
30, no 3.
651 652
VanDerLelij, R., 2013. Reconstructing north-western Gondwana with implications for the
653
evolution of the Iapetus and Rheic Oceans: a geochronological, thermochronological and
654
geochemical study, thèse de doctorat, University of Geneva.
655 656
Watanabe, T., 1993. Effects of water and melt on seismic velocities and their application to
657
characterization of seismic reflectors, Geophysical Research Letters, vol. 20, no 24, p.
658
2933–2936.
659 660
Witschard, M. and J. F. Dolan, 1990. Contrasting structural styles in siliciclastic and
661
carbonate rocks of an offscraped sequence: The Peralta accretionary prism, Hispaniola,
662
Geological Society of America Bulletin, vol. 102, no 6, p. 792–806.
663 664
Zandt, G. and C. J. Ammon, 1995. Continental crust composition constrained by
665
measurements of crustal Poisson’s ratio, Nature, vol. 374, no 6518, p. 152–154.
666 667
Zhao, D., H. Kanamori, H. Negishi and D. Wiens, 1996. Tomography of the source area of
668
the 1995 kobe earthquake : evidence for fluids at the hypocenter ?, Science, vol. 274, no
669
5294, p. 1891–1894.
670
Zhu, L. and H. Kanamori, 2000. Moho depth variation in southern California from
671
teleseismic receiver functions, Journal of Geophysical Research B, vol. 105, no B2, p. 2969–
672
2980.
674
Figure 1: Tectonic map of the Northern Caribbean plate boundary. Faults are from previous
675
studies (Calais and Mercier de Lépinay, 1991; Mann et al., 1995; Leroy et al., 1996; 2015;
676
Granja Bruna et al., 2014). NHF: North-Hispaniola Fault; SOFZ: Septentrional-Oriente Fault
677
Zone; EPGFZ: Enriquillo-Plantain-Garden Fault Zone.
678 679
680
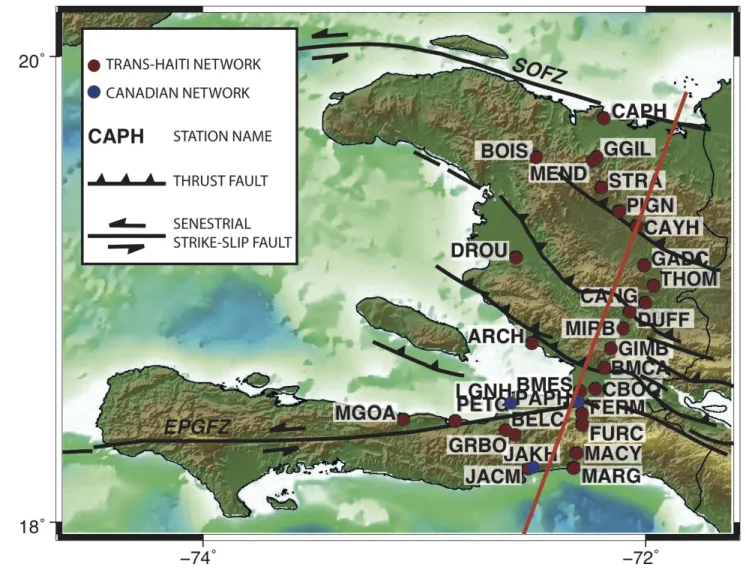
Figure 2: Locations of the seismic stations used in this receiver function study in Haiti,
681
superimposed on the topographic map and with the major tectonic features. Red circles are
682
the stations of the Trans-Haiti network and blue circles are the 3 permanent stations of the
683
Canadian National Network. Faults are from Pubellier et al. (2000). SOFZ:
Septentrional-684
Oriente Fault Zone; EPGFZ: Enriquillo-Plantain-Garden Fault Zone. The red line indicates
685
the localization of the transect proposed Fig. 10.
686 687
688
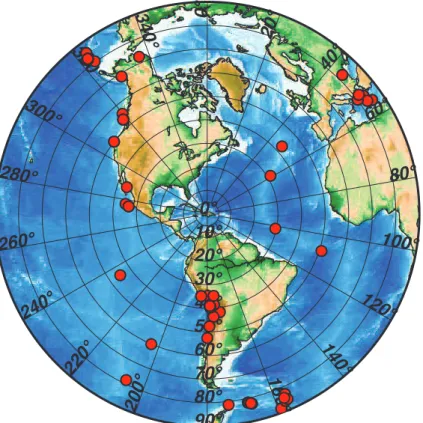
Figure 3: Global distribution of the earthquakes used when computing Receiver Functions.
689
They are plotted with an azimuthal equidistant map projection around our network.
690 691 0° 10° 20° 30° 40° 50° 60° 70° 80° 90° 0° 20° 40° 60° 80° 100° 120° 140° 160° 200° 220° 240° 260° 280° 300° 320° 340°
1.6 1.7 1.8 1.9 2.0 Vp/Vs 10 15 20 25 30 35 40 45 50 Depth (km) 0.7 0.8 0.9 1.0 PIGN, Vp=6.6 km/s, N=4 0 0 5 10 15 20 25 t(s) 177.72 177.89 178.10 178.13
PIGN
northern domain Ps PpPs PsPs+PpSsi.
ii.
1.6 1.7 1.8 1.9 2.0 Vp/Vs 10 15 20 25 30 35 40 45 50 Depth (km) 0.7 0.8 0.9 1.0 0 0 5 10 15 20 25 t(s) 156.03 156.39 156.45 156.53 157.11 157.20 167.14 167.44LGNH
central domain Ps PpPs PsPs+PpSsiii.
1.6 1.7 1.8 1.9 2.0 Vp/Vs 10 15 20 25 30 35 40 45 50 Depth (km) 0.7 0.8 0.9 1.0 0 0 5 10 15 20 25 t(s) 155.96 156.75 156.95 158.65 166.12 166.43 166.47 166.91 167.25 173.06MGOA
southern domain Ps PpPs PsPs+PpSsFigure 4: Examples of Moho depth (H) versus Vp/Vs plots (left) from the method of Zhu and
693
Kanamori (2000) and receiver functions associated (right) for one station of each domain.
694
On each receiver function the arrival time of the Moho phase Ps (t1) and the reverberations
695
PpPs (t2) and PsPs+PpSs (t3) are marked based on the results of the H-K stack (Table 1) and
696
the equations (2) to (4). The receiver functions are plotted as a function of the
back-697
azimuth (number at the right of each trace). See Figs. 2 and 5 for the location of the
698
stations and the different domains.
699 700
701
Figure 5: Variations in Moho depth (Tables 1 and 2) across Haiti determined from receiver
702
function analysis. The blue lines A, B, C, D, and E show the orientation of transects in
703
Figure 7. The black dashed lines delimit the boundary between 3 distinct domains of Moho
704
depth values, numbered 1, 2 and 3 (see text for explanation).
705 2 3 1
C
D A
B
E
GGIL BOIS MEND STRA PIGN CAYH DROU GADC THOM CANG DUFF MIRB GIMB BMCA CBOQ FERM FURC MARG ARCH BMES LGNH PETG MGOA PAPH GRBO JAKH JACM706
Figure 6: Variations in Vp/Vs ratio (Tables 1 and 2) across Haiti determined from receiver
707
function analysis. The orange lines A, B, C, D, and E show the orientation of transects in
708 Figure 7. 709 710
C
D A
B
E
GGIL BOIS MEND STRA PIGN CAYH DROU GADC THOM CANG DUFF MIRB GIMB BMCA CBOQ FERM FURC MARG ARCH BMES LGNH PETG MGOA PAPH GRBO JAKH JACMFigure 7: Variations in elevation, Moho depth, and Vp/Vs ratio across Haiti. The elevation
712
exaggeration is x10. (A) SW-NW across the central and southern part of Haiti, (B) and (C)
713
SE-NW and SW-NE across the northern part of Haiti, (D) S-N across the West of the central
714
and southern part, and (E) W-E across the southern part of Haiti. The orientations of the
715
transects are shown on Figures 5 and 6.
716 717
718 719 720 0 0 5 10 15 20 25
t(s)
44.37 54.90 55.47 55.48 176.64 177.83 177.88 178.09 178.21 CAYH Group a Group b 1.6 1.7 1.8 1.9 2.0 Vp/Vs 10 15 20 25 30 35 40 45 50 Depth (km) 0.7 0.8 0.9 1.0 CAYH, Vp=6.6 km/s, N=5Group a H-K stack method
0 0 5 10 15 20 25
t(s)
176.64 177.83 177.88 178.09 178.21 CAYH Ps PpPs PsPs+PpSsGroup b Ps picked method
H = 9.7 km
Ps PpPs PsPs+PpSs
Figure 8: Estimation of the depth of an intracrustal layer for the station CAYH. The Moho
721
depth is estimated at 22.1 km with Ps arrival and PpPs and PsPs+PpSs reverberations, using
722
the H-K stack method and the RFs coming from the South (back-azimuth of about 170°,
723
group a). A reverberation is imaged before the Ps arrival on RFs coming from the North-East
724
(back-azimuth of about 55°, group b), and the corresponding estimated depth with Ps
725
picked method (Vp=5.8 km/s and K=1.77) is 9.7 km.
726 727
728
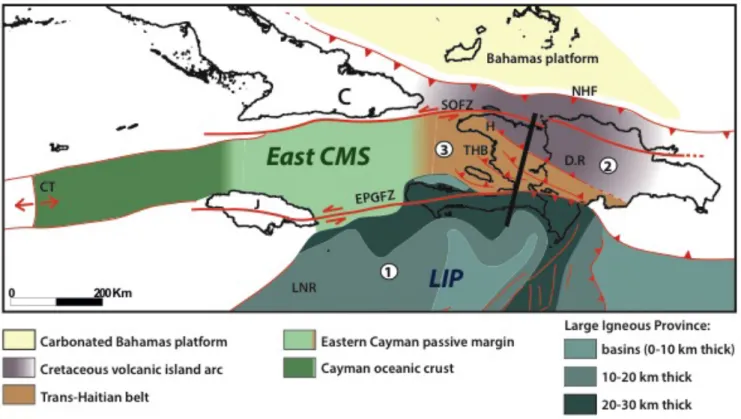
Figure 9: Location of the proposed different crustal domains we identified in Hispaniola.
729
(1) the Caribbean Large Igneous Province, (2) the Cretaceous island arc and (3) the fold and
730
thrust belt. C: Cuba; J: Jamaica; H: Haiti; D.R: Dominican Republic. NHF: North Haitian
731
Fault; SOFZ: Septentrional-Oriente Fault Zone; THB: Trans-Haitian Belt; EPGFZ:
Enriquillo-732
Plantain-Garden Fault Zone; CT: Cayman Trough; LNR: Lower Nicaraguan Rise. East CMS:
733
eastern Cayman Trough margin system; LIP: Large Igneous Province. The black line
734
indicates the localization of the transect shown in Fig. 10. The thicknesses of the LIP at
735
sea are from Mauffret and Leroy (1997). The boundary between the East CMS and the LIP at
736
sea is from Corbeau et al. (2016a).
737 738
739
Figure 10: Summary conceptual geological transect across Haiti based on the Moho and
740
intracrustal discontinuity depths. See Figs 2 and 9 for location of the profile. The
741
seismologic stations are indicated. EPGFZ: Enriquillo-Plantain-Garden fault zone; SOFZ:
742
Septentrional-Oriente fault zone. The log south of the transect is a model of the LIP crustal
743
thickness based on a compilation of seismic refraction results: the layer 2V (original oceanic
744
crust) is sandwiched between an upper basaltic layer (in black) and the layer 3V (original
745
crust underplated); R is the top of a high velocity layer (Mauffret and Leroy, 1997).
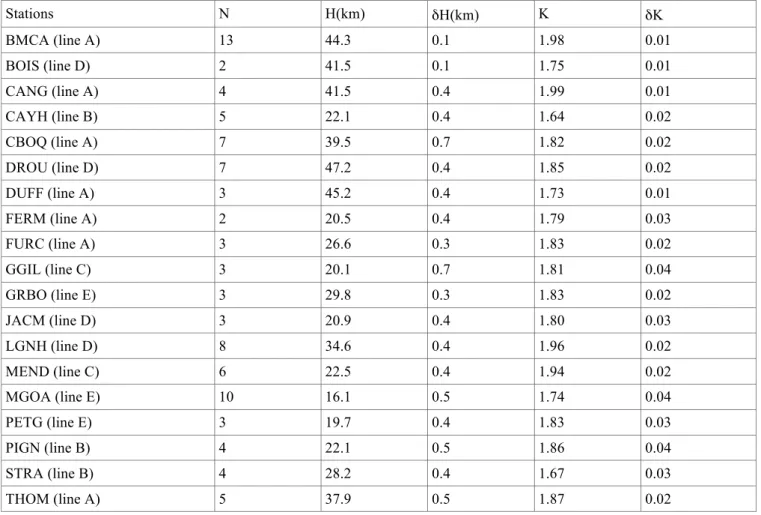
Table 1: Moho depth (H) and Vp/Vs ratio (κ) estimated by the H-K stacking method Stations N H(km) δH(km) K δK BMCA (line A) 13 44.3 0.1 1.98 0.01 BOIS (line D) 2 41.5 0.1 1.75 0.01 CANG (line A) 4 41.5 0.4 1.99 0.01 CAYH (line B) 5 22.1 0.4 1.64 0.02 CBOQ (line A) 7 39.5 0.7 1.82 0.02 DROU (line D) 7 47.2 0.4 1.85 0.02 DUFF (line A) 3 45.2 0.4 1.73 0.01 FERM (line A) 2 20.5 0.4 1.79 0.03 FURC (line A) 3 26.6 0.3 1.83 0.02 GGIL (line C) 3 20.1 0.7 1.81 0.04 GRBO (line E) 3 29.8 0.3 1.83 0.02 JACM (line D) 3 20.9 0.4 1.80 0.03 LGNH (line D) 8 34.6 0.4 1.96 0.02 MEND (line C) 6 22.5 0.4 1.94 0.02 MGOA (line E) 10 16.1 0.5 1.74 0.04 PETG (line E) 3 19.7 0.4 1.83 0.03 PIGN (line B) 4 22.1 0.5 1.86 0.04 STRA (line B) 4 28.2 0.4 1.67 0.03 THOM (line A) 5 37.9 0.5 1.87 0.02
Table 2: Moho depth (H) estimated by Ps picked method 1 Stations N H(km) K ARCH (line D) 5 32.3 1.80 BMES (line A) 5 41.9 1.80 GADC (line A) 4 36.4 1.85 GIMB (line A) 9 44.5 1.75 JAKH (line D) 9 19.0 1.80 MARG (line A) 3 25.5 1.80 MIRB (line A) 3 45.4 1.74 PAPH (line A) 9 42.3 1.85 2