HAL Id: hal-02943064
https://hal.archives-ouvertes.fr/hal-02943064
Submitted on 18 Sep 2020
HAL is a multi-disciplinary open access
archive for the deposit and dissemination of sci-entific research documents, whether they are pub-lished or not. The documents may come from teaching and research institutions in France or abroad, or from public or private research centers.
L’archive ouverte pluridisciplinaire HAL, est destinée au dépôt et à la diffusion de documents scientifiques de niveau recherche, publiés ou non, émanant des établissements d’enseignement et de recherche français ou étrangers, des laboratoires publics ou privés.
The high temperature reaction of ammonia with carbon
and SiC–C ceramics
Georges Chollon
To cite this version:
Georges Chollon. The high temperature reaction of ammonia with carbon and SiC–C ceramics. Journal of the European Ceramic Society, Elsevier, 2020, �10.1016/j.jeurceramsoc.2020.08.066�. �hal-02943064�
The high temperature reaction of ammonia with carbon and SiC–C ceramics
G. Chollon*
Laboratoire des Composites Thermostructuraux, CNRS, 3, allée de La Boétie, 33600 Pessac, France
* Corresponding author. E-mail: chollon@lcts.u-bordeaux.fr
Abstract
This contribution aimed at developing a treatment under ammonia in order to eliminate free carbon from the surface of SiC-based fine ceramics like fibers or coatings. The reaction of NH3
with graphitic and non-graphitic carbon was first investigated through kinetic measurements, in situ gas phase analysis and physicochemical investigations of the solid. The carbon etching rate is controlled by heterogeneous reactions involving active sites arising from bulk structural defects and the formation of HCN. A selection of SiC-based fibers and coatings with various carbon contents and (micro)structures was treated in ammonia in favorable conditions. The analyses of the tested SiC–C specimens revealed a reduction of the free carbon content and, simultaneously, a nitridation of the initial Si–C–(O) continuum over a reaction layer. The growth rate, composition and the volume change of this layer vary with the initial microstructure. The ammonia treatment is able to restore the adhesion of carbon-contaminated surfaces.
Key words: Ammonia; Graphite; Carbon; Silicon carbide; Heterogeneous Kinetics;
Mechanical properties
1. Introduction
The properties of polycrystalline SiC-based materials can strongly be affected by the presence of free carbon that may result from some processing routes. For instance, the oxidation of the free carbon phase present in polymer-derived Si–C–O fibers is believed to reduce the lifetime in air of the fibers at moderate temperatures (600-700 °C), while the self-healing capability of the matrix of SiC/SiC composites is not yet effective [1]. Also, some specific chemical vapor deposition (CVD) conditions, using CH3SiCl3/H2 mixtures, can lead to a high
The development of a post-processing treatment of SiC-based materials, compatible with the fabrication of composites and enabling the elimination of free carbon, would therefore be of a great interest. Gas phase treatments are preferable to liquid routes, as they allow high temperature reactions and favor reproducibility and uniformity, while avoiding complicated hand operations (e.g. soaking, drying, rising...).
Pure carbon can be readily eliminated by controlled oxidation in O2, H2O, or CO2 [3,4].
But silicon-containing materials invariably lead to the formation of SiO2 which is, though
superficial, very difficult to get rid of afterwards. Another well-known method to gasify carbon, without oxygen, is a treatment under flowing ammonia (NH3) [5–9]. NH3 reacts with carbon
between 700 and 1200 °C producing hydrogen cyanide HCN, which is evacuated in the gas phase. On the other hand, a very limited nitridation of bulk SiC is expected in NH3 atmosphere
within this temperature range [8,10,11].
The aim of the present contribution is to propose a treatment of SiC-based fibers and coatings under pure ammonia as the gas reactive source, which effectively leads to the elimination of the free carbon phase over a significant thickness from the outer surface. This work is intended to provide a good understanding and optimization of the chemical process of such a treatment. Surprisingly, the heterogeneous kinetics of the reaction with NH3 and the role
of the pure carbon structure have not yet been studied in detail. It is precisely this point that is addressed in the first stage. Various experimental approaches have been used to achieve this, such as kinetic measurements, gas phase analysis, morphological and structural analyses. In a second step, a selection of free carbon-rich SiC-based fibers and coatings have been treated in ammonia according to favorable conditions and analyzed to assess the effects of the treatments. Finally, the benefits of the ammonia treatments are evaluated by conducting basic by effective tests for the respective applications of the materials.
2. Experimental
2.1. Description of the carbon materials
Different forms of carbon were considered for the ammonia treatments for reasons that will be detailed in section 3.2.1. Cylinders ( = h = 10 mm, of external surface 4.71 cm2) of polycrystalline graphite (2318PT from Mersen, of apparent density of 1.86 g.cm-3 and average grain size of 5 m) were tested, either uncoated or after deposition of a pyrocarbon coating. The coating was a high density/anisotropy pyrocarbon of the “high anisotropic laminar” (HAL)
[12], or “high textured” [13], or also “regenerative laminar” [14–16] type. It was deposited from pure propane at 1050 °C and 5 kPa, in conditions defined in reference [17].
A cleaved and cross-cut highly oriented pyrolytic graphite (HOPG) specimen (from Mersen), with a high proportion of carbon layer edges exposed to the surface (5 × 5 ×5 mm3), was also examined.
Finally, vitreous carbon foam specimens derived from phenolic resin were submitted to the NH3 treatments. The foam geometry was chosen for its high specific surface, to improve
the sensitivity of the etching rate measurements with the microbalance. The cylindrical samples ( = h = 10 mm) were cut in reticulated carbon foam slabs provided by the French atomic energy commission (CEA), Le Ripault, France. The carbon foam slabs (of apparent density: 0.04 g.cm-3, true density: 1.7 g.cm-3 and specific surface: 32 cm-1) were prepared by replica of a polyurethane foam with a resol-type phenolic resin and pyrolysis up to 1000°C [17,18]. The vitreous carbon specimens were treated in NH3 either as-pyrolyzed (referred to as VCF1000) or
heat-treated 1 h at 2000 °C under pure Ar (VCF2000).
2.2. Description of the pristine SiC–C materials
Two types of fibers were considered: the standard Nicalon, from Nippon Carbon (NL 200) and the Tyranno ZMI from UBE Industries. These fibers both belong to the Si–C–O system and are respectively form the first and second generation of fine SiC-based fibers, the Tyranno ZMI containing also traces of zirconium and significantly less oxygen than the Nicalon NL 200 [19].
The CVD coatings were deposited on a silicon wafer from a mixture of methyltrichlorosilane (MTS, of formula CH3SiCl3,) and H2, at a pressure of 5 kPa and a
temperature of 1000 °C. Their respective composition, uniform through the whole thickness (tc), was adjusted by changing the flow rate (or molar) ratio = QH2/QMTS [2].
2.3. Description of the ammonia treatments
The experimental set up used for the kinetic analysis of NH3 etching of the carbon
specimens and the NH3 post-treatments of the SiC–C coatings consisted of a vertical silica tube
(23 mm in diameter) heated in its central part by radio-frequency induction of a graphite susceptor. The temperature (T < 1100 °C), the pressure (2 < P < 100 kPa) and the NH3 flow
all accurately controlled. The etching rate of the carbon specimens was measured in situ with a microbalance (Setaram B Setsys) connected on top of the reactor.
The CVD coatings were heated under argon up to a constant treatment temperature T = 1095°C, before the NH3 flow was established (Q = 400 sccm). P was varied from 10 to 50 kPa
and the duration of the treatment ranged from r = 0.25 h to 3 h.
The Si–C–O fibers were treated in a resistive horizontal furnace equipped with a silica tube (of diameter 60 mm). The specimens were heated (15 °C.min-1) at atmospheric pressure (P = 100 kPa) directly under the pure NH3 flow (40 sccm) up to a treatment temperature of T =
1100 °C, for a reaction time ranging from r = 1 to 6 h.
2.4. Characterization techniques
A Fourier transform infrared (FTIR) spectrometer (Nicolet 550) was coupled to the reactor for in situ analysis of the gases passing through the reactor. 32 scans with a 0.5 cm-1 resolution were recorded for each spectrum. The background was recorded under pure flowing argon for each temperature condition prior to the reactive gas analysis.
The morphology of the specimens was examined using a scanning electron microscope (FEG-SEM HitachiS-4500). The structural organization of the carbon phase in the various materials was assessed by Raman microspectroscopy (RMS, Horiba Jobin-Yvon Labram HR) (λ = 632.8 nm, spectral resolution ≈ 2 cm−1, lateral resolution ≈ 1 μm), X-ray diffraction (Bruker D8 Advance (λCu-Kα1 = 0.15419 nm), and transmission electron microscopy (TEM, Philips,
CM30SP, operating at 300 kV). The TEM specimens were prepared according to the procedure described in reference [2].
The bulk elemental composition of the Si–C–O fibers was determined by elemental analysis at the CNRS central analysis service in Solaize, France (C, O and H with specific analyzers and Si and Zr by inductively coupled plasma – atomic emission spectroscopy). The surface and in-depth elemental composition of the pristine and NH3-treated SiC-based
specimens were characterized by Auger electron spectroscopy (AES) coupled with Ar+ sputtering (VG Microlab 310-F). The accelerating voltage and beam current were respectively 10 kV and 5 nA. The Si and C concentrations were obtained using sensitivity factors inferred from the analysis of a SiC standard. The etching depth was calibrated using standard Ta2O5
3. Results and discussion
3.1. Characterization of the pristine SiC–C materials
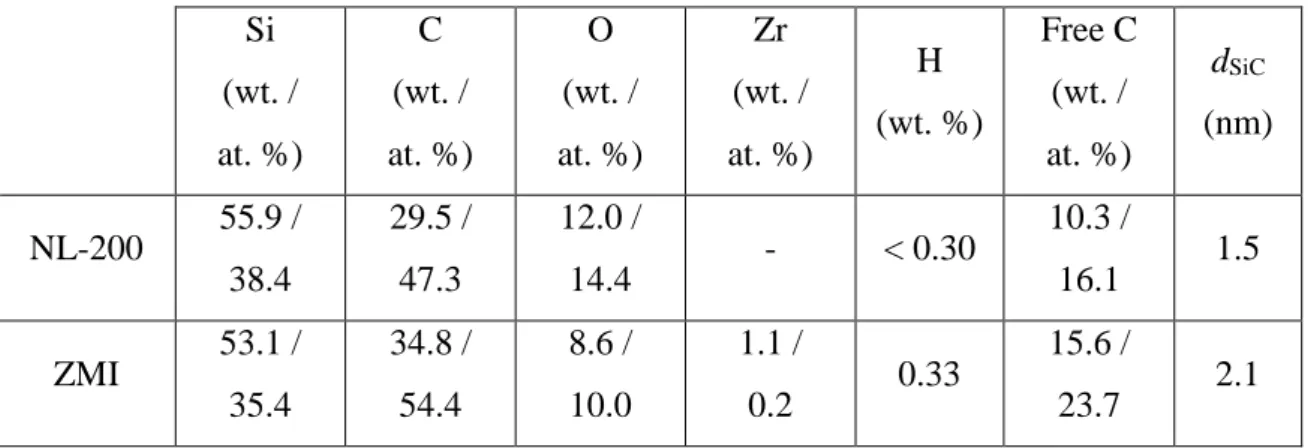
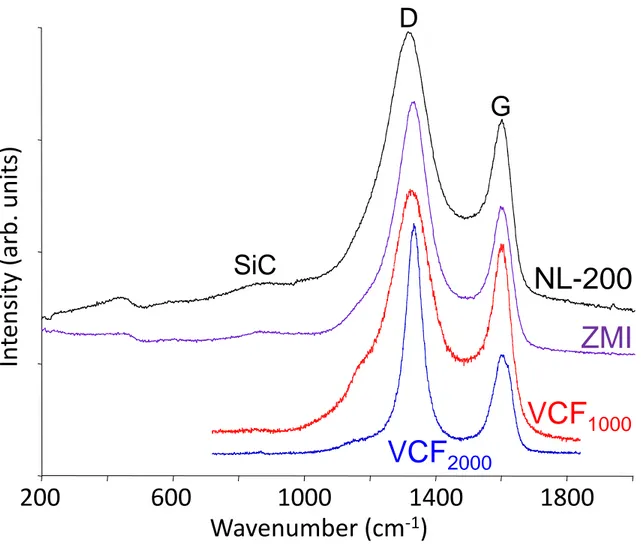
The bulk elemental concentrations of the two Si–C–O fibers are reported in Table 1 (the atomic concentrations are calculated from the weight concentrations and by neglecting hydrogen). The two fibers consist predominantly of nanometric SiC grains, an amorphous SiO2xC1-x phase and free highly disordered sp2 carbon [20–23], evidenced by broad D and G
bands on the Raman spectra (Fig. 1) [24]. Considering independently the SiC + SiO2xC1-x
continuum (with tetrahedrally coordinated Si and C atoms) and the free aromatic carbon, as suggested by Kroll [25], one can calculate the amount of free carbon directly from the atomic concentrations (see Table 1) [22]. The atomic concentration depth profiles recorded from the surface by AES are in agreement with bulk compositions. However, they reveal an increase of the oxygen concentration – and the Zr concentration for the Tyranno ZMI fiber – near the surface through a thin (less than 80 nm-thick) layer (Fig. 2).
A near stoichiometric composition of the CVD coating was obtained for an initial molar MTS/H2 ratio of = 3 (the coating being referred to as CVD0) [2]. The SiC phase was mainly
of the type (3C in Ramsdell notation) and the coherent domains of nanometer size. Variable amounts of co-deposited free carbon (20 and 70 at. %) were obtained for lower ratios (coatings referred to as CVD20 and CVD70, respectively) (Table 2, Fig. 3). In the CVD70 sample,
both TEM and RMS analyses did not reveal the SiC phase but evidenced only free carbon, with a very disordered structure involving short and distorted polyaromatic layers (Fig. 4a), with some degree of anisotropy (Fig. 4b), and characterized by broad Raman bands (Fig. 5) [2]. The AES depth profiles showed the presence of oxygen at the interface which likely arises from a slight initial oxidation of the Si substrate (Fig. 3).
3.2. The reaction between carbon and ammonia
3.2.1. Preliminary analyses and behavior of the various carbon specimens
The carbon specimens tested were chosen by trying to approach the structure/texture of the carbon phase present in the SiC–C materials. The carbon structure is poorly organized in both SiC–C materials considered. In the fibers, the carbon domains are short and stacked in 2– 3 polyaromatic layers inserted between the SiC grains of the continuum [20,26], giving rise to
a highly disordered (as shown by the Raman spectra, in Fig. 1) and isotropic microstructure. In the carbon-rich CVD coatings (CVD70), the carbon domains are much more abundant, thicker
and longer, but also distorted at the nanometer scale (Fig. 4) [2]. As in low temperature pyrocarbon [12–16], the layers are arranged in an anisotropic texture at the micrometer scale and assembled parallel to the substrate (see selected area electron diffraction pattern in Fig. 4) [2].
The pyrocarbon coating was first selected for the ammonia treatments because of its structural and textural features a priori similar to the SiC-C coating [12–16]. The pyrocarbon coating deposited on graphite was treated under pure NH3, at a flow rate Q = 400 sccm, a
pressure P = 10 kPa, and a maximum temperature of T = 1095 °C. No significant weight loss was detected up to 1095°C until the coating eventually cracked, exposing the graphite substrate, itself being much more sensitive to the reaction with NH3. Accordingly, the same treatment was
applied to the bare polycrystalline graphite substrate. Contrary to the pyrocarbon coating, a significant steady state weight loss was recorded for T ≥ 900 °C, in agreement with previous studies [5–7]. Polygraphite is inherently a heterogeneous material. To better understand the correlation between the NH3 etching behavior and the carbon crystallinity and anisotropy, the
HOPG specimen was tested in the same conditions as above. As for the pyrocarbon sample, no reaction was detected up to T = 1095 °C.
Finally, to better approximate the structure of the free carbon phase present in the Si– C–O fibers, the vitreous carbon foam specimens were submitted to the NH3 treatments. As for
other phenolic resin-based cokes, the vitreous carbon foam pyrolyzed at 1000°C (VCF1000) is
expected to be highly disordered, with very short and distorted domains of only a few layer stacks arranged without any preferential orientation [27,28]. Accordingly, the Raman spectrum of the VCF1000 foam shows very broad D and G carbon bands, similar to those observed for the
Si–C–O fibers (the bands are slightly broader for the NL-200 than for the ZMI, see Fig. 1). On the other hand, the Raman spectrum of the vitreous carbon foam heat-treated at 2000 °C (VCF2000) reveals sharper D and G bands (Fig. 1), suggesting that the structural organization
was significantly improved by annealing. The material is still expected to be isotropic, but with longer coherent domains and more extended and entangled polyaromatic layers, entrapping a high amount of microporosity [27,29–31]. The Raman analysis suggests that the VCF1000 foam
is representative, in terms of structure, of the free carbon phase of the Si–C–O fibers (both fibers are indeed reported to be pyrolyzed slightly above 1000°C, see [19]). Under the same NH3
treatment conditions as above, the onset of the reaction was detected at a temperature as low as
disordered carbon from sucrose at atmospheric pressure [9]. On the other hand, the VCF2000
foam starts to react only at T = 950°C. It should be noted that the foam specimens allowed lower etching rate measurements than bulk graphite due to their higher specific surface.
The graphite and VCF1000 vitreous carbon foam being more adapted than the other
carbon specimens, because of their higher reactivity, specific surface, or better similarity with the free carbon phase in the fibers, these two materials were selected for a more detailed kinetic analysis.
3.2.2. Kinetic study
The influence of the NH3 flow rate (Q = 25–500 sccm) on the kinetics of carbon etching
by NH3 was first investigated. The total pressure was fixed at P= 10 kPa and the temperature
chosen relatively high (T = 1095°C) for the less reactive graphite specimen and moderate (T = 850 °C) for the more reactive VCF1000 specimen. The etching rate (K in g.min-1cm-2) was
assessed from the weight loss for each value of Q, once the steady state was reached, i.e. when the surface state of the specimen was assumed to be stable versus time. Two distinct kinetic regimes were observed with a transition at about Q = 100–150 sccm for both graphite and VCF1000 specimens (Fig. 6). K increases significantly with Q for low Q values (domain 1) and
only slightly for Q > 150 sccm (domain 2), suggesting a transition from a regime controlled by mass transfer (MT) to another regime controlled by chemical reactions (CR).
To confirm these assumptions, the influence of the temperature on the etching rate of the graphite specimen was studied for two different flow rates chosen within domains (1) and (2), i.e. respectively at Q = 50 sccm and 400 sccm (Fig. 6). The etching rate K was measured by gradually increasing the temperature (T ≤ 1095°C). K obeys an Arrhenius law for both flow rates and almost the whole temperature range (Fig. 7). A slight decrease of thermal activation is however observed around 1095 °C and especially for Q = 50 sccm, reflecting the effect of the MT limitation. The apparent activation energy (Ea) can be evaluated, within the T = 900–
1070 °C domain, at about 325 8 kJ.mol-1 for Q = 400 sccm and 271 7 kJmol-1 for Q = 50 sccm. Such a high thermal activation suggests that kinetics are controlled by heterogeneous chemical reactions, as expected at Q = 400 sccm (see Fig. 6), but also at Q = 50 sccm provided the temperature does not exceed 1070 °C.
In order to study the influence of the carbon structure and microtexture on the etching kinetics in the CR-controlled regime, the flow rate was set to Q = 400 sccm (the pressure being still fixed at P = 10 kPa) and the K temperature dependence was compared for graphite and both VCF1000 and VCF2000 specimens. As expected from section 3.1.1., the etching rate is about
20 times higher for the VCF1000 – respectively ≈ 40 times lower for VCF2000 – than for the
graphite reference (Fig. 7). However, despite the distinct K values and temperature domains investigated, the apparent activation energies are relatively close for the three materials (Ea =
325 8 kJ.mol-1 for graphite and T = 900–1070 °C, Ea = 249 8 kJ.mol-1 for VCF1000 and T =
700–900 °C and Ea = 307 2 kJ.mol-1 for VCF2000 and T = 950–1050 °C, see Fig. 7 and Table
3). This result suggests that kinetics are likely controlled by a common surface chemical reaction mechanism.
The influence of the total pressure (P = 7–100 kPa) was finally investigated for both graphite and VCF1000 specimens within the CR-controlled regimes identified above, i.e. at Q =
400sccm and T = 970 °C for graphite and T = 850 °C for VCF1000 (Fig.8). For P > 10 kPa, K
follows a typical K(T,P) = f(T) Pn kinetic law for both graphite and VCF1000, with similar
apparent reaction orders: n = 0.32 0.04 and 0.32 0.01, respectively. This behavior confirms again that kinetics are controlled by chemical reactions for both materials within a large domain of pressure and temperature. The following general law for the etching rate can be proposed for both materials, provided kinetics are CR-controlled (Table 3): K(T,P)=K0 exp(-Ea/RT) Pn,
where K0 is a pre-exponential factor and R the perfect gas constant.
3.2.3. FTIR in situ analyses
In order to clarify the mechanism involved in the carbon gasification under ammonia and particularly investigate the gas products, an in situ FTIR analysis of the gas phase was carried out. The analyses was performed at P = 10 kPa, various temperatures and gas flow rates, and either (i) without any carbon specimen or (ii) with an annular cylinder of vitreous carbon foam (VCF1000) installed in the hot zone. The objective of the latter experiment was to provide
a reactive carbon surface while letting the IR beam go through the flowing gas along the reactor, to follow the in situ NH3 consumption and products formation. For all conditions and even at
high T (up to 1050 °C) and low Q (down to 100 sccm), the FTIR analyses did not reveal any significant NH3 depletion (the accuracy of the variation in intensity of the NH3 IR features was
limited because the gas column analyzed included the hot zone but also the initial gas mixture upstream and the reacted gases downstream). On the other hand, at T = 1050 °C and Q = 100 sccm (a relatively high temperature and low gas flow rate were selected to maximize the concentrations of the gas products resulting from heterogeneous reactions), the analyses clearly revealed the main IR features of HCN (NC-H at 713 cm-1 and NC-H at 3260 cm-1) formed by the
(C-H at 3015 cm-1, see Fig. 9c), this study confirms that HCN is the major product of carbon
gasification by reaction with ammonia [5–8].
3.2.4. Characterization of the etched carbon specimens
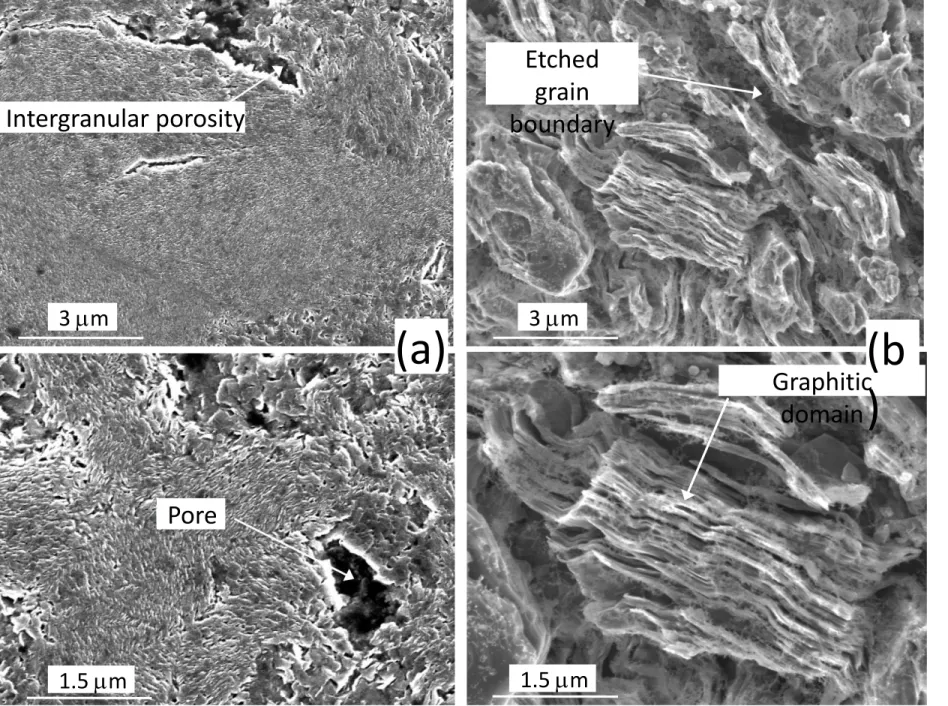
The morphology and the superficial structure of the etched specimens obtained after the recording of the Arrhenius curves (Fig. 7) were respectively analyzed by SEM and RMS. Only specimens that underwent significant etching rates were examined, the net mass loss being still well below the initial mass (< 1 % for graphite, < 10 % for VCF1000). The poorly organized
carbon phase in the graphite specimen (located at the pore edges or grain boundaries) was etched preferentially (Fig. 10). The resulting surface was rough, the etching leaving only grains with a high structural organization degree, with straight and thick graphitic domains (Fig. 10). After etching, the Raman spectra showed a significant sharpening of the typical carbon bands (D, G and D’ bands respectively at 1350, 1580 and 1620 cm-1) [32] due to an apparent
superficial ordering of the material, i.e. to the selective etching of the disordered carbon phase (Fig. 10). In contrast, the surface of the VCF1000 foam remained very smooth up to the highest
magnification and the Raman features were also unchanged after etching. Only the sharpest edges of the struts were smoothed out (Fig. 11). Some widely open cracks also appeared at cell vertices, suggesting an internal stress relaxation phenomenon, similarly as for the oxidation of phenolic resin-based coke [28].
3.2.5. The carbon etching mechanism; correlation between structure and reactivity
The reaction between carbon and ammonia was first described by Clouet at the end of the 18th century and since then constantly studied, for the production of HCN [5–7] or for
addressing more specific issues [8,9,33,34]. It is well admitted that above 700°C, two reactions take place in parallel: (i) the heterogeneous reaction between a NH3 molecule from the gas and
an active site C* of the carbon surface (Equation 1):
NH3 + C* HCN + H2 (1)
and (ii) the dissociation of NH3 (Equation 2), which occurs at the expense the former [5–8,33]:
In the temperature range explored in this work and in the literature, the NH3 dissociation is
expected to be mainly heterogeneous [33] and thus, as for Equation 1, influenced by the nature of the carbon surface. The interaction between a NH3 molecule and a less active surface site
(than C*) C▪, would then lead to catalytic dissociation (Equation 2’):
NH3 + C▪ C▪ + 1/2 N2 + 3/2H2 (2’)
The FTIR analyses revealed that the proportion of NH3 consumed remained low, either with or
without reactive carbon present in the hot zone (see section 3.1.3). Homogeneous dissociation (Equation 2) was indeed negligible due to the too low temperature [33]. On the other hand, even if some NH3 reacted with carbon in the hot zone, the amount consumed by heterogeneous
reactions or catalytic dissociation (Equations 1 and 2’) was too scarce to be followed by FTIR. Equation (1) is the only reaction leading to carbon gasification. It is therefore most probably responsible for (i) the CR-controlled kinetic regime of the etching rate, which has been characterized in situ (at least at high Q values, Fig. 6–8), (ii) the formation of HCN, also evidenced in situ (Fig. 9b,c) and (iii) the specimen surface etching evidenced by SEM (Fig. 10,11). Katsura et al., who studied the reaction of non-graphitic carbon with NH3, surprisingly,
did not consider Equation 1 at all [34]. These authors are the only one who proposed CH4 as
the main product of the carbon gasification reaction (from gas chromatography analyses), instead of HCN (Equation 3):
NH3 + C CH4 + N2 (3)
The present FTIR analyses have shown that this reaction cannot be strictly excluded (traces of CH4 were indeed detected, see Fig. 9c) but that it is negligible compared to Equation 1.
It clearly appears from sections 3.1.1 and 3.1.2 that kinetics of reaction between carbon and NH3 are strongly connected to the nature of the carbon surface. From the present results
and as with the well-documented oxidation of carbon [35–40], the kinetics of carbon gasification in ammonia appears to be strongly related to the proportion of active adsorption sites [6,7,33]. The active specific surface (ASA), as measured by thermal programmed desorption [36,41], is itself naturally linked to the structural organization of the carbon material at its surface, or in the subsurface if the material is being consumed. In fact, in the case of carbon oxidation, the reactive surface effectively leading to gasification may differ from the ASA and involve preferentially carbon layer edges [42]. This explains why the HAL pyrocarbon
specimens, whose growth mechanism [12] and high anisotropy [14–16] limit the amount of free edges at the surface, did not react homogeneously with NH3 until local pitting and cracking of
the coating. On the other hand, the edges of the HOPG specimen were found totally insensitive to NH3 etching (see section 3.1.2). This result shows that while the majority of active sites
effectively involved in carbon gasification belong to carbon edges, not all edge atoms present at the surface are effective active sites. Hence, one can reasonably assume that the effective reactive sites present on the surface being consumed arise preferentially from high energy (e.g. in-plane) structural defects [43] that were initially comprised in the subsurface. Consequently, the homogeneous and high defect density in the phenolic resin-based coke pyrolysed at low temperature [27] leads to a particularly high reaction rate of VCF1000 (Fig. 7) and a smooth
surface compared to graphite (Figs. 10,11). The onset of the reaction also appears at a particularly low temperature, as for oxidation [28] or for the reaction with sucrose-derived carbon [9]. Polycrystalline graphite has itself a heterogeneous microstructure that induces a selective etching of the disordered intergranular phases (Fig. 10). Finally, a high temperature treatment, by eliminating the amount of structural defects – and effective active sites –, reduces drastically the reactivity of non-graphitizable carbon by oxidation [44] or, as here, by reaction with NH3 (compare VCF1000 and VCF2000 in Fig. 7). Except the density of active sites – or high
energy structural defects –, which affects the reaction rate, the mechanism of the reaction between carbon and NH3 remains essentially the same for the various carbon materials, as
shown by their relatively close activation energies (Fig. 7). However, the slightly lower Ea value
obtained for VCF1000, compared to VCF2000 and graphite, could be related to slightly different
transition states during the elementary reaction (Equation 1), due to the different local structure around the carbon active sites.
3.3. The reaction of ammonia with the Si–C–O fibers
The AES depth profiles of the treated fibers were examined to assess the superficial chemical changes resulting from the reaction of the Si–C–O fibers with ammonia. As expected, the carbon concentration is significantly reduced at the surface of the fiber. The carbon removal is however compensated by a nitridation of the surface, the concentrations of the other elements being almost unchanged (Fig. 12). SEM analyses were conducted to observe the morphology of the reaction layers and compare their thicknesses trl, (see inset in Fig. 13) with the values
deduced from the AES profiles (trl was determined from the average of values from five
smooth as for the pristine fibers: no apparent defects were created by the ammonia treatments. On the other hand, trl increases with the reaction time r (Fig. 13). The Nicalon fiber has a low
reactivity; the reaction layer was not revealed by SEM and its thickness determined by AES was lower than 100 nm for r ≤ 6 h (Fig. 13). In contrast, the thickness of the reaction layer at
the surface of the Tyranno ZMI fiber is 350 nm for r = 3 h (Fig. 13) and reaches about 1000
nm for r = 6 h.
3.4. The reaction of ammonia with the SiC–C CVD coatings
The first experiment (CVD70-10-3) was the NH3 treatment of the CVD70 specimen (70
at. % of free carbon, tc = 400 nm) at P = 10 kPa for r = 3 h (here and the in the following, the
experiment and the resulting specimen are referred to as CVDx-P-r, where x is the free carbon
concentration in at. %, P the pressure in kPa and r the duration time in h, see Table 4). Except
weak residual features, the original D and G carbon bands have almost vanished on the Raman spectrum (Fig. 14). The presence of a strong 520 cm-1 peak due to the silicon substrate reveals that the free carbon phase is almost fully eliminated. The AES profile confirms that the carbon content is significantly reduced, but it also reveals a significant nitridation through the whole reaction layer (Fig. 15). Oxygen (12 at. %) is present at the interface with the substrate, probably arising from the initial contamination of the CVD70 specimen (Fig. 3). A
deconvolution of the C-KLL peak concluded that some residual free carbon (≈10 at. %) was still present within the outer part of the reaction layer, in agreement with the RMS analyses. It is worthy of note that the conversion of the coating is associated with a decrease in thickness of about 65 % (Figs. 3,15).
The CVD70-50-3 experiment performed on CVD70 was strictly identical to CVD70-10-3,
except that the pressure was raised up to P = 50 kPa. The carbon Raman bands were no more observed in this case (Fig. 16), illustrating that free carbon was completely removed through the whole thickness. The AES profile indeed confirmed that the carbon content was strongly reduced and assigned only to a carbide phase (Fig. 17). However, a high oxygen concentration (≈20 at. %) was detected throughout the reaction layer, probably due to an unexpected contamination during the NH3 treatment, favored by the high pressure.
For the third CVD70-50-0.25 experiment on CVD70, r was reduced to 0.25 h. The carbon
the wafer however appeared on the Raman spectrum (Fig. 18), indicating that the removal of the free carbon phase was only partial.
The conditions of the CVD20-50-3 experiment (identical to CVD70-50-3) was then
applied to the CVD20 specimen (20 at. % of free carbon, tc = 200 nm). The nature of the surface
of the resulting specimen was heterogeneous. A few spots were found almost depleted of free carbon whereas the major part still showed strong Raman carbon features together with the Si peak (Fig. 18). The free carbon removal by the reaction with NH3 was apparently impeded in
CVD20, although this coating was half thinner than CVD70 and contained considerably less free
carbon.
Finally, the treatment of the pure SiC CVD0 coating in the same conditions (CVD0
-50-3) resulted in only a very superficial carbon-depleted and nitrided reaction layer (trl < 5nm)
(Fig. 19).
3.5. The NH3 + SiC–C reaction mechanism; correlation between (micro)structure and
reactivity
The study of the reaction between carbon and NH3 allowed proposing conditions that
are a priori favorable for the etching of free carbon in the SiC–C materials. Under these conditions (T 1100 °C, P = 50–100 kPa), a few hours duration treatment of both Si–C–O fibers and CVD SiC–C coatings effectively lead to a partial or total elimination of free carbon over a few hundred nanometer-thick converted superficial layers.
In the SiC–C materials, the carbon removal (Equation 1) is always accompanied by a nitridation reaction. During the process, the nitrogen atoms replace gradually the carbon atoms in the silicon tetrahedral environment, while the oxygen atoms that can be present in some cases (e.g. in the Si–C–O fibers or at the interface of the SiC–C coatings) remain bonded to silicon.
In the case of the Si–C–O fibers, if SiO2XC1-X represents the SiC + SiO2xC1-x continuum
(i.e. excluding the free carbon phase), Equation 4 can be proposed to explain the nitridation reaction that occurs in parallel with carbon gasification (Equation 1):
:
SiO2XC1-X + 7/3y NH3 SiO2XN4y/3C1-X-y + y HCN + 3y H2 (with 0 < X + y < 1) (4)
The converted layer therefore consists of a silicon oxycarbonitride SiO2XN4y/3C1-X-y continuum,
free carbon if not fully eliminated. Accordingly, the amount of oxygen in the continuum is not significantly altered except at the very near surface where a thin oxygen rich layer was initially present (Figs. 2,12).
In the case of the pristine SiC–C coatings, which are almost oxygen free (Fig. 3), Equation 4 is no more valid. A nitridation reaction still occurs and a silicon oxycarbonitride is still formed, but this time resulting from a simultaneous oxidation due to contamination (Figs. 15,17). The oxygen atoms present in traces in the gas phase compete with the nitrogen atoms in the carbon substitution around tetrahedral silicon. Such a contamination can not be excluded during fiber treatments, but since oxygen is already abundant in the initial ceramic, its effect is limited, as shown by the AES profile (Figs. 2,12).
Although the reaction of NH3 with pure SiC is limited and only superficial [8,10,11],
the nitridation yield can be expected to be much higher for nanocrystalline SiC than for bulk SiC, due to the much higher surface-to-volume ratio of the former. This effect explains the reactivity of the Si–C–O fibers containing -SiC nanocrystallites (≈2 nm) [23] and more especially of the CVD70 coatings, where the SiC phase is probably limited to clusters of only a
few atoms or even isolated SiC4 tetrahedral sites (no coherent domains were found by TEM,
see section 3.1).
Although nothing has been reported on the reaction of silicon oxycarbide ceramics with NH3, the reaction mechanism – as the kinetics – is probably different to that involved for pure
SiC. Studies on 6H-SiC in NH3/N2 mixtures showed that the presence of even trace amounts of
oxygen can play a significant part in the nitridation process of SiC [10,11]. These studies indeed showed that a superficial Si–C–N–O layer was generated below 1400 °C, as in the present case. The gasification of the free carbon phase (Equation 1), on the other hand, is promoted by the accessibility of the latter by diffusion to reactive gases (NH3 or possibly NHx▪ radicals)
inwards and HCN outwards. The reaction is also favored by an abundant and continuous (percolated) free carbon phase, the gasification of which providing access to the reactant gases and promoting the removal of HCN. This is the reason why the Tyranno ZMI containing 23.7 at. % of free carbon is more reactive than the Nicalon fiber (16.1 at. % of free carbon). This is also why free carbon is fully eliminated in the CVD70-50-3 specimen (CVD70 containing
initially 70 at. % of free carbon) and not in the CVD20-50-3 specimen (CVD20 containing 20 at.
% of free carbon). The nitridation reaction, on the other hand, is enhanced by an easier access to the SiC phase of the nitriding species, but also by the amount of free carbon/SiC interfaces. The SiC phase in CVD70 is scarce but homogeneously dispersed in the continuous free carbon
phase (no SiC clusters were found by TEM analysis). It is therefore much more prone to nitridation after carbon removal than the pure and coarse-grained CVD0 coating.
The global conversion reaction is associated with a large volume reduction depending on the initial free carbon content. The reaction layer is however dense and smooth, suggesting improved properties in terms of chemical inertness (e.g., in oxidation resistance) or coating adherence (through the removal of anisotropic carbon).
3.6. Influence of the NH3 treatment on basic properties of the Si–C–O fibers
The oxidation resistance and the failure strength at room temperature of the Si–C–O fibers were both examined before and after the NH3 treatments (3 h and 6 h at 1100°C). The
oxidation behavior was briefly evaluated by SEM analysis of fiber cross sections after long-term annealing in ambient air at relatively low temperature (45 days at 600°C). These conditions were chosen because they are particularly detrimental to the SiC/SiC composite lifetime (since the healing of matrix cracks is not effective). It is therefore under these conditions that the nitriding effect would a priori be the most beneficial [22]. The thickness of the oxide layer was first measured by SEM after oxidation of the pristine fibers. The oxidized layer was found considerably thicker for the Nicalon NL 200 than for the Tyranno ZMI (725 nm versus 75 nm). This result is consistent with low temperature extrapolations of previous data [45] (such a low testing temperature was not explored by the authors). The thickness of the layer formed successively after nitridation and oxidation was also measured by SEM. It is important to precise that no distinction could be made by SEM between the outer layer formed by oxidation and a possible residual nitrided layer which would not have been oxidized. Yet, the resulting complex Si–C–N–O layer was clearly discernable from the unreacted substrate, as were the nitrided and oxidized layers formed independently. No real benefit of the nitridation on the oxidation behavior was evidenced in the case of the Tyranno ZMI fiber: after the ammonia treatments, the layer formed by oxidation at the surface of the Tyranno ZMI was equivalent in thickness to the original nitrided layer. On the other hand, the thickness of layer found after oxidation was lower when the Nicalon NL 200 was pre-treated in NH3 (175 and 200 nm,
respectively for r = 3 and 6 h, versus 725 nm for the pristine fiber).
The average failure strength was unfortunately considerably reduced after the NH3
treatments for both fibers: of -18 % (3 h) and -41 % (6 h) for the Nicalon NL 200 and -48 % (3 h) and -61 % (6 h) for the Tyranno ZMI. Since no apparent new defects were observed after the treatment, such a strong decrease of strength could be assigned to surface tensile residual
stresses resulting from the shrinkage of the layer upon nitridation (the treatment temperature was probably too low to activate viscous flow and relax stress).
3.7. Influence of the NH3 treatment on the adhesion of SiC//SiC multilayers
In order to validate the concept of restoring the surface of a CVD SiC deposit contaminated by free carbon [2], two different SiC//SiC multilayers were prepared on silicon wafer substrates and submitted to adhesion tests by scratch testing. In the first bilayer, the interfacial layer () is a 400 nm-thick carbon-rich CVD70 coating deposited between two
identical pure SiC CVD0 coatings. In the second bilayer, the same interfacial layer was treated
in ammonia in condition CVD70-50-3 to remove free carbon before deposition of the second
pure SiC layer (Fig. 20). The interfacial layer in the second bilayer therefore consisted of a Si– C–N–O layer (see Fig. 17). The first and second pure SiC layers had thicknesses of respectively 2.5 and 0.5 μm to minimize the contribution of the more compliant Si substrate. The scratch tests on the two SiC//SiC multilayers were performed exactly in the same conditions, as defined in reference [2].
Although debonding was observed in both cases, the threshold load corresponding to interface failure is twice as high for the second bilayer, whose interface was treated with NH3
(L = 18 N), as for the first SiC/CVD70/SiC bilayer (L = 9 N) (Fig. 20). The adhesion
characteristics of the "restored" bilayer naturally did not reach the level of those of a SiC monolayer obtained without any interfacial layer (no debonding was observed up to L = 25 N). However, this result confirms the benefit of the NH3 treatment: the removal of free carbon at
the interface between two SiC layers indeed improved the adhesion between the layers.
4. Conclusion
The study of the reaction between different types of carbon and NH3 has shown that the
etching rate is mainly controlled by the surface reaction leading to the formation of HCN. The kinetic law of the reaction rate was determined for various flow rate, pressure and temperature conditions. The apparent activation energy and reaction order are close regardless of the type of carbon, revealing a common reaction mechanism. On the other hand, the etching rate is strongly dependent on the amount of reactive sites on the surface, which is itself related to the structural organization at the atomic scale and the exposure of layer edges upon surface
recession. This preliminary study allowed selecting favorable conditions for free carbon removal from the surface of Si–C–O fibers or CVD SiC–C coatings.
Under these conditions, a few hours of treatment are sufficient to remove free carbon over a thickness of several hundred nanometers. The removal of carbon is accompanied by a nitridation reaction of the SiC phase, during which nitrogen atoms substitute for carbon atoms in the tetrahedral environment of silicon. Oxygen may simultaneously be introduced during the reaction if it is already present in the ceramic or due to contamination.
The conversion layer therefore consists of a mainly amorphous Si–C–N–O material, possibly including residual SiC nanocrystals and free carbon, if not been completely removed. The gasification of carbon is facilitated by the accessibility of gases by diffusion through the reaction layer and therefore by the presence of an abundant free carbon phase forming a continuous network. For this reason, and contrary to what might have been expected a priori, free carbon is completely removed from CVD SiC–C coatings containing a large carbon excess (i.e. 70 at. % of free C) and not from coatings with much less free carbon (20 at. %). The nitridation reaction occurring in parallel is favored by the accessibility of the SiC phase by NH3,
but also by the proportion of SiC/free carbon interfaces. The SiC phase was not abundant in the coating containing 70 at. % of free C, but homogeneously distributed within the carbonaceous phase, which made it much more sensitive to nitridation than a pure SiC deposit. The conversion of the layer is associated with a strong reduction in thickness, which depends on the initial free carbon content.
The reaction layer is dense and its surface smooth, which suggests interesting properties in terms of chemical inertness. The ammonia treatments indeed improve the oxidation resistance of the Nicalon NL 200 fiber at 600°C, but this benefit is restrained by the drop of the failure strength observed in parallel. Finally, adhesion measurements on SiC//SiC multilayers have validated the concept of NH3 treatments to restore carbon-contaminated surfaces. The
removal of free carbon from a SiC–C layer inserted between two pure SiC layers significantly improves the adhesion between the SiC layers.
Acknowledgements
This work was funded by Safran Propulsion System (now Safran Ceramics) and the National Center for Scientific Research (CNRS). The carbon foams were kindly provided by the French alternative energies and atomic energy commission (CEA), Le Ripault. The author
is indebted to M. Placide, M. Lalanne and N. Capelle, for their participation in the experiments, and gratefully acknowledges H. Plaisantin, S. Mazerat and F. Langlais for fruitful discussions.
References
[1] P. Forio, F. Lavaire., J. Lamon, “Delayed failure at intermediate temperatures (600 °C–700 °C) in air in silicon carbide multifilament tows”, J. Amer. Ceram. Soc. 87 (2004) 888–893. [2] G. Chollon, F. Langlais, P.Placide, P. Weisbecker, Transient stages during the chemical vapour deposition of silicon carbide from CH3SiCl3/H2: impact on the physicochemical and
interfacial properties of the coatings, Thin solid films 520 (2012) 6075–6087.
[3] P.L. Walker, F. Rusinko, L.G. Austin, “Gas reactions of carbon”, Adv. Catalysis, 11 (1959) 133–220.
[4] L. J. Shadle, D. A. Berry, M. Syamlal, “Coal conversion processes, gasification”, Kirk-Othmer Encyclopedia of Chemical Technology 6 (2002) 771–832.
[5] R. M. Badger, “The ammonia, carbon, hydrogen cyanide hydrogen equilibrium and the free energy of hydrogen cyanide”, J. Am. Chem. Soc. 46 (1924) 2166–2172.
[6] T. K. Sherwood, E. R. Gilliland, S. W. Ing, Hydrogen Cyanide Synthesis from Elements and from Ammonia and Carbon, Indust. Eng. Chem. 52 (1960) 601–604.
[7] T.K. Sherwood, R.O. Maak, “the reaction of ammonia with carbon at elevated temperatures”, Ind. Eng. Chem. Fund. 1 (1962) 111–115.
[8] F. K. Van Dijen, J. Pluijmakers, The removal of carbon or carbon residues from ceramic powders or greenware with ammonia, J. Eur. Ceram. Soc. 5 (1989) 385–390.
[9] P. Dibandjo, L. Bois, F. Chassagneux, J. M. Letoffe, P. Miele, Influence of the thermal process of carbon template removal in the mesoporous boron nitride synthesis, J. Porous Mater. 15 (2008) 13–20.
[10] Y.S. Liu, S. Hashimoto, K. Abe, “X-ray photoelectron spectroscopy of nitride layer on SiC by thermal nitridation using NH3”, Materials Science Forum 457–460 (2004) 1549–1552.
[11] Y.S. Liu, S. Hashimoto, K. Abe, “Characterization of nitride layer on 6H–SiC prepared by high temperature nitridation in NH3”, Jap. J. App. Phys. 44(1B) (2005) 673–676.
[12] Langlais F, Le Poche H, Lavenac J, Féron O, “Multiple experimental investigation for understanding CVD mechanism: exemple of laminar pyrocarbon deposition”, Proceedings of the Fifteenth European Conference on Chemical Vapor Deposition (EUROCVD-15), A. Devi, R. Fischer, H. Parala, M. D. Allendorf and M. Hitchman eds., The Electrochemical Society, PV 2005–09: (2005) pp. 73–86.
[13] B. Reznik, K.J. Hüttinger, “On the terminology for pyrolytic carbon”, Carbon 40 (2002) 621–624.
[14] X. Bourrat, A. Fillion, R. Naslain, G. Chollon, M. Brendlé, “Regenerative laminar pyrocarbon”, Carbon 40 (2002) 2931–2945.
[15] X. Bourrat, F. Langlais, G. Chollon, G.L. Vignoles, ”Low temperature pyrocarbons : A review”, J. Braz. Chem. Soc. 17 (2006) 1090–1095.
[16] J. M. Vallerot, X. Bourrat, A. Mouchon, G. Chollon, “Quantitative structural and textural assessment of laminar pyrocarbons through Raman spectroscopy, electron diffraction and few other techniques”, Carbon; 44 (2006) 1833–1844.
[17] G. Chollon, S. Delettrez, F. Langlais, “Chemical vapour infiltration and mechanical properties of carbon open-cell foams”, Carbon 66 (2014) 18–30.
[18] L. Kocon, T. Piquero, “Aerogels and opened-cell structures: two examples of carbon foams”, Actual. Chim. 295–296 (2006) 119–123.
[19] H. Ichikawa, “Polymer-Derived Ceramic Fibers”, Annu. Rev. Mater. Res. 46 (2016) 335– 56.
[20] P. Lecoustumer, M. Monthioux, A. Oberlin, “Understanding Nicalon fibre”, J. Eur. Ceram. Soc. 11 (1993) 95–103.
[21] K. Kumagawa, H. Yamaoka, M. Shibuya, T. Yamamura, “Fabrication and mechanical properties of new improved Si–M–C–(O) Tyranno® fiber”, Ceram. Eng. Sci. Proc. 19 (2000) 65–72.
[22] G. Chollon, “Oxidation behaviour of ceramic fibres from the Si–C–N–O system and related sub-systems”, J. Eur. Ceram. Soc. 20 (2000) 1959–1974.
[23] S. Mazerat, A. Delcamp, R. Pailler, J. Lamon, H. Plaisantin, “Improvement of silicon carbide fibers mechanical properties by Cl2 etching”, J. Eur. Ceram. Soc. 38 (2018) 5301–5310.
[24] F. Tuinstra, J.L. Koenig, “Raman Spectrum of Graphite”, J. Chem. Phys. 33 (1970) 1126– 1130.
[25] P. Kroll, “Searching insight into the atomistic structure of SiCO ceramics”, J. Mater. Chem., 2010, 20 (46), pp. 10528–10534.
[26] F. Teyssandier, G. Puyoo. S. Mazerat, G. Chollon, R. Pailler, F. Babonneau, “Contribution to the understanding of the microstructure of first generation Si‐C‐O fibers”, Ceram. Eng. Sci. Proc. 33 (2013) 1–10.
[27] Z.L. Zhang, R. Brydson, Z. Aslam, S. Reddy, A. Brown, A. Westwood, B. Rand, “Investigating the structure of non-graphitising carbons using electron energy loss spectroscopy in the transmission electron microscope”, Carbon 49 (2011) 5049–5063.
[28] X. Bertran, G. Chollon, J. Dentzer, R. Gadiou, S. Fouquet, “Oxidation behavior at moderate temperature under dry and wet air of phenolic resin-derived carbon”, Thermochim. Acta 649 (2017)13–21.
[29] G.M. Jenkins, K. Kawamura, “Structure of glassy carbon”, Nature, 231 (1971), 175–176. [30] G. M. Jenkins, K. Kawamura, L. L. Ban, “Formation and structure of polymeric carbons”, Proc. Royal Soc. A327 (1972) 501–517.
[31] P.J.F. Harris, “Structure of non-graphitizing carbons”, Int. Mat. Rev. 42 (1997) 206–218. [32] A. Jorio, M. Dresselhaus, R. Saito, F. Dresselhaus, “Raman Spectroscopy in Graphene Related Systems”, Whiley-VCH, Winheim (Germany) (2011).
[33] R. Sauvageot, P. Wehrer, X. Duval, “Nature et caractéristiques des réactions de l’ammoniac avec le carbone porté à très hautes températures” J. Chim. Phys. 81 (1984) 65–72. [34] M. Katsura, K. Nishimaki, T. Nakagawa, “Thermodynamics of the formation of CH4 by
the reaction of carbon materials by a stream of NH3”, J. Nucl. Mater. 258–263 (1998) 839–842.
[35] P.L. Walker, F. Rusinko, L.G. Austin, “Gas reactions of carbon”, Adv. Catalysis, 11 (1959) 133–220.
[36] N.R. Laine, F.J. Vastola, P.L.Walker, “The importance of active surface area in the carbon-oxygen reaction”, J. Chem. Phys. 67 (1963) 2030–2034.
[37] L. R. Radovic, P. L. Walker, R. G. Jenkins, “Importance of carbon active-sites in the gasification of coal chars” Fuel 62 (1983) 849–856.
[38] P.L. Walker, R.L. Taylor, J.M. Ranish, “An update on the carbon-oxygen reaction”, Carbon 29 (1991) 411–421.
[39] P. Ehrburger, F. Louys, J. Lahaye, “The concept of active sites applied to the study of carbon reactivity”, Carbon 27 (1989) 389–393.
[40] J. Lahaye, J. Denzer, P. Soulard, P. Ehrburger, “Carbon gasification: the active site concept”, pp. 143–162 and the whole book: Fundamental issues in control of carbon gasification reactivity, J. Lahaye and P. Ehrburger eds., Series E : Applied Sciences, vol. 192, Kluwer Academic Publishers 1991.
[41] L.R. Radovic, “Carbons and Graphites, Reactivity of” Encyclopedia of Materials: Science and Technology (2nd edition), 2001, pp. 975–984.
[42] L.R. Radovic, “Active sites in graphene and the mechanism of CO2 formation in carbon
oxidation”, J. Am. Chem. Soc. 131,(2009) 17166–17175.
[43] F. Banhart, J. Kotakoski, A.V. Krasheninnikov, “Structural Defects in Graphene”, ACS Nano, 5 (2011) 26–41.
[44] A. Arenillas, F. Rubiera, C. Pevida, C.O. Ania, J.J. Pis, “Relationship between structure and reactivity of carbonaceous materials”, J. Therm. Anal. Calorim. 76 (2004) 593–602. [45] K. Kumagawa, H. Yamaoka, M. Shibuya, T. Yamamura, “Fabrication and mechanical properties of new improved Si–M–C–(O) Tyranno fiber”, Ceram. Eng. Sci. Proc. 19 (1998) 65– 72.
Tables Si (wt. / at. %) C (wt. / at. %) O (wt. / at. %) Zr (wt. / at. %) H (wt. %) Free C (wt. / at. %) dSiC (nm) NL-200 55.9 / 38.4 29.5 / 47.3 12.0 / 14.4 - < 0.30 10.3 / 16.1 1.5 ZMI 53.1 / 35.4 34.8 / 54.4 8.6 / 10.0 1.1 / 0.2 0.33 15.6 / 23.7 2.1
Table 1: Elemental composition and SiC-grain size of the Si-C-O fibers (as measured by elemental analysis and XRD, respectively). Atomic concentrations are calculated from weight concentrations (hydrogen is not taken into account). The free carbon concentrations are calculated directly from atomic concentration [22]
Si (at. %) C (at. %) O (at. %) Free C (at. %) tc (nm) dSiC (nm) CVD0 50 50 <2 0 >1000 510 CVD20 40 60 20 200 - CVD70 15 85 70 400 -
Table 2: Chemical composition, SiC-grain size and thickness of the CVD SiC–C coatings (from AES and TEM [2] analyses, respectively)
T (°C) P (kPa) Q (sccm) Ea (kJmol-1) n Graphite 970 10–100 400 – 0.32 0.04 VCF1000 0.32 0.01 Graphite 900–1070 10 50 271 7 – 400 325 8 VCF1000 700–900 249 8 VCF2000 950–1050 307 2
Table 3 : Kinetic law parameters, for the graphite and vitreous carbon foam specimens. Experiment / specimen Coating / tc (nm) NH3 treatment T (°C) Q (sccm) P (kPa) r (h) CVD70-10-3 CVD70 / 400 1095 400 10 3 CVD70-50-3 CVD70 / 400 50 3 CVD70-50-0.25 CVD70 / 400 0.25 CVD20-50-3 CVD20 / 200 3 CVD0-50-3 CVD0 / >1000 3
Table 4 : Experiment/specimen name and NH3 treatment conditions of the various CVD SiC–
Figure Captions
Fig. 1: Raman spectra of the Si–C–O fibers and the vitreous C foam specimens
Fig. 2: AES profile of the pristine Tyranno ZMI fiber.
Fig. 3: AES profile of the pristine CVD70 coating.
Fig. 4: TEM images of a pristine CVD70 coating. (a) C-002 dark field, (b) high resolution and
selected area electron diffraction pattern (inset).
Fig. 5: Raman spectrum of the pristine CVD70 coating.
Fig. 6: Influence of the NH3 flow rate on the etching rate (P = 10 kPa).
Fig. 7: Influence of the temperature on the etching rate (P = 10 kPa, Q = 400 sccm except *: 50 sccm).
Fig. 8: Influence of the pressure on the etching rate (Q = 400 sccm).
Fig. 9: In situ FTIR spectra of the gas phase, with or without a vitreous C foam in the hot zone. (a) complete spectra and enlarged spectra showing the (b) ν(N-H) and ν(NC-H) vibrations, respectively in NH3 and HCN and (c) ν(C-H) vibration in CH4.
Fig. 10: SEM micrographs showing the surface of the (a) pristine and (b) etched (P = 10 kPa, Q = 400 sccm, T ≤ 1095 °C, see Fig. 7) graphite specimens.
Fig. 11: SEM micrographs showing the surface of the (a) pristine and (b) etched (P = 10 kPa,
Q = 400 sccm, T ≤ 875 °C, see Fig. 7) vitreous C foam (VCF1000) specimens.
Fig. 12: AES profile of the treated ZMI fiber (P = 100 kPa, T = 1100 °C, Q = 40 sccm, r = 5
h).
Fig. 13: Influence of the treatment time of the Si–C–O fibers on the thickness of the reaction layer (P = 100 kPa, T = 1100 °C, Q = 40 sccm).
Fig. 14: Raman spectrum from the CVD70-10-3 specimen (see Table 4).
Fig. 15: AES profile from the CVD7-10-3 specimen (see Table 4).
Fig. 16: Raman spectrum from the CVD70-50-3 specimen (see Table 4).
Fig. 17: AES profile from the CVD70-50-3 specimen (see Table 4).
Fig. 18: Raman spectra from the CVD70-50-0.25 and CVD20-50-3 specimens (see Table 4).
Fig. 19: AES profile from the CVD0-50-3 specimen (see Table 4).
200
600
1000
1400
1800
Wavenumber (cm
-1)
In
ten
sity
(arb
. u
nit
s)
D
G
SiC
NL-200
ZMI
VCF
1000VCF
20000
10
20
30
40
50
60
0
50
100 150 200 250 300 350 400
Si
C
O
Zr
Depth (nm)
Atom
ic co
n
ce
n
tratio
n
(%
)
0
10
20
30
40
50
60
70
80
90
100
0
100
200
300
400
500
600
Depth (nm)
Atomic co
nce
ntra
tion
(%)
Si
C
O
Fig. 4
DF-C
002
(a)
(b)
Coating axis
Coating axis
Fig. 4: TEM images of a pristine CVD
70coating. (a) C-002 dark field, (b)
high resolution and selected area electron diffraction pattern (inset).
Fig. 5
200
600
1000
1400
1800
Wavenumber (cm
-1)
In
tens
ity
(arb
. u
nit
s)
D
G
Fig. 6
0
10
20
30
40
50
60
0
100
200
300
400
500
600
K
(
m
gm
in
-1cm
-2)
Q (sccm)
Graphite / T = 1095 °C
VCF
1000/ T = 850 °C
(1)
(2)
Fig. 7
0.1
1
10
100
0.7
0.75
0.8
0.85
0.9
0.95
1
1.05
1000/T (K
-1)
K
(
m
g
min
-1cm
-2)
1100
1000
900
T (°C)
700
Graphite
Graphite*
(Q = 50 sccm)
VCF
1000VCF
2000Fig. 7: Influence of the temperature on the etching rate
(P = 10 kPa, Q = 400 sccm except *: 50 sccm).
Fig. 8
0
0.5
1
1.5
2
2.5
3
3.5
1
1.5
2
2.5
3
3.5
4
4.5
5
lnP (kPa)
ln
K
(
m
gmi
n
-1cm
-2)
Graphite / T = 970 °C
VCF
1000/ T = 850 °C
Fig. 9a
Fig. 9: In situ FTIR spectra of the gas phase, with or without a vitreous C foam in
the hot zone. (a) complete spectra and enlarged spectra showing the (b) ν(N-H) and
ν(NC-H) vibrations, respectively in NH
3and HCN and (c) ν(C-H) vibration in CH
4.
1000 1500 2000 2500 3000 3500 4000
ν(NH) ≈ 3334 cm
-1ν(NC-H)
2803cm
-1δ(N-H) ≈ 1626 cm
-1δ(H
2N-H)
931 cm
-1NH
3+ vitreous C foam
NH
3Wavenumber (cm
-1)
δ(NC-H) ≈ 713cm
-1Abs
orbanc
e
0 10 20 30 40 50See Fig. 7b
(a)
Fig. 9b
Fig. 9: In situ FTIR spectra of the gas phase, with or without a vitreous C foam in
the hot zone. (a) complete spectra and enlarged spectra showing the (b) ν(N-H) and
ν(NC-H) vibrations, respectively in NH
3and HCN and (c) ν(C-H) vibration in CH
4.
ν(NH) ≈ 3334 cm
-1 3100 3200 3300 3400 3500 3600ν(NC-H)
3260 cm
-1NH
3+ vitreous C foam
NH
3Wavenumber (cm
-1)
Abs
orbanc
e
0 10 20 30(b)
Fig. 9c
Fig. 9: In situ FTIR spectra of the gas phase, with or without a vitreous C foam in
the hot zone. (a) complete spectra and enlarged spectra showing the (b) ν(N-H) and
ν(NC-H) vibrations, respectively in NH
3and HCN and (c) ν(C-H) vibration in CH
4.
3050